Munich Personal RePEc Archive
Promoting pro-social behavior with
public statements of good intent
Koessler, Ann-Kathrin and Page, Lionel and Dulleck, Uwe
Institute of Environmental Systems Research, University of
Osnabrueck, Germany, School of Economics and Finance, Business
School, Queensland University of Technology, Australia
2015
Online at
https://mpra.ub.uni-muenchen.de/80072/
Promoting pro-social behavior with public
statements of good intent
Ann-Kathrin Koessler1, Lionel Page2, and Uwe Dulleck2
1Institute of Environmental Systems Research, University of
Osnabrueck, Germany
2School of Economics and Finance, Business School, Queensland
University of Technology, Australia
Abstract
Voluntary and compulsory (but rarely enforced) public statements of good intent are frequently observed in the real world, as for example the ‘Banker’s oath’, the ’Hippocratic oath’ or the requirement of many academic journals for authors to affirm that research was carried out ethically.
In this study we investigate what effect such public statements have on contribution behavior in a public goods experiment. We argue that compliance with professional conduct can be seen as a public good and public statements of good intent can therefore be a low-cost policy intervention to foster contributions for the public good.
Using a ’between-within subjects design’ we identify three chan-nels by which non-enforceable statements of intent are associated with higher levels of contributions to the public good. First, in a selection ef-fect, socially-oriented participants are more likely in the experiment to make a public statement. Second, in a commitment effect, participants who make a public statement are contributing more to the public good. Third, in a coordination effect, aggregate contributions are higher when ’Statement-Makers’ observe that also other group members make the statement. The latter explains why compulsory statements of good intent are more effective over time.
Keywords: social dilemma, prosocial behavior, commitment, compli-ance, group decision making, policy making
JEL Classification: A13, C72, C91, H41 PSYINFO Classification: 3660, 3000, 3020
∗Contacts: Koessler, corresponding author: annkathrin.koessler@uos.de;
1
Introduction
‘Codes of conduct’ are widely used in practice to promote pro-social be-havior. The ‘Banker’s oath’, the ’Hippocratic oath’ or the requirement of many academic journals for authors to affirm that research was carried out ethically can serve as examples. These pledges can be understood as pub-lic statements of good intent which are intended to motivate individuals to remember their social orientation and consequently contribute to the public good. Given that these statements are a relative low cost policy instrument, we believe that it is important to understand how they affect behavior. Ex-isting studies focus on the effect of intent statements in bilateral interactions (see for example Ellingsen and Johannesson(2004), Charness and Dufwen-berg (2006) and VanDufwen-berg (2008)). Evidence on the role of public promises in influencing group behavior by contrast limited. In this study, we focus on the social dimension of misconduct and the effect of non-enforceable compliance statements to reduce individual free-riding and misconduct.
To better understand the link between these public statement and re-sulting changes in behavior we undertook an economic experiment in the controlled setting of a laboratory. This experiment allows us to identify three ways in which public statements of good intent can be associated with higher levels of contributions to a public good: a selection effect, a commit-ment effect, and a coordination effect.
The selection effect refers to the fact that the statement is more likely to be made by individuals who contribute to the public good anyway. We are able to disentangle this effect by starting our experiment with a baseline session before introducing the possibility make a pledge. We then identify the real effect of the public statement by comparing the levels of contribu-tions before and after the statement introduction and between treatment groups. Changes in behavior after the pledge are due to two origins: first, a preference for keeping one’s word leads to a direct commitment effect and second, observing others making (also) the statement helps to coordinate on better group outcomes. This coordination effect is particularly dominant when the dynamic development of contributions is taken into account.
This research is in our eyes very timely. After various cases of profes-sional misconduct, pledges and public statements of intended behavior have repeatedly received attention in the public debate.
In many industries individual actors can gain private benefits by deviat-ing from professional standards: a doctor or lawyer may charge for services not provided, a researcher may manipulate data, a bank employee may give advice that is not in the client’s best interest. These behaviors have often been analyzed and simply judged as criminal or unethical behavior in bilat-eral relationships. However, unethical conduct not only carries costs for the client or patient, but also implies potential costs for the entire profession.
credibility in the entire scientific community (See Ioannidis (2005); Martin-son et al. (2005); Fanelli (2009) for a general discussion on scientific fraud; Begley and Ellis (2012) for unreproducible ‘landmark’ studies in cancer search; List et al. (2001); Necker (2014) for a discussion of economic re-search.). Tighter regulations, and fewer investments or client interactions may result from the erosion of professional integrity. And even without ob-vious and publicized misconduct negative effects are present. In the case of scientific research, unethical methods, for example, limit the progress in the field.
On the basis of these market externalities we argue that professional con-duct posses the characteristics of a public good; and is the reason why we investigate the matter within a public good game. In practice, one approach for addressing misconduct issues is to require oral and written statements from actors in the field in question, promising proper, pro-social conduct. Statements of this kind are either voluntary or compulsory. The Hippo-cratic Oath of doctors or statements of good conduct that are compulsory for many academic journals serve as examples. It is also becoming more popular to require oaths for economists (DeMartino, 2010), bankers and managers. While some of these pledges are voluntary and others are com-pulsory1. Whether a voluntary or compulsory statement is the better choice is surely context dependent, but based on our results we demonstarte that the overall increase in pro-social behavior is longer lasting when all players make the statement.
The remainder of the paper is organized as follows. In Section 2 we re-view the related literature. In Section 3 we present the experimental design. Behavioral predictions are listed in Section 4, followed by the experimental results in Section 5. Finally, we conclude with some discussion and potential insights for management practice in Section 6.
2
Related Literature
Academic interest on oaths and codes of good conduct as institutionalized coordination devices is only just emerging (de Bruin and Dolfsma, 2013). In an economic experiment, Jacquemet and colleagues (2013) introduced a voluntary solemn oath to tell the truth during experiments. Following the oath, participants were more likely to reveal their true preferences. Also Carlsson et al. (2013) and Stevens et al. (2013) show that an oath helps to eliminate a hypothetical bias in a contingent valuation task. In a follow-up study, Jacquemet et al. (2015) provide additional evidence that the tested
1
solemn oath not only helps in revealing true preferences in willingness to pay questions, but also promotes truthful communication in experiments. As a consequence, coordination failure is less common in a congestion game (Jacquemet et al., 2015). Further evidence for the effectiveness of ethical declarations is provided by Mazar et al. (2008). At the beginning of the experiment participants were told that the study falls under the university’s honor code. Following this announcement significantly more students self-reported honestly the amount of test questions answered correctly. Not only pledges, but also the act of signing an undertaking is found to have a significant effect on behavior. Shu et al. (2012), for example, find in a field study that signing a (tax) declaration at the beginning of the document rather than at the end leads to more truthful reports.
Contrary to these studies which investigate the effect of a vow on hon-esty, we are interested in the impact of a public statement of intent on actions, i.e. pro-social behavior. Such as in the real world examples of the ‘Banker’s oath’, the ’Hippocratic oath’ or general business code of con-ducts we are looking at public statements of intent given by an institution. The communicative act, in form of a public statement of good intent, is in-duced with the aim to motivate the agents to act pro-socially in the future. With the psychological concept of cognitive dissonance (Festinger, 1957) a resulting positive effect on the behavior can be explained. According to this concept, individuals seek for consistency in their behavior and experi-ence emotional disutility when acting inconsistently with previous actions or statements. The avoidance of inner disharmony motivates thus the commit-ment towards the action stated. Hence, even in anonymous interactions, in which reputational concerns are non-existent, statements of intent can create commitment. This perspective stands in contrast to the standard economic assumption that communication is under such conditions ineffective cheap talk.
Complementary research in experimental economics shows that a sub-stantial number of individuals avoid lying, even if they have to forgo a material gain by doing so (Gneezy, 2005; Kartik et al., 2007; Kartik, 2009; Hurkens and Kartik, 2009; Lundquist et al., 2009; Fischbacher and F¨ ollmi-Heusi, 2013). People who make a promise about future cooperative behavior in pre-play communication, are likely to keep their word2.
The strength of commitment induced by the promise may vary with
2
the form of statement made. Research in social psychology stress in this context the importance of decision autonomy (Joule and Beauvois, 1998). Individuals who decide freely to express an intention about future behavior feel committed to this action (Kiesler, 1971; Schlesinger, 2011). Elicited or pre-formulated promises, by contrast, have none or only limited effect (Charness and Dufwenberg, 2010; Belot et al., 2010). Also, public promises have a stronger commitment effect than private pledges (Joule and Beauvois, 1998); and being engaged in a pledge, i.e. the statement making is in some form effortful, increases the binding function.
So far, the behavioral impact of statements of intent has been analyzed in one-on-one interactions. Often promises are used in these studies to signal trustworthiness, so that a consequent interaction will take place. We, on the contrary, study a promise addressed to a group and investigate whether the publicly expressed intention to act in a socially beneficial way can help to circumvent a social dilemma. This links our work to a vast amount of stud-ies on the effect of communication in social dilemma situations (Ledyard, 1995; Chaudhuri, 2011, for reviews)3. In these situations communication reduces strategic uncertainty and subjects treat one another’s messages as a serious attempt to coordinate (Ostrom et al., 1992; Bochet et al., 2006). Communication may also help to establish a social norm and improve the understanding of the common situation (Kerr and Kaufman-Gilliland, 1994). In reality, however, discussions between all actors involved in a social dilemma situation can be very time consuming or just not feasible (Messick et al., 1983). Finding consensus in an open discourse format poses an ad-ditional challenge. To restrict communication in these settings may help to ease coordination. Koukoumelis et al. (2012) provide in this context first evidence that the cooperation enhancing effect of communication also exists when not all group members can communicate with each other. In their study they give the option to send a free message only to one randomly selected person in a public good game. Contributions still increase substan-tially. Our study is similar to Koukoumelis et al. (2012)’s in the regard that also we offer only one message as a coordination device; a design feature which may ease efficiency and substantially lowers communication costs in reality. However, in contrast to Koukoumelis et al. (2012), the message in our design is not endogenously chosen by one of the group members, but given and predetermined by an institution. We gain with this design dif-ference control since the message content is not arbitrary. Moreover, our design elicits a form of self-commitment from each player. For previously
3
listed reasons, we expect the effect of the statement thus to be stronger than in the pure messaging setting of Koukoumelis et al. (2012).
Close to our work are also the studies of Dannenberg (2015) and Tavoni et al. (2011). Both studies model the decision process of national contribu-tions in climate negotiacontribu-tions. In the setting of a public good game players need to decide to contribute to the common (mitigate climate change) or keep the endowment for their private interests.
In Dannenberg (2015), one player can announce the intended contri-bution level before all players need to make their final allocation decision. This communicator is either randomly chosen or volunteers, depending on the treatment variation. Only when the communicating player volunteered, a small increase in contributions is observed. Pledged contribution levels, howsoever, were high in both treatment groups, but rarely followed through. Followers anticipated this inconsistency and the pledge was consequently not an effective tool to coordinate on higher contributions4. In Tavoni et al. (2011)’s study all players are given the option to announce their intended contribution in a threshold public good game. This non-binding pledge (op-tion) effectively increased contributions to the common and was a successful coordination mechanism to reach the threshold to avert a climate catas-trophe. In Tavoni et al. (2011) as well as Dannenberg (2015), the decision situation is strongly framed and announced contribution levels are arbitrary. Our study adds to this literature by offering a highly controlled mes-sage as a coordination device in an abstract social dilemma situation. We furthermore identify the channels through which a statement of intent may affect the contribution behavior. Existing promise or oath studies identified the effect of a statement so far in a between-subject design. Consequently, it is not clear whether an increase in pro-social behavior, observed in these studies, is due to a commitment effect or due to the fact that only socially oriented people are making a statement about intended social behavior. In our within-subject design we can address this issue and can distinguish be-tween a selection and a commitment effect. Additionally, we control in a between-subject treatment variation whether the commitment effect varies when the statement is voluntary or compulsory.
3
Experiment
3.1 Design
For this experiment we employed a standard linear public good game with a voluntary contribution mechanism (Marwell and Ames, 1979). The exper-iment consisted of two stages and subjects played in each stage ten rounds
4
of the standard public good game. The first stage served as a baseline to measure heterogeneity and allows us to carry out a within-subject analysis. Groups of four were randomly formed and at the beginning of each round subjects were endowed with 20 Experimental Currency Units, which they could consume either privately or contribute to a public good. The payoff function was the following:
p= 20−zi+ 0.4∗
n
X
j=1
zj (1)
zi denotes i’s contribution level, where 0< zi <20 and 0.4∗ n
P
j=1
zj presents
the income from the project. Contributions to the public good increase the collective output, but the marginal per capita return of a contribution is less than one. Therefore, the dominant strategy of a profit maximizing individual is to keep the entire endowment for oneself and free-ride on the contributions of the other players.
After the ten rounds, experimental groups were re-matched5 and the treatment variations were implemented. Participants were randomly allo-cated between three groups: Control, Voluntary and Compulsory. Table 1 summarizes the design. In the two treatment groups a statement was of-fered to communicate intended future contribution behavior. The promise was directed to the other group members and stated that the player will make significant contributions to the project, at least 75% of the endow-ment6 , in each of the subsequent ten rounds of the second stage.
In the first treatment group (Voluntary) participants simultaneously de-cided whether or not to make this statement, in the second treatment group (Compulsory) players had to make the statement in order to proceed in the experiment. In both cases it was made explicit that making the state-ment has no consequence on the set of possible future choices and does not limit the decisions later in the experiment. All participants who decided to pledge the statement had to type in the following, ’I promise to contribute each round at least 15 ECUs to the project’. According to Kiesler (1971) and Joule and Beauvois (1998) commitment is stronger when the subject is engaged in the act of promise making. For this reason we chose the typing instead of choosing the statement by purely checking a box.7
5
The rematching of players was done in a way that no player interacted with one player twice. With 16 participants per session a perfect stranger matching was guaranteed and this was common knowledge.
6
We have chosen 75% instead of 100%, the Pareto optimal contribution level, to still allow for some latitude in the contribution choices.
7
Table 1: Experimental Design
STAGE 1 STAGE 2 N
CONTROL Standard PGG Standard PGG 64
VOLUNTARY Standard PGG
Voluntary Statement
64 Standard PGG
COMPULSORY Standard PGG
Compulsory Statement
64 Standard PGG
Before the first contribution decision in Stage 2, all players in the two treatment groups learned which players in their group (also) made the state-ment. Statement-Makers were consequently labelled in the second stage. Screenshots and instructions can be found in the Appendix.
To control how beliefs influenced the contribution choice, we asked sub-jects after their contribution decision, to indicate their expectations about the contributions of the other players (first order beliefs) and the guess of others expectations with respect to their own contributions (second order beliefs)8. After all participants stated their beliefs for each group member, feedback was given about all individual contributions within one’s group9. To determine the payments for the decision choice and the accuracy of the beliefs three rounds were randomly selected at the end of each stage. By this mechanism we minimized wealth effects and prevented hedging within a stage.
3.2 Behavioral Predictions and Identification Strategies
Under the assumption of purely self-serving and money maximizing behav-ior, contributions are expected to be 0 in all groups and stages. Statements,
8
The belief payment function was incentive compatible and based on the quadratic scoring rule. However, to make it easier for the students to understand, we described the possible outcomes verbally in the instructions (see Appendix). We elicited the beliefs in both stages and all treatment groups.
9
if they are made, are considered as meaningless by the participants and do not affect their choices of contribution. This also applies to the repeated set-ting of the game. A rational decision maker will always break the promise in the last round and try to free-ride on the contributions of the others. Ap-plying backward induction, the statement is consequently also non-credible in all previous rounds.
Empirical evidence, however, shows human behavior deviates fundamen-tally from these predictions. Contributions in public good games are on av-erage between 40−60% of the endowment and deteriorate over repetitions
of the game (Ledyard, 1995; Fehr and G¨achter, 2000; Chaudhuri, 2011). Moreover, non-institutionalized, multilateral communication enhances the contribution levels significantly (Sally, 1995; Bochet et al., 2006; Balliet, 2009). Koukoumelis et al. (2012)’s study provides first evidence that also one-dimensional communication may be sufficient to increase public good contributions.
Following these insights, public and institutionalized statements of intent should increase contributions to the public good in this experiment. This reasoning is also supported by the promise literature. Individuals are reluc-tant to lie; either because the person has a preference for keeping their word (Ellingsen and Johannesson, 2004; Vanberg, 2008) or because the promisor does not want to go against the social norm of not breaking a promise (Bin-more, 2006; Bicchieri and Lev-On, 2007). Other authors argue that the effect is more indirect: the statement raises the expectations of others, the promisor anticipates this and is motivated not to disappoint the expectations of the interaction partners (Charness and Dufwenberg, 2006). Both theories, howsoever, suggest that making a statement increases contributions to the public good in our experiment.
In case of the voluntary statements, this increase can come from two po-tential explanations: First, aselection effect indicating that people who are intrinsically motivated to contribute more, tend to make the statement; sec-ond, acommitment effect, based on the theories above the pledge motivates an increase in contributions. Given our experimental design, the treatment group 1 (Voluntary) allows us to disentangle the commitment effect from the selection effect by comparing the Stage 1 to the Stage 2 behavior, where the voluntary statement was offered. We can see whether participants who voluntarily choose to make the statement in Stage 2, have on average, higher contributions in Stage 1 (selection effect). And we can determine if partic-ipants who voluntarily made the statement, increase their contributions in Stage 2 compared to Stage 1(commitment effect).
Hypothesis 1 (selection effect): Participants who voluntarily choose to make the statement in Stage 2, have on average higher contributions in Stage 1.
state-ment subsequently increase their contributions to the public good in Stage 2 compared to their contributions in Stage 1.
If making a statement triggers commitment, due to lying aversion or cognitive dissonance, and the interaction partners are aware of this effect, they may also adapt in their contribution behavior. To be more specific, if subjects observe other group members are making the statement, they expect higher group contributions in the future. Following conditional reci-procity(Fischbacher et al., 2001), this belief change motivates the subject to also contribute more to the public good. We refer to this as coordination effect, and see it as the second source for an increase in pro-social behavior after a pledge. In the compulsory treatment this coordination effect should be stronger, since all subjects (are forced to) make the statement. Particu-larly over time we expect this coordination effect to extrapolate.
Hypothesis 3 (coordination effect): In treatment group 2, where statements are compulsory, a positive increase in contributions can be sus-tained for longer than in treatment group 1, where statements are voluntary and the number of Statement-Makers is thus determined endogenously.
Nevertheless, with respect to the self-driven commitment it is to men-tion that existing research (Kiesler, 1971; Schlesinger, 2011; Charness and Dufwenberg, 2010; Belot et al., 2010) indicates that the effect of a com-pulsory statement should be weaker than of a voluntary statement, since participants do not decide autonomously to commit. But this finding is de-rived from studies analyzing the effect of a promise in bilateral interactions. No evidence exists for groups or aggregate contributions. Hence an open, empirical question is to what extent the commitment effect of a voluntary statement is stronger than of the commitment effect of a compulsory state-ment. By controlling for the amount of statements made in one group we observe a coordination component varying in strength. Particularly interest-ing are observations, where all group members voluntarily decide to make the statement. The comparison with the compulsory group can provide insights into how the obligation to make the statement impairs the commit-ment effect. One would expect that contributions in the voluntary groups with four Statement-Makers are higher than in the compulsory groups, since a strong commitment is paired with a high coordination component.
4
Results
change when the statement is compulsory (treatment group 2). Finally, we analyze the dynamic development of the effects.
4.1 Voluntary Statement
Whilst the rational money maximizing assumption predicts that statements are irrelevant and therefore not worth being made, we find subjects make the voluntary statement, and also get affected by it.
Overall, 48% of the subjects made the statement before entering Stage 2. We call these subjects Statement-Makers. Subjects who had the option to make a statement, but decided against it are referred to as Non-Takers. The two groups are noticeably different in their behavior10. Ultimately, Statement-Makers contribute significantly more in Stage 2 than Non-Takers (Pairwise Wilcoxon ranksum test11: Z = −3.682, p < 0.001). Table 2
provides an overview of the average contribution levels for each group and stage.12
[Table 2 here]
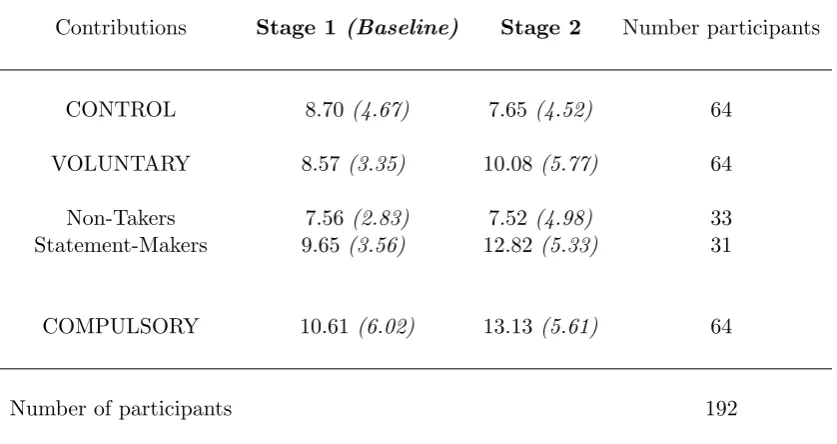
Result 1: Contributions in the Stage 2 are higher when subjects make voluntarily the public statement of good intent.
Comparing the contributions in Stage 1 between subjects who later make the statement and those who do not, we find strong support for aselection ef-fect. Contributions from Statement-Makers are significantly higher in Stage 1 than the contributions of Non-Takers (Z=−2.506, p= 0.0122). Figure 1
sketches this difference graphically.
Result 2: Subjects who decide to voluntarily make the statement, act al-ready before the pledge in a more socially oriented way. We call this selection effect.
[Figure 1 here]
In a second step, we investigate, whether contribution behavior changes due to the statement. On an aggregate level mean contributions in Stage 2 are significantly higher in the Voluntary treatment group than in the Control group (Z =−2.231, p= 0.0026), as well as compared to the own
contribu-tions in the baseline stage (Z = −2.210, p = 0.0271). The effect is driven
10
For example are women significantly less likely to make the voluntary statement. A detailed analysis on the individual characteristics of the Statement-Makers is offered in the Appendix.
11
Mean contributions per person, averaged over all stage rounds, are chosen as level of analysis, if not indicated differently.
12
Table 2: Average contributions for each group and stage
Contributions Stage 1 (Baseline) Stage 2 Number participants
CONTROL 8.70(4.67) 7.65 (4.52) 64
VOLUNTARY 8.57(3.35) 10.08 (5.77) 64
Non-Takers 7.56(2.83) 7.52 (4.98) 33
Statement-Makers 9.65(3.56) 12.82 (5.33) 31
COMPULSORY 10.61(6.02) 13.13 (5.61) 64
Number of participants 192
Note: Standard deviations are in parantheses.
Figure 1: Selection: Contributions in Stage 1
[image:13.595.178.413.465.635.2]by Statement-Makers. Their average contributions increase significantly in Stage 2 (Voluntary Statement-Makers - Stage 1 vs. Stage 2: Z =−2.732,
p= 0.0063)13.
By looking at the differences in contribution levels of Statement-Makers between Stage 1 and Stage 2, we can ensure that this effect is not due to selection, but due to a change in behavior that we call commitment effect (Difference in contribution levels between Stage 1 and Stage 2 - Vol. Statement-Makers vs. Non-Takers: Z = −3.070, p = 0.0021). Figure 2
displays the corresponding average differences in contribution levels.
Result 3: Statement-Makers show, in addition to their previously higher contributions, an increase in contributions after the statement of intent has been made. We call this commitment effect.
We described now the change in behavior of Statement-Makers. A change also the other players were able to anticipate in our experiment. Table 3 displays the expectations from other players, players’ own second-order beliefs and the actual contributions. To measure the pure effect of the statement in regard to others’ expectations, we look on the beliefs and contributions only from the first round of the second stage. This is the first interaction after a new group was matched. Players were at this point not yet able to predict the other players’ behavior based on the his-tory. Expectations towards Statement-Makers are significantly higher in the treatment group than in the Control group (Z = −4.114, p < 0.0001),
but also the expectations toward the Non-Takers are significantly higher (Z = −2.043, p = 0.0410). The difference between the first order beliefs
towards Statement-Makers and Non-Takers is hereby weakly statistically significant: Z=−1.797,p= 0.0723. This difference becomes stronger when applied to all rounds of Stage 2. Hence, introducing the statement influences positively the first order beliefs and helps to coordinate on a more efficient group outcome.
The second-order beliefs, in contrast, are only higher for the Statement-Makers. They believe that other players expect significantly higher contri-butions from them (Z = −5.572, p < 0.001). This finding is in line with previous research (Charness and Dufwenberg, 2006, 2010), which argued that promises are kept due to a expectation based guilt aversion. Accord-ing to this view, subjects raise the expectations (first-order beliefs) of other group members on their future contributions when making the statement. At the same time the Statement-Makers anticipate this raise (Second-order beliefs) and feel guilty when disappointing these raised expectations.
How-13
These results hold when the analysis is based only on the first round of Stage 2, i.e. when subjects have not received any information about the other group members’ contri-bution behavior and their reaction on the statement (Round 11 - Control vs Voluntary group: Z =−2.150,p= 0.0315; Voluntary Statement-Makers - Round 1 vs Round 11:
Table 3: Beliefs
Control Voluntary
Non-Taker Statement-Maker
Expectation of others 8.04 8.61 12.73
(3.82) (4.06) (4.17)
Second order belief 8.12 7.58 13.33
(4.41) (4.48) (4.79)
Corr.coef. 0.92 0.93 0.93
Real contribution 7.65 7.52 12.82
(4.53) (4.98) (5.33)
Note: This table presents the average beliefs and contributions in round 11, with standard de-viations in parantheses.
The first row displays the average expectation towards a player in the control group (column 1), a player who decided against the statement (column 2), and a player who made the state-ment (column 3). The second row lists the average second order belief, i.e. the guess of a player about the average expectations of the other group members about the own contribution behavior. The last row presents the average contributions realized by the respective players. The row in-between displays Pearson correlation coefficients, which measure the association between second-order beliefs and realized contributions.
ever, it needs to be here mentioned, that we are not able to rule out that Statement-Makers state higher second order beliefs simply to be consistent with the higher contributions made. To control for this is left for future research.
As a last analysis step in this section, we move the focus back to the ac-tual contributions, and perform a multivariate analysis controlling for group interdependencies and analyze how the take up of the statement by others affects the contribution behavior. Table 4 presents the results of Ordinary least square regression models estimating the average contributions for each stage and treatment group. Contributions of the Control group in Stage 1 serve as baseline.
Table 4: Average Contributions in Control and Voluntary
Model 1 Model 2 Model 3
Voluntary -0.127
(1.128)
Voluntary×No -1.138 -1.138
(1.158) (1.165) Voluntary×State 2.088** 2.088**
(0.816) (0.821)
Stage 2 -1.050 -1.050 -4.542***
(1.278) (1.283) (1.392) Stage 2×Voluntary 2.562
(1.814)
Stage 2×Voluntary×No 1.005 2.640
(1.803) (1.986) Stage 2×Voluntary×State 4.221** 3.922*
(1.930) (2.238)
Stage 2×Voluntary×No State×N State -1.056
(0.970) Stage 2×Voluntary×State×N State 0.178
(0.833)
Others contrib S1 0.134***
(0.0339)
Constant 8.698*** 8.698*** 8.698*** (0.988) (0.992) (0.998)
Observations 256 256 256
AdjustedR2
1 (p = 0.0129) than Non-Takers, this is what we described before as the
selection effect. These Statement-Makers additionally increase their con-tributions significantly in Stage 2 (p = 0.032). Model 3 considers as ad-ditional controls the subjects’ experience of others’ contributions in Stage 1 and the number of other players who (also) made a statement in the subject’s Stage 2 matching group (N State), considering also the subject’s own statement decision. When considering these additional influences, the commitment effect (Stage 2×V oluntary×N State) is slightly weaker, but
still significant (p = 0.085). The experience individuals made in Stage 1 has hereby a strong positive effect on the contribution behavior in Stage 2. The effect of the presence of (other) Statement-Makers depends on whether the individual is a Statement-Maker oneself. If this is the case (Stage 2×V oluntary×State×N State), the presence of other
Statement-Makers promotes contributions. When subjects, on the contrary, decided against the statement, the presence of Statement-Makers weakens average contributions. One possible interpretation for this is a diffusion of respon-sibility; when players decided not to take the statement and then observe that others pledged to contribute a substantial amount to the public good, the Non-Takers feel they can settle back.
To summarize, we observed that more socially oriented subjects select themselves into the statement and second, that Statement-Makers increase their contributions after the pledge. This increase is anticipated by the other group member and the Statement-Makers are aware of these higher expec-tations. We also observed that the change in contribution behavior is not only driven by the pure commitment towards the statement, but also influ-enced by the statement choices of the other players in the subject’s match-ing group. So is the contribution increase stronger when also other group members made the statement. We conclude that not only the self-driven commitment due to lying aversion determines the increase in contribution after the pledge, but also a coordination component. To investigate this influence further we contrast in the following the results from the voluntary treatment with a setting in which the statements were compulsory. The number of Statement-Makers was hence constant in this treatment group. Thereupon we will analyze the dynamic development over time.
4.2 Voluntary versus Compulsory Statements
self-driven commitment associated with a compulsory statement should be negligible since the pledge is not self-chosen (Kiesler, 1971; Joule and Beau-vois, 1998). Based on this second hypothesis, the commitment effect should be smaller in the compulsory setting than in the voluntary treatment group. Our data, however, provides opposing results.
When we compare the change in contributions on an individual level, i.e. comparing the effect of a voluntary versus a compulsory statement14, we find contributions increase slightly more when the statement is made voluntarily. However, this difference is not statistically different to the av-erage increase we observe for compulsory Statement-Makers (Z = 0.099, p= 0.9210). Figure 2 displays the average change in contributions for each round between Stage 1 and Stage 2, for Statement-Makers and Non-Takers in each group. The similarity remains when we exclude potential learning effects and base our analysis only on the first round after the statement has been made (Increase from Round 10 to Round 11: Voluntary Statement-Makers - 4.903 ECUs vs. Compulsory Statement-Makers - 4.734 ECUs: Z =−0.120p= 0.904). This finding stands in contrast to previous research
on statements in bilateral interactions, which argued that elicited, or else compulsory commitments are significantly less effective than voluntary ones (Charness and Dufwenberg, 2010; Belot et al., 2010).
Result 4: Contributions increase significantly after subjects made the compulsory statement. This increase is not statistically different to the in-crease in contributions of voluntary Statement-Makers.
[Figure 2 here]
Furthermore, when we pool the data over all subjects in the Voluntary group the average increase in the Compulsory treatment is weakly stronger than in the Voluntary treatment group (Z =−1.466, p = 0.1428). Hence,
we reject the hypothesis that compulsory commitments in a public good setting are less effective than voluntary ones. We even find weak evidence for higher contributions when the overall effect of the statements is analyzed.
This finding is also mirrored in the beliefs. Expectations towards Statement-Makers are higher in the Compulsory group than in the Voluntary group (First order beliefs: Voluntary Statement-Makers 12.73 ECUS (SD: 5.31), Compulsory Statement-Makers 13.75 ECUS (SD: 5.83): Z = −4.489, p <
0.001)15. And again anticipate the respective Statement-Makers these higher expectations correctly (Second order beliefs: Voluntary Statement-Makers 13.33 ECUS (SD: 6.09), Compulsory Statement-Makers 14.05 ECUS (SD: 5.85): Z =−2.21, p= 0.03). We attribute these findings to a coordination
14
Since baseline contributions in the compulsory group were higher than in the voluntary and control group, we base the comparison between treatments on the difference between Stage 1 and Stage 2 contributions.
15
Figure 2: Commitment: Difference between Stage 1 and Stage 2 contribu-tions
Note: This graph displays the average difference in contributions between Stage 1 and Stage 2, with error bars: As known from the literature, contributions in the Control group (left bar) are on average lower in Stage 2. For the Statement- Makers contributions increase on an aggregate level more in the Compulsory treatment group than in the Voluntary treatment group. We call thiscoordination effect. In the right panel, the contributions of Statement-Makers and Non-Takers in the Voluntary group (middle bar) are displayed separately. Contributions of voluntary Statement-Makers significantly increase, while the contributions of Non-Takers remain constant. Also for the compulsory Statement-Makers (right bar) contributions increased significantly. We call this increasecommitment effect.
effect. The assurance that everyone signed up for the same ’rule’, shifts ex-pectations and promotes higher contributions. Potentially this increase can compensate for a weaker intrinsically motivated commitment following the imposition of the pledge.
To investigate a possible difference between the voluntary and compul-sory statements in this self-driven commitment effect, we look at the data of two experimental groups, in which all four group members voluntarily chose to make a statement. Contributions, as well as the differences in contributions between Stage 1 and 2, are significantly higher in these two groups than in all other groups (contribution level: 15.46 ECUs (SD: 4.190), average increase 3.59 ECUs (SD: 2.33) compared to 2.52 ECUs (SD: 6.53) average increase in the Compulsory group, a graph with the respective con-tributions can also be found in the Appendix). While the high contribution levels can be explained by the selection effect, the stronger increase points to the positive combination of coordination and self-driven commitment. This observation, howsoever, is based on two experimental groups and can thus be taken only as indicative finding.
Result 5: Compulsory statements of intent are effective in motivating higher contributions to the common. The assurance that everyone has to make the statement eases coordination. We call this coordination effect.
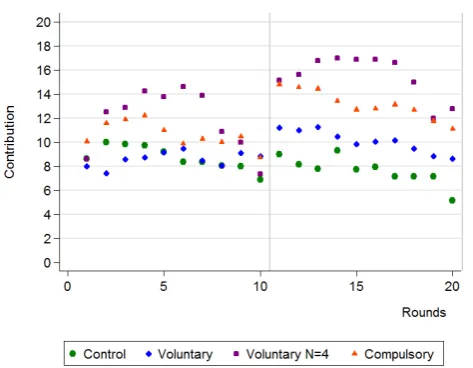
the existence of a coordination effect is also found in the development of contributions over time. Figure 3 shows first the dynamic development of contributions in each treatment group, then the fitted values of the differ-ences in contributions between Stage 1 and 2. The effect of a voluntary statement is, in the beginning, as strong as the compulsory statement, but the effect deteriorates faster when the statement is voluntary (p= 0.0753). The pattern is driven by participants who made the statement voluntarily and reduce their initial high contributions over time. This can be explained with conditional cooperation. After the first round, subjects learn how the other group members contribute and adjust their contributions accordingly; over time the good intentions of contributing 15 ECUs or more vanishes. In the compulsory group, contrarily, everyone committed to the statement and contributions stay high for longer.
[Figure 3 here]
[Table 5 here] The OLS regressions in Table 5 support these findings statistically. All estimations are based on the change of individual contri-butions for each round between Stage 1 and Stage 2. The left side of Figure 3 is based on Model 4. The coefficients ‘Voluntary’ and ‘Compulsory’, mea-suring the average difference in contributions between Stage 1 and 2, are not statistically different from each other (F = 0.86,p= 0.359), but statistically different to the change in contributions in the Control group (p <0.05). In this model, the developments over time are not statistically different be-tween the treatment groups (F = 0.144,p= 0.2362). Model 5 distinguishes between voluntary Statement-Makers and subjects who decided not to make a statement. The lower right side of Figure 3 is based on this estimation. The coefficients ’Voluntary State’ and ’Compulsory’, measuring the mean change in contributions between Stage 1 and 2 for voluntary and compulsory Statement-Makers, are statistically different (F = 6.61, p = 0.0133). This result indicates that voluntary statements possibly induce stronger, self-driven commitment at the beginning of Stage 2. The consequent increase in contributions, however, vanishes faster for the voluntary than for the com-pulsory Statement-Makers (H0: Voluntary×State×Round = Compulsory
×Round: F = 3.02, p= 0.0885). The results remain when the individuals’
average contribution level in Stage 1 is taken into account (Avg contrib S1). Groups, who made the compulsory statement are more steeled against the deterioration of contributions over time.
Result 6: The positive effect of the statement lasts longer in the Com-pulsory treatment group than in the Voluntary treatment group.
Result 6 suggests that not only compulsory statements of intent may help to reach higher level of contributions on an aggregate level in public good situations, they may also help to sustain this increase in contributions for longer.
Figure 3: Dynamic Development
(a) Note: This graph shows the average contributions of the Control, Voluntary and Compulsory treatment group in all rounds of Stage 1 and 2.
Table 5: Dynamic Change in Contributions, per Treatment in Stage 2
Model 4 Model 5 Model 6
Round -0.0485 -0.0485 -0.0485
(0.110) (0.110) (0.110)
Voluntary 7.838**
(2.991)
Voluntary×No 3.700 3.516
(3.132) (3.101)
Voluntary×State 8.542** 8.775**
(3.322) (3.320)
Compulsory 5.366** 5.366** 6.445**
(2.475) (2.477) (2.498) Voluntary×Round -0.340*
(0.187)
Voluntary×No×Round -0.174 -0.174
(0.190) (0.190) Voluntary×State×Round -0.517** -0.517**
(0.231) (0.231) Compulsory×Round -0.116 -0.116 -0.116
(0.156) (0.156) (0.156)
Avg contrib S1 -0.189***
(0.0231)
Constant -0.298 -0.298 4.625**
(1.993) (1.994) (1.980)
Observations 1920 1920 1920
AdjustedR2 0.039 0.052 0.131
In the first round of Stage 2 both groups of Statement-Makers, voluntary and compulsory, are with their contributions close to stated level (Voluntary Statement-Makers: 14.387 ECUS (SD: 5.018) and Compulsory Statement-Makers: 14.797 ECUs (SD: 5.265)). The compliance rates of 87% for the Voluntary Statement-Makers and 83% for the compulsory Statement-Makers are not statistically different (Z = 0.534, = 0.593). The compliance rates, however, deteriorate over the course of Stage 2 and reach on average 68% for the voluntary and 73% for the compulsory Statement-Makers. Over all rounds, compulsory Statement-Makers are thus weakly significantly more often compliant than voluntary Statement-Makers (Z =−1.671p= 0.095). The reason here fore lies in the faster depletion of the motivation of voluntary Statement-Makers to fulfill the statement when playing with Non-Takers. The two groups, in which all group members voluntary chose to make the statement are meeting, in comparison, in all rounds, except the last two, the required contribution level (Average contribution: 15.462 ECUs (SD:5.619)). This finding points again to the power of the coordination effect.
Result 6: Compliance with the statement of intent is more frequent in the Compulsory treatment group than in the Voluntary treatment group.
5
Conclusions
Our results suggest that public statements of good intent, used in oaths and codes of good conduct, can help to promote pro-social behavior in public good settings. On the assumption of rational behavior and pure self-interest one would see such statements as merely cheap talk and attribute behavioral changes, if at all, to aselection effect.
In this study we showed that this conclusion is wrong: with a within-subject design we controlled for endogeneity and demonstrated that the public statement elicits an additionalcommitment effect. Once a statement has been made, it has a positive effect on the level of contributions. We find hereby that the commitment effect has two components, the behavioral change due to the self-driven commitment and the effect of coordination which helps groups to coordinate on better outcomes. On basis of this
coordination effect contributions and compliance with the public statement was higher when all group members made a statement of good intent.
In constrast to bilateral interactions, this finding suggests compulsory statements of good conduct are more effective in promoting public good contributions.
distinction between a violation of norm conducts and simply less socially acceptable behavior is rather blurry.
These considerations are in general a downside of abstract laboratory experiments. But on the positive side, the purity of incentives and clarity of the decision setting formed a control, which enabled us to identify the three effects that motivate potential behavioral changes as a result of the use of public statements of good intent.
Our results suggest public statements of good intent can help to promote professional integrity. Our findings support policies that require public state-ments regarding conflicts of interest or ethical conduct, as is mandatory, for example, to enter a profession or for submission of an article to an academic journal.
In general, our research suggests that even a non-binding statement of the ’intended public good’ contribution increases the overall level of contri-butions and can hence be a low-cost policy intervention to increase adherence to norms associated with contribution to public goods. Thus, where it may be politically difficult to ensure adherence to legally binding rules and regu-lations that assure contributions to the public good, public statements may be a less invasive and politically-easier solution to mitigate this problem.
References
Balliet, D. (2009). Communication and cooperation in social dilemmas: A meta-analytic review. Journal of Conflict Resolution, 54(1):39–57.
Barger, S. D. (2002). The Marlowe-Crowne affair: Short forms, psychomet-ric structure, and social desirability. Journal of Personality Assessment, 79(2):286–305.
Basinger, K. S. and Gibbs, J. C. (1987). Validation if the social moral reflec-tion objective measure - A short form. Psychological Reports, 61(1):139– 146.
Battigalli, P., Charness, G., and Dufwenberg, M. (2013). Deception: The role of guilt. Journal of Economic Behavior & Organization, 93:227–232.
Begley, C. G. and Ellis, L. M. (2012). Drug development: Raise standards for preclinical cancer research. Nature, 483(7391):531–533.
Belot, M., Bhaskar, V., and van de Ven, J. (2010). Promises and coopera-tion: Evidence from a TV game show. Journal of Economic Behavior & Organization, 73(3):396–405.
Binmore, K. (2006). Why do people cooperate? Politics, Philosophy & Economics, 5(1):81–96.
Bochet, O., Page, T., and Putterman, L. (2006). Communication and pun-ishment in voluntary contribution experiments. Journal of Economic Be-havior & Organization, 60(1):11–26.
Carlsson, F., Kataria, M., Krupnick, A., Lampi, E., sa Lfgren, Qin, P., and Sterner, T. (2013). The truth, the whole truth, and nothing but the trutha multiple country test of an oath script. Journal of Economic Behavior & Organization, 89:105 – 121.
Charness, G. and Dufwenberg, M. (2006). Promises and partnership. Econo-metrica, 74(6):1579–1601.
Charness, G. and Dufwenberg, M. (2010). Bare promises: An experiment.
Economics Letters, 107(2):281–283.
Chaudhuri, A. (2011). Sustaining cooperation in laboratory public goods ex-periments: A selective survey of the literature. Experimental Economics, 14(1):47–83.
Croson, R. and Marks, M. (2001). The effect of recommended contributions in the voluntary provision of public goods. Economic Inquiry, 39(2):238.
Dannenberg, A. (2015). Leading by example versus leading by words in voluntary contribution experiments. Social Choice and Welfare, 44(1):71– 85.
de Bruin, B. and Dolfsma, W. (2013). Oaths and codes in economics and business - Introducing the Special Issue. Review of Social Economy, 71(2):135–139.
DeMartino, G. F. (2010). The Economist’s Oath: On the need for and content of professional economic ethics. Oxford University Press.
Ellingsen, T. and Johannesson, M. (2004). Promises, threats and fairness.
The Economic Journal, 114(495):397–420.
Erat, S. and Gneezy, U. (2012). White lies.Management Science, 58(4):723– 733.
Fanelli, D. (2009). How many scientists fabricate and falsify research? A systematic review and meta-analysis of survey data. PloS one, 4(5).
Festinger, L. (1957).A Theory of Cognitive Dissonance. Stanford University Press.
Fischbacher, U. and F¨ollmi-Heusi, F. (2013). Lies in disguisean experimen-tal study on cheating. Journal of the European Economic Association, 11(3):525–547.
Fischbacher, U., G¨achter, S., and Fehr, E. (2001). Are people condition-ally cooperative? evidence from a public goods experiment. Economics Letters, 71(3):397–404.
Fischer, D. and Fick, C. (1993). Measuring social desirability: Short forms of the Marlowe-Crowne social desirability scale. Educational and Psycho-logical Measurement, 53(2):417–424.
Frederick, S. (2005). Cognitive reflection and decision making. The Journal of Economic Perspectives, 19(4):25–42.
Gibbs, J. C., Basinger, K. S., Fuller, D., Fuller, R. L., et al. (2013). Moral maturity: Measuring the development of sociomoral reflection. Routledge.
Gneezy, U. (2005). Deception: The role of consequences. The American Economic Review, 95(1):384–394.
Hurkens, S. and Kartik, N. (2009). Would i lie to you? on social preferences and lying aversion. Experimental Economics, 12(2):180–192.
Ioannidis, J. P. (2005). Why most published research findings are false.
PLoS medicine, 2(8):e124.
Jacquemet, N., Joule, R.-V., Luchini, S., and Shogren, J. F. (2013). Pref-erence elicitation under oath. Journal of Environmental Economics and Management, 65(1):110–132.
Jacquemet, N., Luchini, S., Shogren, J. F., and Zylbersztejn, A. (2015). Coordination with communication under oath. Technical report.
Joule, R. and Beauvois, J. (1998). The free will compliance: How to get people to freely do what they have to do.
Kartik, N. (2009). Strategic communication with lying costs. The Review of Economic Studies, 76(4):1359–1395.
Kartik, N., Ottaviani, M., and Squintani, F. (2007). Credulity, lies, and costly talk. Journal of Economic Theory, 134(1):93–116.
Kiesler, C. A. (1971). The psychology of commitment: Experiments linking behavior to belief. Academic Press New York.
Koukoumelis, A., Levati, M. V., and Weisser, J. (2012). Leading by words: A voluntary contribution experiment with one-way communication. Journal of Economic Behavior & Organization, 81(2):379–390.
Ledyard, J. O. (1995). Public Goods: A Survey of Experimental Research. Princeton: Princeton University Press.
List, J. A., Bailey, C. D., Euzent, P. J., and Martin, T. L. (2001). Academic economists behaving badly? A survey on three areas of unethical behavior.
Economic Inquiry, 39(1):162–170.
L´opez-P´erez, R. and Spiegelman, E. (2013). Why do people tell the truth? experimental evidence for pure lie aversion. Experimental Economics, 16(3):233–247.
Lundquist, T., Ellingsen, T., Gribbe, E., and Johannesson, M. (2009). The aversion to lying. Journal of Economic Behavior & Organization, 70(1):81–92.
Martinson, B. C., Anderson, M. S., and De Vries, R. (2005). Scientists behaving badly. Nature, 435(7043):737–738.
Marwell, G. and Ames, R. E. (1979). Experiments on the provision of public goods. i. resources, interest, group size, and the free-rider problem.
American Journal of Sociology, pages 1335–1360.
Mazar, N., Amir, O., and Ariely, D. (2008). The dishonesty of honest people: A theory of self-concept maintenance. Journal of Marketing Research, 45(6):633–644.
Messick, D. M., Wilke, H., Brewer, M. B., Kramer, R. M., Zemke, P. E., and Lui, L. (1983). Individual adaptations and structural change as so-lutions to social dilemmas. Journal of Personality and Social Psychology, 44(2):294–309.
Necker, S. (2014). Scientific misbehavior in economics. Research Policy, 43(10):1747–1759.
Ostrom, E., Walker, J., and Gardner, R. (1992). Covenants with and without a sword: Self-governance is possible. American Political Science Review, 86(02):404–417.
S´anchez-Pag´es, S. and Vorsatz, M. (2009). Enjoy the silence: an experiment on truth-telling. Experimental Economics, 12(2):220–241.
Schlesinger, H. J. (2011). Promises, oaths, and vows: On the psychology of promising. Taylor & Francis.
Shu, L. L., Mazar, N., Gino, F., Ariely, D., and Bazerman, M. H. (2012). Signing at the beginning makes ethics salient and decreases dishonest self-reports in comparison to signing at the end. Proceedings of the National Academy of Sciences, 109(38):15197–15200.
Stevens, T., Tabatabaei, M., and Lass, D. (2013). Oaths and hypothetical bias. Journal of Environmental Management, 127:135–141.
Tavoni, A., Dannenberg, A., Kallis, G., and L¨oschel, A. (2011). Inequal-ity, communication, and the avoidance of disastrous climate change in a public goods game. Proceedings of the National Academy of Sciences, 108(29):11825–11829.
6
Appendices
6.1 Subject pool
[image:29.595.184.411.227.364.2]6.1.1 Demographics
Table 6: Summary Statistics
Variable Mean Std. Dev. Min. Max. N
Econ 0.56 0.50 0 1 192
Undergrad 0.85 0.23 0 1 192
Female 0.46 0.50 0 1 192
Age 22.60 6.35 17 63 192
Income 171.53 16.05 50 1000 144 Finsat 0.32 0.468 0 1 175 lessRelig 4.43 1.55 1 6 175
CRT 1.21 1.12 0 3 192
SRM 5.83 1.51 4 11 191
SDS 4.43 2.35 0 11 190
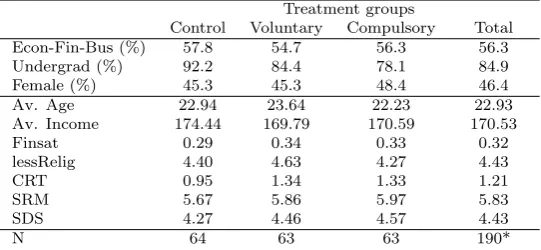
Table 7: Demographics over Treatment groups
Treatment groups
Control Voluntary Compulsory Total Econ-Fin-Bus (%) 57.8 54.7 56.3 56.3 Undergrad (%) 92.2 84.4 78.1 84.9 Female (%) 45.3 45.3 48.4 46.4 Av. Age 22.94 23.64 22.23 22.93 Av. Income 174.44 169.79 170.59 170.53
Finsat 0.29 0.34 0.33 0.32
lessRelig 4.40 4.63 4.27 4.43
CRT 0.95 1.34 1.33 1.21
SRM 5.67 5.86 5.97 5.83
SDS 4.27 4.46 4.57 4.43
N 64 63 63 190*
[image:29.595.162.433.412.537.2]Figure 4: Comparison Contributions in Stage 1 and 2, Statements
6.2 Demographic Characteristics of Statement-Makers
Post-experimental Questionnaire In the following two paragraphs, we investigate whether subjects who choose to make a statement hold specific characteristics. For this purpose we elicited demographic information and psychological measures in a post-experimental questionnaire. We asked sub-jects for their sex, age, degree, course and religiosity.16 We also asked five questions from the Socio-moral Reflection Measure Questionnaire (Basinger and Gibbs, 1987; Gibbs et al., 2013, SRM, see ), which contains items ad-dressing socio-moral values like truth telling. The questions we asked were addressing the attitude towards promises and lying.17
We also elicited a short version of the Crowne and Marlow Social De-sirability Scale (SDS). This scale is often used in Psychology and Clinical Research to measure the need for social approval.18 A person with a high SDS score is more likely to perform certain behavior with the desire to be socially accepted or approved.
Ultimately, as an estimator for strategic reasoning we integrated the cognitive reflection test (CRT) (Frederick, 2005). This test is designed to assess an individual’s ability to suppress an intuitive and spontaneous idea, which is incorrect, and engage in further reflection that leads to the correct response. Answers were incentive compatible, so that participants were paid 1 AUD for each correct answer. The CRT measure ranges from 0 to 3, indicating a person with a high CRT score is able to resist intuitively compelling responses.
In the following, we shed light on the characteristics of subjects who voluntarily made the statement in the Voluntary treatment group.
16
To have an indication how religious participants were, we asked”Apart from weddings, funerals and christenings, how often do you attend religious services these days?” The variable was coded with ”More than once a week” (1), ”Once a week” (2), ”Once a month” (3), ”Once a year” (4), ”Less often than once a year” (5), ”Never” (6).
The observed average of 4.43 suggests that participants on average went to church between once per year or less; apart from weddings, funerals and christenings.
17
We asked the following questions: 1) How important is it for people to keep promises, if they can, to friends? 2) How important is it for people to keep promises, if they can, even to someone they hardly know? 3) How important is it for parents to keep promises, if they can, to their children? 4) How important is it for people to tell the truth?
The variable is coded in reverse order: very important (1), important (2), not important (3).
Thus a high score in SRM indicates that the person stated that he/she perceives promise keeping as less important.
18
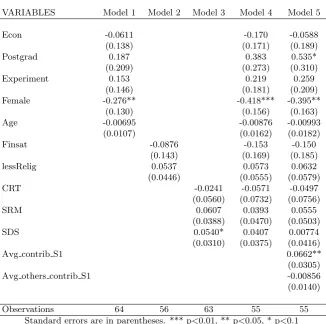
Table 8: Regression: Statement-Makers demographics
VARIABLES Model 1 Model 2 Model 3 Model 4 Model 5
Econ -0.0611 -0.170 -0.0588
(0.138) (0.171) (0.189)
Postgrad 0.187 0.383 0.535*
(0.209) (0.273) (0.310)
Experiment 0.153 0.219 0.259
(0.146) (0.181) (0.209) Female -0.276** -0.418*** -0.395**
(0.130) (0.156) (0.163)
Age -0.00695 -0.00876 -0.00993
(0.0107) (0.0162) (0.0182)
Finsat -0.0876 -0.153 -0.150
(0.143) (0.169) (0.185)
lessRelig 0.0537 0.0573 0.0632
(0.0446) (0.0555) (0.0579)
CRT -0.0241 -0.0571 -0.0497
(0.0560) (0.0732) (0.0756)
SRM 0.0607 0.0393 0.0555
(0.0388) (0.0470) (0.0503)
SDS 0.0540* 0.0407 0.00774
(0.0310) (0.0375) (0.0416)
Avg contrib S1 0.0662**
(0.0305)
Avg others contrib S1 -0.00856
(0.0140)
Observations 64 56 63 55 55
Standard errors are in parentheses. *** p<0.01, ** p<0.05, * p<0.1
Note: This table presents the marginal effects (calculated at the means of all variables) from a probit regression on the likelihood a participant takes voluntarily the statement in Stage 2, based on the demographical characteristics.
Characteristics of Voluntary Statement-Makers Table 8 shows the likelihood that a participant takes the statement voluntarily in Stage 2 based on demographic characteristics.
7
Instructions
7.1 Section 1: Baseline
You are about to participate in an economic experiment. Please read the following instructions carefully. Depending on your decisions and those made by the other participants, you can earn a substantial amount of money. It is therefore important that you take your time to understand the instructions.
Please note that all information provided during the experiment is treated confidentially. You are not allowed to communicate with the other partici-pants during the experiment. If you have any questions now or during the experiment, please indicate this by raising your hand.
Independent of your behaviour in the experiment, you receive 5 AUD for showing up.
In the experiment we use ECUs (Experimental Currency Units) as the mon-etary unit. Profits during the experiment will be converted from ECUs into Australian Dollars and added to your show up fee.
The exchange rate complies
Game Structure
The experiment is divided in three sections. Each section is seen as inde-pendent and decisions from a previous section do not affect the possibilities or payments in a latter section of the experiment. At the beginning of every section the participants will be randomly matched into groups of 4. You will be therefore in a group with 3 other participants. The groups will remain the same throughout each section of the experiment.
Each section lasts for 10 periods.
Payment
Contribution Stage
As mentioned before you will be a member of a group consisting of 4 people. At the beginning of each round each participant receives20 ECUsand has to decide what to do with them.
You have to determine how many of the 20 ECUs you want to contribute to a project and how many of them to keep for yourself. The consequences of your decision are explained in detail below.
project income= 0.4 *(sum of contributions of all 4 group members)
The income of each group member from the project is calculated in the same way. This means that each group member receives the same income from the project.
Example: Suppose the sum of the contribution of all group members is 60 ECUs, then each group member receives an income from the project of 0.4∗60 = 24 ECUs. If the sum of all contributions is 9, then every member
receives an income of 0.4∗9 = 3.6 ECUs from the project.
Once all the players have decided their contribution to the project you will be informed about the group’s total contribution and your personal total income from this round.
Total Income
Your total income consists of two parts. First the ECUs which you have kept for yourself and second the income from the project.
Your total income per round can be thus written as:
total income = (20 - your contribution to the project) + 0.4* (sum of contributions of all 4 group members)
You have always the option of keeping the ECU for yourself or contributing them to the project. Each ECU that you keep raises your total income by 1 ECU. Supposing you contributed this point to the project instead, then the total contribution to the project would rise by 1 ECU. Your income from the project would rise by 0.4∗1 = 0.4 ECU. However, the income of the
other group members would also rise by 0.4 ECU each, so that total income of the group from the project would be 1.6 points. Your contribution to the project therefore raises the income of the other group members.
On the other hand you also earn an income for each point contributed by the other members to the project. In particular, for each point contributed by any member you earn 0.4 ECU.
Practice Round for Contribution Stage
Let’s practice the Contribution Stage, where you decide how you want to allocate your endowment of 20 ECUs. Please answer therefore the following questions. They will help you to gain an understanding of the calculation of your income per round.
Remember your total income from the contribution stage is calculated as total income = 20 - your contribution to the project + 0.4 * (sum of all contributions)
1. Each group member has an endowment of 20 ECUs. Nobody (includ-ing yourself) contributes any point to the project.
• How high is your total income ?
• What is the income of each other group members ?
2. Each group member has an endowment of 20 ECUs. You contribute 20 points to the project at the first stage. All other group members contribute 20 ECUs each to the project.
• What is your total income ?
• How high is the income of each other group members ?
3. Each group member has an endowment of 20 ECUs. The other three group members contribute together a total of 30 ECUs to the project.
• What is your total income if you contribute 0 ECUs
to the project ?
• What is your total income if you contribute 15 ECUs
to the project ?
4. Each group member has an endowment of 20 ECUs. You contribute 8 ECUs to the project.
• What is your total income if the other group members together
contribute 3, 0 and 4 ECUs to the project ?
• What is your total income if the other group members together
Belief Stage
After you made your own contribution, we ask you to guess what the con-tribution of the other group members is. Please enter what you think the contribution of each single group member will be.
Next we ask you what you think what the other players’ best guess about your contribution is. For both guesses you can also earn money. Your payoff depends on the distance between your best guess and the actual contribution of the player/ the player’s guess about your contribution. The following payment rule is applied:
Your best guess is
• exactly right you receive 10 ECUS • deviates by 1 point you receive 9 ECUS • deviates by 2 points you receive 6 ECUS • deviates by 3 points you receive 1 ECUs
At the end of the section one round will be randomly chosen for which you get paid for the accuracy of your guesses.
Practice Round for Belief Stage
Let’s practice now the belief stage, where you have to guess what the other player did. Please answer the following questions. Remember:
If your guess is exactly right, you receive 10 ECUs from this stage. If your guess deviates by 1 point, you receive 9 ECUs.
If your guess deviates by 2 point, you receive 6 ECUs. If your guess deviates by 3 point, you receive 1 ECUs.
If your guess deviates by more than 3 points, you receive 0 ECUs.
Your best guess about the other players’ contributions:
Assume Player 2’s contribution has been selected as the payoff determining entry. Following the payoff rule for the belief stage (see above), you have to compare his actual contribution with your guess about his contribution.
1. Your best guess about his contribution was 12, Player 2’s actual con-tribution was 12.
How many ECUs will you receive?
2. Your best guess about his contribution was 2, but Player 2’s actual contribution was 18.
How many ECUs will you receive?
3. Your best guess about his contribution was 8, but Player 2’s actual contribution was 10.
How many ECUs will you receive?
Your belief about the others’ best guess about your contribu-tion: Here we ask you to state what you believe about what the other players’ best guess about your contribution will be. Following the payoff rule for the belief stage, you have to compare his actual guess about your contribution with your belief about his best guess.
1. Player 3’s best guess about your contribution was 8, but you stated he will guess 16.
How much ECUs do you receive from the second belief stage?
2. Player 3’s best guess about your contribution was 8, but you stated he will guess 7.
How much ECUs do you receive from the second belief stage?
3. Player 3’s best guess about your contribution was 8, but you stated he will guess 11.
Figure 5: Screenshot Enter Contribution
7.2 Section 2 : Voluntary Statement
In the second section you need to make the same decisions as in the first section. Again you have to decide how much you want to contribute from your endowment of 20 ECUs to a project and how much you want to keep for yourself.
You are matched with a different group of 3 people than in the previous section. You will remain in this group for all rounds of Section 2.
Section 2 has 10 rounds.
This section differs slightly from what you have done so far. You now have the possibility to make a statement about your intended behaviour in Sec-tion 2. The statement outlines social behaviour in the given context and is non-binding.
If you want to make the statement, you click Yes and you confirm your intention by writing down the statement in the designated box on the fol-lowing page. If you do not want to make the statement you click on No. Your decision on the statement, does not restrict your range of choices later on.
Once all the players have decided if they want to make the statement or not, you will learn who made the statement in your group.
The following statement is offered to describe your intended behaviour for the entire Second Section.
I promise to contribute each round at least 15 ECUs to the project.
Do you want to make this statement? [Yes, No]
Please be aware that everyone has to enter a text in the next stage, regardless if he/she made the statement or not.
You have decided that you want to make the statement. Therefore please type the statement in the designated box.
7.2.1 Compulsory Statement
In the second section you need to make the same decisions as in the first section. Again you have to decide how much you want to contribute from your endowment of 20 ECUs to a project and how much you want to keep for yourself.
You are matched with a different group of 3 people than in the previous section. You will remain in this group for all rounds of Section 2.
Section 2 has 10 rounds.
This section of the experiment differs slightly from what you have done so far. You now have to make a statement about your intended behaviour in Section 2 before you can enter the section . The statement outlines social behaviour in the given context and is non-binding.
You confirm your intention by writing down the statement in the designated box on the following page. The statement does not restrict your range of choices later on.
Once all the players have written down the statement the game continues.
The following statement shall describe your intended behaviour for the entire Second Section.
I promise to contribute each round at least 15 ECUs to the project.