Solid Solutions with bcc, hcp, and fcc Structures Formed in a Composition Line in
Multicomponent Ir
Rh
Ru
W
Mo System
Akira Takeuchi
1,+, Takeshi Wada
2and Hidemi Kato
21Graduate School of Engineering, Tohoku University, Sendai 980-8579, Japan 2Institute for Materials Research, Tohoku University, Sendai 980-8577, Japan
Five IrRhRuWMo alloys selected based on alloy design with valence electron concentration (VEC) were examined for their formation of single, dual, and triple phases of bcc, fcc, and hcp structures. These structures were predicted with Thermo-Calc 2019a and the TCHEA3 database on a cross-sectional phase diagram along a composition line: Ir0.415254(100¹2x)Rh0.415254(100¹2x)Ru0.169492(100¹2x)WxMox(x: 050 at%). At
T=2100 K, four types of phases were predicted: (1) a single bcc, fcc, and hcp phase, respectively, at x=35 (Alloy A, VEC=6.849), 15 (Alloy C, VEC=7.981), and 5 (Alloy E, VEC=8.574); (2) a mixture of bcc+hcp and hcp+fcc at x=24 (Alloy B, VEC=7.472) and 8 (Alloy D, VEC=8.378), respectively; (3) a triple mixture of bcc+hcp+fcc; and (4) a mixture of bcc+fcc in Alloys AE at low temperature. Experiments at 2100 K revealed that Alloys CE tended to exhibit better reproducibility and that Alloy E can be regarded as a new refractory high-entropy alloy (HEA) with fcc structure. Alloy C annealed atT=1273 K for 200 h maintained a single-hcp structure. The non-appearance of thermodynamically stable phases at low temperature in the IrRhRuWMo system was analogically explained as slow diffusion. The VEC analysis for HEAs with hcp structures was extended by including the range of 7.5¯VEC¯8.4 for alloys consisting of 4d and 5d transition metals annealed near their solidus temperature. The IrRhRuWMo system was significant in providing all possible simple solid solutions of bcc, hcp, and fcc phases. [doi:10.2320/matertrans.MT-M2019212]
(Received August 1, 2019; Accepted August 27, 2019; Published October 4, 2019)
Keywords: high-entropy alloys, solid solutions, transition metals, valence electron concentration
1. Introduction
It goes without saying that high-entropy alloys (HEAs) have developed into the most attractive metallic materials
since their first reports in 2004.1,2) The developmental
progress of HEAs has been accompanied by the expansion
of their definitions in terms of alloy composition and relevant
quantities. Initially, HEAs were defined1)as alloys with exact
equiatomicity and with five or more constituent elements,
which corresponds to the description with the configuration
entropy normalized by the gas constant (Sconfig/R) satisfying
Sconfig/R²1.61.3) Here, Sconfig is given by eq. (1) with a
fraction of thei-th elements (pi) in the alloy withNelements
and is simply expressed as Sconfig=lnN in case of exact
equiatomic alloy.
Sconfig=R¼ XN
i¼1
pilnpi ð1Þ
Subsequently, the criteria for HEAs have been further extended with the recent progress in HEAs. For instance,
HEAs in a narrow sense4,5) are alternatively defined by
Sconfig/R²1.5 and by the constituent element content in
atomic percent (ci) in the range of 5¯ci/at%¯35.
Furthermore, a recent definition for HEAs includes alloys
with Sconfig/R³1.01.5 as medium-entropy alloys (MEAs)
in a class of HEAs within their wide definition. Thus, HEAs
have been loosely defined in a wide sense in multicomponent
alloy systems.
As well as changes of the definition of HEAs in terms of
compositions, the structural types of HEAs have also been
changed gradually. Specifically, the definition had long been
limited to simple crystallographic structures, in particular,
solid solutions of bcc, fcc, and their mixtures.1)Subsequently,
HEAs with hcp structures have been found in the past
several years. For instance, the constituent elements and/or
production methods of HEAs with hcp structure reported
to date consist of heavy lanthanide elements with6) and
without6,7) Y, light-weight elements by mechanical alloying
and subsequent transformation,8) 3d transition metals by
applying high pressure,9)and 4d and 5d transition metals by
chemical reaction.10) Following these reports, the authors
have recently succeeded in fabricating HEAs with hcp
structure for alloys from 4d and 5d elements in
Ir26Mo20Rh22.5Ru20W11.5 and Ir25.5Mo20Rh20Ru25W9.5
al-loys11) by conventional arc melting and subsequent
annealing. A unique feature of these IrMoRhRuW
HEAs11) is that the hcp structure of the alloys is controlled
by valence electron concentration (VEC)12) ³7.8. Specifi
-cally, the alloy design is supported by a concept of structural
stability evaluated according to the enthalpy by Miedema’s
model13,14) as a function of VEC. Furthermore, the IrMo
RhRuW HEAs with hcp structure11)are also unique in that
the alloy compositions are optimized by thermodynamic
predictions11)using Thermo-Calc with the TCHEA3 database
for HEAs. This implies that one can fabricate IrMoRh
RuW HEAs with bcc or fcc structure by paying attention
to the appropriate VEC values for their structures and composition optimization. In other words, the authors came
to believe that the IrMoRhRuW system has the ability
to provide HEAs with bcc and fcc structures as well as
unprecedented bcc+hcp and hcp+fcc structures as stabilized
phases when the VEC values and compositions are optimized.
The purpose of this study was to examine the presence of single bcc, fcc, and hcp structures and plural phases in the
IrMoRhRuW alloy system in accordance of an alloy
design based on VEC analysis and thermodynamic calcu-lations and optimizations.
+Corresponding author, E-mail: akira.takeuchi.a8@tohoku.ac.jp
2. Methods
In the present study, the capital and lower-case letters were intentionally distinguished for denoting the structures clearly between the predictions and experiments including
conven-tional descriptions, respectively. For instance, “BCC_A2,”
“FCC_A1,” and “HCP_A3” were used for the predictions
with Thermo-Calc, whereas lower-case letters,“bcc,” “fcc,”
and “hcp”were given for the experiments and conventional descriptions.
2.1 Alloy design
An IrRhRuWMo alloy system was investigated
experimentally as well as computationally in accordance
with an alloy design. The significant point of the present
alloy design, from a computational aspect, was to try to identify a compositional line on which all the possible three structures of bcc, hcp, and fcc appear at a given temperature. In determining the composition line, the authors referred to
a relationship between the VEC value of the structure12,14)
and computational calculations of the cross-sectional phase diagram by the CALPHAD scheme before starting the experiments. An underlying concept of the sandwich
strategy11)for the IrMoRhRuW system was adopted in
selecting the IrRhRuWMo system. That is, Ru with a
VEC of 8 is put in Mo and W with VEC=6 and Rh and
Ir with VEC=9 in the periodic table. As a result of trial
and error, as described in the Appendix, the alloy design
eventually led to selecting Ir0.415254(100¹2x)Rh0.415254(100¹2x)
-Ru0.169492(100¹2x)WxMox alloys, which involved five
repre-sentative alloys (Alloys AE). Specifically, the alloy
compositions were determined by trial and error to meet the requirement that the VEC values of the alloys vary
approximately in the range of 6.88.5 by referring to
empirically and statistically obtained data12) relating the
VEC and types of structures: VEC<6.87 (bcc), 6.87¯
VEC<8.0 (bcc+fcc), and VEC²8 (fcc). Table 1
summa-rizes the compositions of Alloys AE, their VEC values, and
their configuration entropies normalized by the gas constant
(Sconfig/R). The values ofSconfig/Rof Alloys A, D, and E are
slightly smaller than 1.5, such that these three alloys cannot
be HEAs by the strict definition. Furthermore, the contents of
Ir and Rh in Alloy E are not in the range of 5¯ci/at%¯35,
and thus, this alloy cannot be a HEA according to the strict
definition. However, the present study regards Alloys AE as
HEAs based on the definition of HEAs in a wide sense.
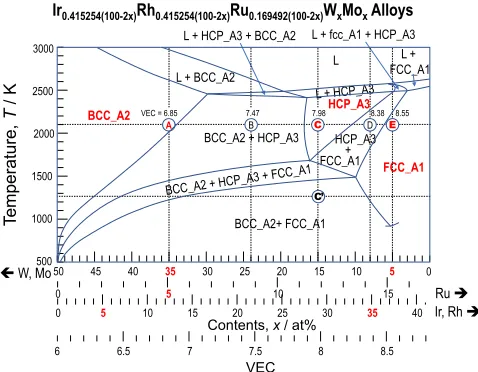
The cross-sectional phase diagram calculated with
Thermo-Calc 2019a with the TCHEA3 database is shown
in Fig. 1, which includes Alloys AE on a composition
line. In the computations, only the following phases from
solutions (LIQUID, FCC_A1, BCC_A2, BCC_B2, and
HCP_A3) and chemically ordered fcc- and bcc-family solid
solutions (FCC_L12 and BCC_B2) were considered in the
calculations because of the restriction on the number of phases in the computations. Here, preliminary investigation
revealed that both FCC_L12 and BCC_B2 phases were
calculated in disordered states, and thus, they exactly
corresponded to FCC_A1 and BCC_A2, respectively.
However, the absence of the other conventional intermediate or intermetallic compounds in the calculation results was
[image:2.595.98.501.98.249.2]confirmed separately for Alloys AE over the temperature
Table 1 Fractions of components in Alloys AE, their values of VEC, and configuration entropy normalized by gas constant (Sconfig/R), where Alloys AE are on the composition line of Ir0.415254(100¹2x)Rh0.415254(100¹2x)Ru0.169492(100¹2x)WxMox.
Contents, x/ at%
50 45 40 35 30 25 20 15 10 5 0
L
FCC_A1 HCP_A3 BCC_A2
HCP_A3 + FCC_A1 BCC_A2 + HCP_A3
L + BCC_A2
L + FCC_A1
Ir0.415254(100-2x)Rh0.415254(100-2x)Ru0.169492(100-2x)WxMoxAlloys
L + fcc_A1 + HCP_A3 L + HCP_A3 + BCC_A2
E C
A B D
BCC_A2+ FCC_A1
8.55 8.38 7.98 7.47 VEC = 6.85
C’
Te
mperature,
T
/ K
3000
2500
2000
1500
1000
500
Ir, Rh 0 5 10 15 20 25 30 35 40
0 5 10 15 Ru
6 6.5 7 7.5 8 8.5
VEC
W, Mo
[image:2.595.307.546.277.463.2]range shown in Fig. 1. The non-appearance of compounds is
a nature of the IrRhRuWMo alloy system, as presented
in a previous report.11) Figure 1 predicts that Alloys A, C,
and E, respectively, will form a single bcc, hcp, and fcc phase
at high temperatures, such asT=2100 K, whereas Alloys B
and D will be obtained as dual phases of bcc+hcp and
hcp+fcc, respectively. Furthermore, Alloys AE have the
ability to be formed into triple phases of bcc+hcp+fcc and
bcc+fcc phases with decreasing annealing at low
temper-atures. This variety of phases that may appear on a
cross-sectional phase diagram is a significant feature of the IrRh
RuWMo System. These computationally predicted phases
were examined experimentally.
Additionally, a property diagram that displays the amounts of all phases as a function of temperature was computed for
Alloys AE to compensate for the sparsity of Fig. 1 in terms
of the phases considered under the restriction. In calculating the property diagrams, all the possible phases, including
intermetallic/intermediate compounds, were considered
where these phases were derived from a default condition after selecting the constituent elements of Ir, Rh, Ru, Mo and W. The property diagrams shown in Fig. 2 indicate the non-appearance of other phases, except for bcc, fcc, hcp, and liquid over a wide temperature range from 500 to 2500 K
in Alloys AE, supporting results in Fig. 1 calculated under
limited conditions by considering LIQUID FCC_A1,
FCC_L12, BCC_A2, BCC_B2, and HCP_A3 only.
2.2 Experiments
Alloy ingots of ³5 g with nominal compositions of
the Ir0.415254(100¹2x)Rh0.415254(100¹2x)Ru0.169492(100¹2x)WxMox
alloys (Alloys AE: x=35, 24, 15, 8, 5) were prepared by
arc melting from raw metals with industrial purity. The alloy compositions are summarized in Table 1. The raw metals
were commercially obtained and had a purity of 99.9 mass%.
The Ir, Rh, and Ru elements, which had an initial form of powders, were separately consolidated in a bulk form prior to
alloying. The 5-g samples were formed into button-shaped
ingots of³10 mm diameter and³5 mm height. The samples
were annealed at a high temperature to confirm the
equilibrium phases. The as-prepared ingots were annealed with a magnesium oxide crucible as a contacting material in a high-temperature furnace with a graphite heater. The chamber
of the furnace was vacuumed (³10¹2Pa) in advance and
thenfilled with high-purity Ar gas of ambient pressure. The
samples were homogenized by annealing, followed by cooling in the furnace. The cross-sections of these alloys, which were cut into two pieces perpendicular to the base,
were examined for their structure by X-ray diffraction
(XRD). In addition, the samples were observed for their morphology by scanning electron microscopy (SEM), and the chemical composition was analyzed by energy-dispersive X-ray spectroscopy (EDX) equipped on the SEM.
3. Results
Alloys AE annealed at 2100 K for 2 h and Alloy C
annealed at 1273 K for 200 h were analyzed with XRD for
their crystallographic structures. The XRD profiles shown in
Figs. 3(c), (e) indicate that Alloys C and E annealed at
2100 K exhibit reflections consistent with a single hcp phase
and a single fcc phase, respectively. These identified phases
are denoted with Miller indices. Figures 3(c), (e) for Alloys C and E indicate the reproducibility of the predictions shown in Fig. 1. However, Alloy D does not provide the mixture of
hcp+fcc structures, but forms into a single hcp phase as
shown in Fig. 3(d). This disagreement between the prediction and experiment for Alloy D was presumably due to a
narrower composition region of hcp+fcc predicted in Fig. 1.
Fig. 2 Property diagrams calculated with Thermo-Calc 2019a and the TCHEA3 database for Alloys AE by considering all the possible phases, including the intermetallic/intermediate compounds from a default condition, which were determined by selecting the constituent elements of Ir, Rh, Ru, Mo, and W. The vertical broken lines correspond to the annealing temperatures for comparison.
[image:3.595.48.287.68.252.2] [image:3.595.310.543.468.750.2]The authors did not investigate further to identify the intermediate alloy composition between Alloys D and E that
exhibits hcp+fcc at 2100 K. This is because the accurate
assessment of the cross-sectional phase diagram is not the purpose of the present study. On the contrary, the authors strongly believe that Alloy D with the hcp structure and Alloy E with the fcc structure indirectly prove the presence
of a composition region of hcp+fcc between the
composi-tions of Alloys D and E. Thus, it appears that the experiments tended to reproduce the predictions shown in Fig. 1 for
Alloys CE.
In strong contrast, experiments for Alloys A and B
exhibited considerably different results compared with the
predictions. Specifically, the XRD profiles of Alloys A and
B annealed at 2100 K indicated, as shown in Figs. 3(a), (b),
a mixture of bcc+hcp phase and a single hcp phase,
respectively. These results suggest that the composition
region of bcc+hcp and bcc predicted in Fig. 1 should
considerably shift to the left, corresponding to the high-fraction direction of the bcc-forming elements of W and Mo. Again, the authors did not perform further experiments to determine the exact alloy compositions that exhibit a single-bcc structure. This is because the present study was performed in a framework of HEAs with the approximate
composition of 5¯ci/at%¯35. The above experimental
results shown in Fig. 3(a)(e) reveal that the CALPHAD
predictions at 2100 K gave better agreement with
experi-ments for Alloys CE with greater VEC than ³8 than for
Alloys A and B. Moreover, Alloy C annealed atT=1273 K
for 200 h, as shown in Fig. 3(cA), was not formed into a
mixture of structure bcc+fcc as predicted computationally
in Fig. 1, but into a single hcp structure. The reason for the
non-appearance of the thermodynamically stable bcc+fcc
structure in Alloy C annealed at 1273 K will be discussed in
the next section. Additionally, Alloys BD in the as-prepared
states were identified as having an hcp structure; their results
are not shown in Fig. 3.
An analysis to determine the lattice constants of the bcc
and fcc phase (a) and the hcp phase (a,c), as well as their
ratio (c/a) was performed for Alloys AE annealed at 2100 K
for 2 h and Alloy C annealed at 1273 K for 200 h (Alloy CA).
The results summarized in Table 2 indicate that Alloy A
with a partial hcp structure and Alloys BD with an hcp
structure exhibitc/aranging 1.6111.593. The values ofc,a,
and c/ain Alloy C with VEC=7.981 are almost the same
as those of the previous data:11) Ir26Mo20Rh22.5Ru20W11.5
and Ir25.5Mo20Rh20Ru25W9.5 HEAs with hcp structure with
VEC³7.86, and those of pure Ru.15)Moreover, no apparent
differences ina,c, andc/aare seen between Alloys C and CA.
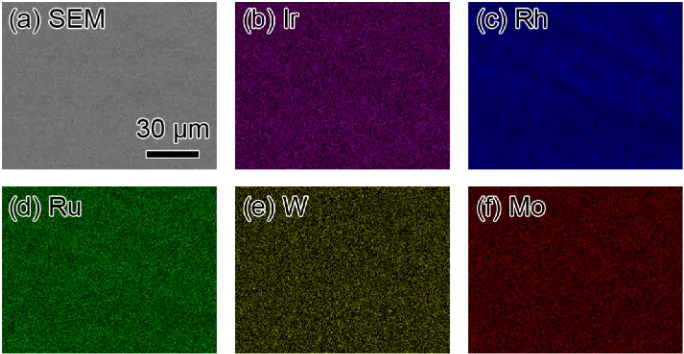
The results of further examinations of Alloys C and E annealed at 2100 K, performed by observing their morphol-ogy with SEM and by analyzing chemical compositions with EDX, are shown below. Figure 4 presents SEM and EDX images of Alloy C annealed at 2100 K for 2 h, whereas Fig. 5 depicts those of Alloy E. The SEM image in Fig. 4(a) demonstrates that Alloy C appears to be almost homoge-neous at a submillimeter scale, except for the presence of grain boundaries indicated by areas with slightly dark contrast. The EDX analysis revealed that these grain boundaries were slightly poor in Ir in Fig. 4(b) and rich in Rh in Fig. 4(c). However, Ru, W, and Mo are homoge-neously distributed over the grain boundaries, as shown in
Fig. 4(d)(f ). Thus, Figs. 3 and 4 revealed that Alloy C
annealed at 2100 K for 2 h were formed into a single hcp structure. Moreover, an analysis of the SEM image and element-mapping images of Alloy E annealed at 2100 K for
2 h, shown in Figs. 5(a) and 5(b)(f ), respectively,
[image:4.595.113.483.119.350.2]demon-strates the formation of a single fcc phase.
The possible reasons for the formation of single solid
solutions in Alloys BE, as experimentally observed in the
IrRhRuWMo system, are rationalized in terms of the
geometrical features of the liquidus and solidus lines/
temperatures in the cross-sectional phase diagram shown in Fig. 1. Furthermore, a feature of Alloy E as a HEA with hcp structure was highlighted by the analysis of the Gibbs free
energy (G).
The present results are significant from a viewpoint of the
geometrical features of liquidus and solidus lines, in that Alloy E is a new class of refractory HEA with fcc structure. In particular, it is worth emphasizing that the liquidus
temperature (Tl) of Alloy E reaches ³2600 K, which is
approximately 1000 K higher than that of the CrMnFeCoNi
HEA.16) According to Fig. 1, the composition of Alloy E
shows a narrow range of the L+hcp_A3 region, nearly as
narrow 100 K, followed by a relatively small temperature
range of the hcp_A3+fcc_L12 phase region above 2200 K.
These narrow composition regions made it possible to form
a single fcc structure during its solidification from a melt. A
similar situation could be observed in Alloys C and D when
they solidified from their melts. The narrow temperature
range between Tl and Ts (¦Tl¹s) over the compositions of
Alloys CE is considerably important to obtain a single solid
solution. This importance was pointed out in the authors’
previous work.6)This alternatively supports the disagreement
of Alloys A and B with relatively wide ¦Tl¹s of 200 K
or more. The large ¦Tl¹s of Alloys A and B led to them
forming other phases in the experiments with respect to the predictions.
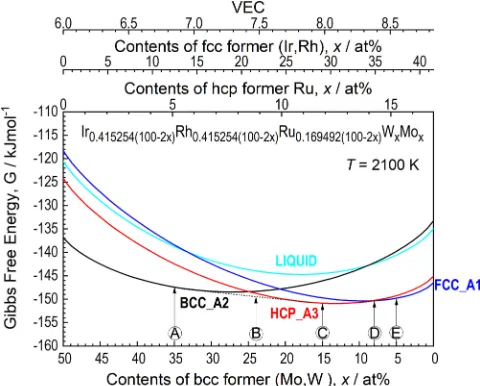
The formation of a HEA with fcc structure in Alloy E in
the IrRhRuWMo system was analyzed in detail with a
G-composition diagram, as shown in Fig. 6. Alloy E is
unique as a HEA with fcc structure, in that the difference inG
between the FCC_A1 and HCP_A3 phase (¦GHCP_A3FCC_A1)
is smaller than 1 kJ/mol, as depicted in Fig. 6. Further
calculations were performed to examine the temperature
dependence of G of LIQUID, BCC_A2, FCC_A1, and
HCP_A3 structures for Alloy E. Figure 7(a) exhibits the
conventional tendency that G increases with decreasing T.
Also, Fig. 7(b) indicates that¦GHCP_A3FCC_A1increases with
decreasingT. The extrapolated value of¦GHCP_A3FCC_A1was
evaluated to be 4.5 kJ/mol, which roughly corresponds to
¦Ghcpfccvalues of SGTE of pure elements of fcc formers:17)
3.00 kJ/mol (Rh) and 4.00 kJ/mol (Ir). Alloy E exhibited
somewhat high value of¦GHCP_A3FCC_A1at low temperature,
such as ¦GHCP_A3FCC_A1=3.9 kJ/mol atT=300 K. Thus,
it was found that Alloy E exhibits small value of Fig. 4 (a) SEM image and (b)(f ) element-mapping images of Alloy C annealed at 2100 K for 2 h.
[image:5.595.130.469.70.250.2] [image:5.595.127.469.285.462.2]¦GHCP_A3FCC_A1<1 kJ/mol at high temperature range
around 2000 K. This small value of¦GHCP_A3FCC_A1at high
temperature range suggests that Alloy E would possess an extremely low stacking fault energy and that it would tend
to exhibit a mixed structure of hcp+fcc when it was
mechanically tested at elevated temperatures. In other
words, such a small difference in ¦GHCP_A3FCC_A1 of
Alloy E will lead to transformation-induced plasticity
(TRIP),18) which includes a lamellar hcp phase in the fcc
matrix containing high-density stacking faults. Similarly, Alloy E will contain twins introduced during deformation and will possess low stacking fault energy (SFE). Thus, the Ir0.415254(100¹2x)Rh0.415254(100¹2x)Ru0.169492(100¹2x)WxMox
sys-tem has great advantage over the CrMnFeCoNi HEA, in that the hcp phase is in a thermodynamically stable state
without compulsory loading of high pressure, and that ¦G
between the hcp and fcc structures can simply be analyzed with the CALPHAD scheme.
4. Discussion
First, the agreement and disagreement between the experimental and computational data on the structure of
Alloys BD are discussed by focusing on the formation of
HEAs from thermodynamic viewpoints and the applicability
of TCHEA3 database. Then, the effect of the VEC on the
formation of HEAs without and with hcp structure is discussed with respect to conventional HEAs comprising
3d transition metals and the present alloys in the IrRh
RuWMo system.
4.1 Thermodynamic viewpoints and applicability of
TCHEA3 database
The present experiments revealed that HEAs with a single
hcp structure were formed in Alloys BD annealed at 2100 K
for 2 h and Alloy C annealed at 1273 K for 200 h. These
results indicate that the hcp structure in the IrRhRuWMo
system might exist more widely than thermodynamically expected. Such disagreements between the experimental and computational results at low temperature range are also
reported in the Ir26Mo20Rh22.5Ru20W11.5and Ir25.5Mo20Rh20
-Ru25W9.5alloys11)in the authors’previous study. Specifically,
these two alloys,11)both annealed at 2373 K and as-prepared
by arc-melting, formed into a single hcp structure, although the calculations with Thermo-Calc suggested the co-existence of bcc and fcc with hcp structures at temperatures lower than 1300 K. The presence of the stable phase in the high temperature range is rational in HEAs, because of the
high-entropy effect. That is, the high entropy (S) term due to
high-entropy effect accompanied by a high absolute temperature
(T) environment overcomes the enthalpy term (H) in the
Gibbs free energy, as expressed byG=H¹TS, leading to a
reduction in Gand stabilized solid solutions.
However, the experimental data of Alloys BD as well, as
the previously reported IrRhRuWMo HEAs, with hcp
structure11) in the low temperature range, present an ironic
problem. That is, the strong tendency to form an hcp structure might not be controlled intentionally to produce bcc and fcc structures, although they were predicted in the thermody-namic calculations. From thermodythermody-namic viewpoints, it
appears that the formation of the structure of Alloys BD
may be affected by imperfections of TCHEA3 database19)
when applying it to the multicomponent IrRhRuWMo
system for the following sub-ternary and sub-binary systems.
Specifically, only the MoRuW ternary system is tentatively
assessed19) among sub-ternary systems and MoIr, WIr,
MoRh, and WRh binary systems are not19)assessed in the
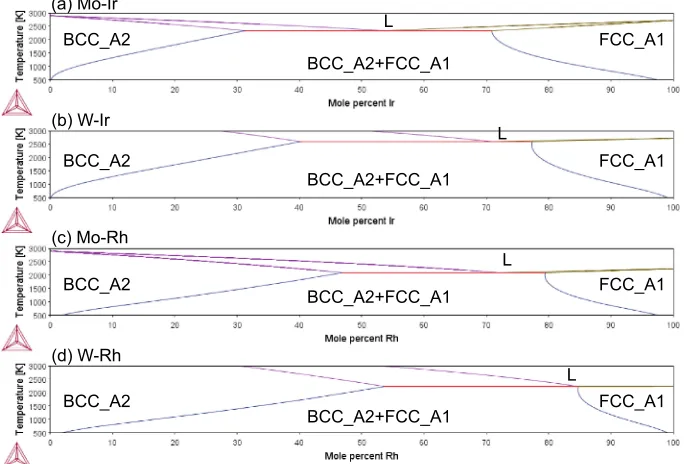
full range of composition and temperature. Thus, these binary systems were computed with a template of Property Diagram by selecting Phase Diagram in Calculation Type as shown in
Fig. 8. Features of Fig. 8 showed the absence of the HCP_A3
phase and the overestimation of maximum solid solubility
(maximum amount of primary solid solubility). Specifically,
Fig. 8 indicates that the calculated binary phase diagrams
did not contain HCP_A3, but just contained BCC_A2 and
FCC_A1 and their mixture. However, the maximum solid
solubilities shown in Fig. 8 were overestimated, particularly
in the BCC_A2 sides. In details, the maximum solid
solubility of the BCC_A2 structure was calculated to be as
Fig. 6 Gibbs free energy (G) calculated with Thermo-Calc 2019a and the TCHEA3 database atT=2100 K along the cross-sectional composition line of Ir0.415254(100¹2x)Rh0.415254(100¹2x)Ru0.169492(100¹2x)WxMox, which includes Alloys AE.
Fig. 7 (a) Temperature dependence of Gibbs free energy (G) of LIQUID, BCC_A2, FCC_A1, and HCP_A3 structures calculated for Alloy E with Thermo-Calc 2019a and the TCHEA3 database and (b) difference inG
[image:6.595.49.289.71.264.2] [image:6.595.49.288.329.500.2]large as approximately 30 at% of solute or more. The
maximum solid solubility of the FCC_A1 structure was
also large, and in the range of approximately 1530 at% of
solute. According to phase diagrams,20) the maximum solid
solubility of the IrMo, IrW, MoRh, and RhW binary
systems should be approximately 520 at%and 1522 at%of
solute for bcc_A2 and fcc_A1, respectively.
As described above, absence of the hcp structure and
overestimation of solid solubility® in particular, at bcc
former side®should affect the assessment of the IrRhRu
WMo system. The former directly affected the smaller area
of HCP_A3 in Fig. 1 than that in the experiments. However,
the latter also affected the shift in the area of BCC_A2 in
Fig. 1. In reality, the latter showed that the prediction of
Alloy A at 2100 K as BCC_A2 instead of bcc_A2+hcp_A3
was experimentally denied and that better reproducibility of
experiments at 2100 K was observed for Alloys CE than
for Alloys A and B. Furthermore, the former and latter
affected the disagreement between the prediction and
experiments for Alloy CA at low temperature. Specifically,
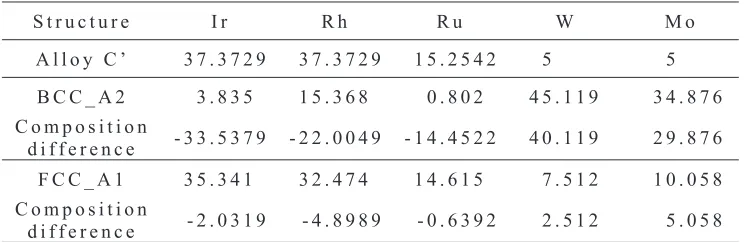
the prediction shown in Figs. 1 and 2 revealed that Alloy CA (Ir29.0678Rh29.0678Ru11.8644W15Mo15) decomposed into
BCC_A2 (Ir3.835Rh15.368Ru0.802W45.119Mo34.876) and FCC_A1
(Ir35.341Rh32.474Ru14.615W7.512Mo10.058) as summarized in
Table 3. The tie line at its equilibrium is not present on the composition line of the cross-sectional phase diagram shown
in Fig. 1 because of the nature of Alloy CA from the
multicomponent system. The compositions of the
equili-brated phases of Alloy CA at 1273 K shown in Table 3
indicate that the BCC_A2 was poor in Ir and Ru and rich in
W and Mo by composition differences of 14 at% or more.
However, the FCC_A1 was slightly poor in W and Mo and
rich in Ir and Mo but the differences were nearly 5 at% or
smaller. Consequently, it was considered that the larger
difference in compositions between the BCC_A2 and
Alloy CAmade it difficult to equilibrate, because of the large
composition modulation. Hence, it is tentatively concluded that the disagreements between the experiments and
calculations in Fig. 1 are principally affected by the
shortcomings of the TCHEA3 database. A supplementary,
slow diffusion effect in the IrRhRuWMo system at a
lower temperature range would affect the disagreement of
Alloy CA, which required large composition modulation to
achieve equilibrium (BCC_A2+FCC_A1).
4.2 The effect of the VEC
The conventional VEC analysis reported by Guo et al.12)
indicates that bcc, bcc+fcc, and fcc are stable in HEAs
when VEC<6.87 (bcc), 6.87¯VEC<8.0 (bcc+fcc), and
VEC²8 (fcc). This analysis reported in 2011 does not
contain the hcp structure, as the first HEAs with the hcp
structure6) were presented in 2014. It has recently been
reported that the hcp structure is stable at VEC=36) for
lanthanide alloys, VEC=2.821) for light-weight elements,8)
and VEC³7.86 for Ir26Mo20Rh22.5Ru20W11.5 and
Ir25.5Mo20Rh20Ru25W9.5 alloys;11) moreover, VEC=7.472
8.378 for Alloys BD in the present study. These VEC values
of HEAs with hcp structure of³3 and³78 act as a guiding
principle derived by Miedema’s model13,14) for structural
stability and the Friedel model for the number of d-electrons (nd)22)in the ranges 2.6<nd<3.5 and 6.5<nd<7.4. Here,
it should be noted that these models are valid for the paramagnetic elements. Accordingly, the VEC analysis based on these models provides rational results for refractory HEAs
with bcc structure23,24) with VEC³5. In general, the VEC
analysis given by Guo et al. is correct, as a result of the
statistical analysis that combined the structures of HEAs with the VEC values. However, the VEC analysis given by Guo
et al. for the Cantor alloy,2,25)as a HEA with fcc structure,
should be treated with care because of the inclusion of the
BCC_A2 FCC_A1
BCC_A2 FCC_A1
BCC_A2 FCC_A1
BCC_A2 FCC_A1
BCC_A2+FCC_A1
BCC_A2+FCC_A1
BCC_A2+FCC_A1
BCC_A2+FCC_A1 (a) Mo-Ir
(b) W-Ir
(c) Mo-Rh
(d) W-Rh
L
L
L
L
[image:7.595.128.470.74.306.2]ferromagnetic constituents of Fe, Ni, and Co. For instance, if
Fe with VEC=8 were a paramagnetic element such as Ru
and Os with VEC=8, the VEC analysis given by Guoet al.
would provide slightly different threshold values of VEC for
the boundary between bcc+fcc and fcc structures.
Con-sequently, the VEC analysis given by Guo et al.should be
modified by including the experimentally confirmed VEC
ranges for HEAs with hcp structure under special supple-mentary conditions. The present results showed that the supplemental conditions are that HEAs with hcp structure are composed of 4d and 5d transition metals and these alloys are subjected to high-temperature annealing near the solidus
temperature or solidified from a melt. Thus, the supplemental
VEC analysis should include 7.5¯VEC¯8.4 as well as
VEC³3 for HEAs with hcp structure. In particular, the
former supplemental VEC analysis, 7.5¯VEC (hcp)¯8.4,
does not contradict the VEC analysis given by Guo et al.
as VEC<6.87 (bcc), 6.87¯VEC<8.0 (bcc+fcc), and
VEC²8 (fcc). This is because Alloy C annealed at 1273 K
for an extremely long time leaves scope for the formation of
the bcc+fcc structure, as shown in Fig. 2, when the slow
diffusion is overcome to yield a thermodynamic equilibrium
state.
5. Conclusions
Five multicomponent alloys (Alloys AE) on a
composi-tion line, Ir0.415254(100¹2x)Rh0.415254(100¹2x)Ru0.169492(100¹2x)
-WxMox (x=35, 24, 15, 8, and 5 at%) were investigated
experimentally for their phase stability according to computa-tional predictions with Thermo-Calc and the TCHEA3 database. The experiments revealed that the samples annealed
at 2100 K for 2 h had a mixed dual-phase bcc+hcp structure
in Alloy A, single hcp structure in Alloys BD, and single
fcc structure in Alloy E. CALPHAD predictions gave better
agreement with the experiments for Alloys CE, with greater
VECs of³8, than for Alloys A and B. A refractory HEA with
fcc structure was newly found in Alloy E. Alloy C annealed
atT=1273 K for 200 h retained its hcp structure instead of
the predicted bcc+fcc phases. The formation of an hcp
structure in the IrRhRuWMo system could be affected
thermodynamically by the necessity of large composition
modulation to achieve bcc+fcc phases and kinetically by
slow diffusion particularly in the relatively low temperature
range. The disagreements between the predictions and
experiments were principally because the IrW, IrMo, Rh
W, and RhMo binary systems were not assessed in the full
range of composition and temperature by the TCHEA3
database, leading to smaller HCP_A3 and a shift in BCC_A2
to the HCP_A3 side in the predictions. A VEC analysis has
been modified to compensate for the lack of data on HEAs
with hcp structure by adding 7.5¯VEC¯8.4, as well as
VEC³3. The former modification of the VEC analysis is
valid for HEAs comprising 4d and 5d transition metals and the higher temperature range near the limit of the solid phase.
Acknowledgment
This work was supported by JSPS KAKENHI Grant Number JP17H03375.
Appendix
The composition line has been determined under the
followingfive conditions.
(1) The bcc, bcc+hcp, hcp, hcp+fcc and fcc phases appear
simultaneously in the composition line of a cross-sectional phase diagram.
(2) The contents of the constituents (ci) roughly satisfy 5¯
ci/at%¯35, in whichfive alloys that correspond to the
above five phases can be present at an approximately
the same composition interval in a cross-sectional phase diagram.
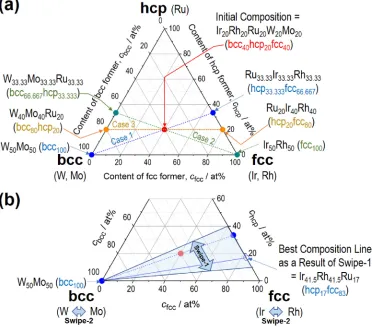
(3) The W and Mo are regarded as bcc formers, Ir and Rh as fcc formers, and Ru as an hcp former, and the
resultant IrRhRuWMo quinary system is regarded
as a pseudoternary system consisting of bcchcpfcc
formers as illustrated in Fig. A1(a).
(4) The contents of bcc and fcc formers exhibit opposite
increasing/decreasing behavior in the composition line,
because the composition line contains bcc formers and fcc formers at both ends because of condition 1. (5) The content of Ru either varies or keeps constant
against the changes of the contents of the other
constituent elements, which can be classified into the
following three cases (Cases 13). Within a
[image:8.595.113.485.99.220.2]composi-tion line under condicomposi-tion 4, the content of Ru increases with (Case 1) increasing that of fcc formers or (Case 2) decreasing that of fcc formers. Otherwise the content of Ru remains unchanged (Case 3).
The specific procedure to determine the composition line was as follows.
First, the exact equiatomic composition (Ir20Rh20Ru20
-W20Mo20, at%) was set up to be the initial composition,
which was included in the initial composition line.
Second, Cases 13 were tested preliminarily by calculating
cross-sectional phase diagrams. As a result, it was revealed that Case 1 met the demand in terms of conditions 1 and 2.
The initial composition line for Case 1 included Ir20Rh20
-Ru20W20Mo20, and W50Mo50, and Ir33.333Rh33.333Ru33.333 at
the ends in the pseudoternary system.
Third, the composition line was modified slightly by
giving a modified composition that deviated by
approx-imately 23 at%from the Ir20Rh20Ru20W20Mo20. Specifically,
the modified composition was determined by changing the
ratios of the contents of bcc, hcp, and fcc formers from the
initial ratio of 2:1:2 for Ir20Rh20Ru20W20Mo20. This process
was swiping the compositions (Swipe-1), as shown in Fig. A1(b). Then, the cross-sectional phase diagram was
computed along the modified composition line.
Fourth, the calculated phase diagrams containing the initial
and modified composition were compared in terms of the
following two parameters: (i) the composition gap between
the phase boundaries of bcc/bcc+hcp and hcp+fcc/fcc and
(ii) the size of the areas of the bcc, hcp, and fcc phases in the
cross-sectional phase diagram. When the composition gap (i) becomes smaller by modifying the composition, further changes of the ratios of the contents of bcc, hcp, and fcc
formers were carried out to consider the further modified
composition line. This is because of the favorite tendency in terms of condition 2. However, opposite ratios of bcc, hcp and fcc formers were tested when the composition gap (i) becomes larger. The authors also paid attention to (ii) to make the experiments easier. The above trial was repeated in sequence by replacing the relationship between the initial and
modified compositions with the modified and
second-modified compositions and so forth.
Finally, the contents between the bcc formers (W and Mo) and those between the fcc formers (Ir and Rh) were
differentiated to find out the best composition line by
referring to condition 2. This process was termed
“Swipe-2”in Fig. A1(b).
REFERENCES
1) J.W. Yeh, S.K. Chen, S.J. Lin, J.Y. Gan, T.S. Chin, T.T. Shun, C.H. Tsau and S.Y. Chang:Adv. Eng. Mater.6(2004) 299303.
2) B. Cantor, I.T.H. Chang, P. Knight and A.J.B. Vincent:Mater. Sci. Eng. A375377(2004) 213218.
3) J.W. Yeh:Ann. Chim.31(2006) 633648.
[image:9.595.113.485.74.401.2]4) M.C. Gao: High-entropy Alloys: Fundamentals and Applications, Fig. A1 (a) Procedure to determine the preferability among Cases 13 to achieve bcc, bcc+hcp, hcp, hcp+fcc, and fcc structures in a
(Springer, Basel, 2016) pp. xiii, p. 516.
5) B.S. Murty, J.-W. Yeh, S. Ranganathan and P.P. Bhattacherjee:High Entropy Alloys, (Elsevier, Amsterdam, 2019) pp. xxiii, 363. 6) A. Takeuchi, K. Amiya, T. Wada, K. Yubuta and W. Zhang:Jom-Us66
(2014) 19841992.
7) M. Feuerbacher, M. Heidelmann and C. Thomas:Mater. Res. Lett.3
(2015) 16.
8) K.M. Youssef, A.J. Zaddach, C.N. Niu, D.L. Irving and C.C. Koch: Mater. Res. Lett.3(2015) 9599.
9) C.L. Tracy, S. Park, D.R. Rittman, S.J. Zinkle, H. Bei, M. Lang, R.C. Ewing and W.L. Mao:Nat. Commun.8(2017) 15634.
10) K.V. Yusenko, S. Riva, P.A. Carvalho, M.V. Yusenko, S. Arnaboldi, A.S. Sulthikh, M. Hanfland and S.A. Gromilov:Scr. Mater.138(2017) 2227.
11) A. Takeuchi, T. Wada and H. Kato:Mater. Trans.60 (2019) 1666 1673.
12) S. Guo, C. Ng, J. Lu and C.T. Liu:J. Appl. Phys.109(2011) 103505. 13) F.R. de Boer, R. Boom, W.C.M. Mattens, A.R. Miedema and A.K. Nissen:Cohesion in Metals: Transition Metal Alloys, (North Holland Physics Publishing, a division of Elsevier Science Publishers B.V., The Netherlands, 1988) pp. 758.
14) A.R. Miedema and A.K. Niessen:Calphad7(1983) 2736.
15) Metal Databook, (Maruzen Co. Ltd., Tokyo, 2004) pp. 8.
16) M.J. Jang, S. Praveen, H.J. Sung, J.W. Bae, J. Moon and H.S. Kim: J. Alloy. Compd.730(2018) 242248.
17) Y. Wang, S. Curtarolo, C. Jiang, R. Arroyave, T. Wang, G. Ceder, L.Q. Chen and Z.K. Liu:Calphad28(2004) 7990.
18) Z.M. Li, C.C. Tasan, K.G. Pradeep and D. Raabe:Acta Mater.131
(2017) 323335.
19) “TCHEA3: TCS High Entropy Alloy Database”, https://www. thermocalc.com/media/54070/tchea3_extended_info.pdf, (accessed Au-gust 11, 2019).
20) Binary Alloy Phase Diagrams, Second Edition, Plus Updates (on CD-ROM), (ASM International, Materials Park, OH, U.S.A., 2011). 21) Y.F. Ye, Q. Wang, J. Lu, C.T. Liu and Y. Yang:Mater. Today19(2016)
349362.
22) T. Oguchi:Band Theory of Transition Metals (In Japanese), (Uchida Rokakuho, Tokyo, 2012).
23) O.N. Senkov, G.B. Wilks, J.M. Scott and D.B. Miracle:Intermetallics
19(2011) 698706.
24) O.N. Senkov, G.B. Wilks, D.B. Miracle, C.P. Chuang and P.K. Liaw: Intermetallics18(2010) 17581765.