Microstructural Subsequence and Phase Equilibria
in an Age-Hardenable Cu-Ni-Si Alloy
Satoshi Semboshi
1,*, Mikio Ishikuro
1, Akihiro Iwase
2and Takayuki Takasugi
2 1Institute for Materials Research, Tohoku University, Sendai 980–8577, Japan2Department of Materials Science, Osaka Prefecture University, Sakai 599–8531, Japan
We investigated the microstructural subsequence and phase equilibrium of Cu-4.3 at% Ni-2.2 at% Si alloy specimens during isothermal aging over a temperature range of 698 K to 873 K. During aging in this temperature range, the microstructure of the specimens evolved in the following sequence; continuous precipitation of fine disk-shaped δ-Ni2Si in the matrix, discontinuous precipitation of cellular components containing coarse fiber-shaped δ-Ni2Si at grain boundaries, and then occupation of the specimen with cellular components. By analyzing the variations in the hardness and electrical conductivity with aging time as well as temperature, we described the kinetics of the highest number density of fine δ-Ni2Si continuous precipitates. Based on the chemical analyses of the specimen in a phase equilibrium state using an ex-traction procedure, we proposed a revised solvus of solutes Ni and Si in the Cu solid solution phase, as well as Cu in the δ-Ni2Si intermetallic phase in a Cu–δ-Ni2Si pseudo-binary system. [doi:10.2320/matertrans.MC201706]
(Received May 30, 2017; Accepted September 19, 2017; Published October 20, 2017)
Keywords: copper alloy, precipitates, phase equilibrium, solvus, chemical extraction, ICP-OES
1. Introduction
Among various based systems, age-hardenable Cu-Ni-Si Corson-type alloys are widely used for electrical con-nectors and lead frames because of their superior balance of strength and electrical conductivity. Alloys with a typical composition of less than 5 at% Ni and 2.5 at% Si at an Ni/Si ratio of around 2.0 have been commercially fabricated by solid-solutioning at around 1173 K followed by aging over a temperature range of 673 K–773 K. Optimal thermomechan-ical processing in combination with working and aging can produce tensile strengths of more than 1000 MPa and an electrical conductivity in excess of 30% IACS. Here, % IACS represents the percentage based on the conductivity defined in the International Annealed Copper Standard at 298 K, that is, 5.8 × 10⁷Ω−1m−1. The balance of their
hard-ness and electrical conductivity is competitive with that of the widely used Cu-Be based alloys1,2). Therefore, a number
of fundamental and practical research efforts addressing Cu-Ni-Si alloys have been attempted to understand the mecha-nisms affecting age-induced microstructural evolution and to further improve their superior properties3–9).
It is generally recognized that the strengths and electrical conductivities of Cu-Ni-Si alloys are closely dependent on their microstructure; at an early stage of aging, the strength of the alloys increases owing to the continuous nucleation and growth of the nano-scaled δ-Ni2Si precipitates (i.e.,
con-tinuous precipitates (CPs)) in the matrix of Cu solid-solution phase10–17). Here, δ-Ni
2Si has an orthorhombic structure
(Space group: Pnma, lattice parameter: a = 0.504 nm, b = 0.364 nm, c = 0.708 nm)14,17,18). At a later stage of a
pro-longed aging, the strength decreases, which is primarily caused by the development of coarse cellular components consisting of the Cu solid-solution and fiber-shaped δ-Ni2Ni
phase (i.e., discontinuous precipitates (DPs)), accompanied by the consumption of the fine δ-Ni2Ni hardening
spe-cies17,19–21). Meanwhile, the electrical conductivity of the
al-loys increases monotonically during aging, because the amount of solute Ni and Si elements in the matrix decreases as a result of the formation of fine CPs and fiber DPs of δ-Ni2Si. Thus, to control the mechanical and electrical
prop-erties of the alloys, it is important to understand the precipi-tation behavior in association with the microstructures. The purpose of the present study is, therefore, to investigate the microstructural subsequence and phase equilibrium of com-mercial Cu-4.3 at% Ni-2.2 at% Si alloy during isothermal aging over a wide temperature range of 698 K–873 K. As a particular feature of this study, a chemical extraction tech-nique was used to quantitatively analyze the microstructure of the aged-specimens17,22,23). The adopted chemical
ex-traction procedure allowed direct and reliable examination of the structure, volume fraction, and compositions of the constituent phases. Based on the obtained results, the kinet-ics and phase equilibrium of the aged microstructure are discussed.
2. Experimental
Alloy blocks measuring 30 mm × 30 mm × 3 mm were used as the starting material. The chemical composition of the alloys was Cu-4.3 Ni-2.2 Si in at% (Cu-4.1 Ni-1.0 Si in mass%). The blocks were cold-rolled down to a thickness of 0.3 mm, and then cut off into strips measuring 75 mm × 5 mm × 0.3 mm. The specimens were solution-treated at 1173 K for 3 h in evacuated quartz capsules, and then imme-diately quenched in water. The contaminated surface layer on the specimens was removed by mechanical polishing. The specimens were re-capsuled in a vacuum of less than 1.0 × 10⁻² Pa, followed by isothermal aging at 698 K,
723 K, 773 K, and 873 K for 0.083 h–530 h.
The microstructure of the specimens was observed using a JEOL JSM7001F field emission- scanning electron micro-scope (FESEM). For the FESEM observations, the speci-mens were first mechanically polished and then electro-chemically polished with a 40% phosphoric acid water solution at room temperature for 5 to 10 s. The Vickers
hard-* Corresponding author, E-mail: [email protected]
ness and electrical conductivity at room temperature were measured to monitor the microstructural evolution of the specimens during isothermal aging. The Vickers hardness tests were performed using a MITSUTOYO HM101 Vickers micro-hardness tester with an applied load of 1.96 N, and the hardness values were then determined by averaging the values from more than 10 indentations. The electrical resis-tance of the specimens was measured using a standard DC four-probe method with an Agilent 34420A micro-ohm me-ter with an accuracy of ±10 μΩ, which was then used to cal-culate the electrical conductivity. The precipitates formed in the aged specimens were separated using the following ex-traction procedure, the details of which are described in the literature17,22): the surfaces of the aged specimens were
me-chanically polished again to remove the contaminated sur-face layer. After the specimens had been thoroughly rinsed in pure ethanol, they were cut into small pieces. These pieces were immersed in a 7-mol/L nitric acid/water solu-tion at 273 K for 0.3 h. As a result, the Cu matrix phase dis-solved in the solution, but the Ni and Si-rich precipitate phase remained as insoluble residue. The solution was then passed through a membrane filter with a pore diameter of 50 nm. The filtered precipitates were rinsed well with pure water and then dried in a desiccator. The structure of the separated precipitates was analyzed by X-ray diffraction (XRD) using a PANalytical X pert Pro diffractometer with CuKα radiation (wave length, λ = 0.1542 nm) and an ap-plied voltage of 40 kV. The weight fractions of the elemental
Cu, Ni, and Si in the precipitates and matrix were obtained by measuring those in the filtered residue and filtrate, re-spectively, by inductively coupled plasma-optical emission spectrometry (ICP-OES) using a Thermo Fisher Scientific IRIS Advantage DUO spectrometer. Here, the filtered resi-due, which was identified as being δ-Ni2Si, described latter,
was dissolved in a solution of nitric acid, hydrofluoric acid, and pure water (at a ratio of 2:1:4) at 373 K for 1 h in a closed Teflon container, before the ICP-OES measurements17).
3. Results and Discussion
3.1 Microstructural subsequence
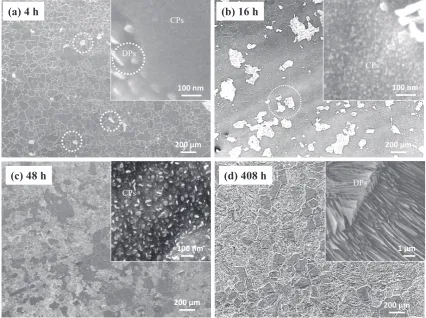
The solution-treated and quenched Cu-4.3 Ni- 2.2 Si (in at%) alloy specimen exhibited a single-phase microstructure of a supersaturated Cu solid solution with an average grain size of approximately 100 μm. Figure 1 shows FESEM mi-crographs of the specimen aged at 723 K. In an early stage of aging for 4 h shown in Fig. 1(a), we can find areas of weak contrast with a size of several nanometers in the solid solution phase (see the right-hand side of the inset image, observed at a high magnification), which must correspond to continuous precipitates (CPs) of δ-Ni2Si17). We can also find
some areas of bright contrast as indicated by the dotted cir-cles in Fig. 1(a), which corresponds to the fiber-shaped dis-continuous precipitates (DPs) of δ-Ni2Si with the same
ort-horhombic structure as the CPs, which is confirmed in a
[image:2.595.83.510.434.752.2]later section. Thus, the fiber-shaped DPs have already been formed at an early stage of aging, together with the forma-tion of fine CPs. During prolonged aging, the fine CPs con-tinuously nucleated and homogeneously dispersed in the matrix of the Cu solid solution, and then grew into disk-shaped particles with a size of several tens of nanometers, as seen in the inset micrographs of Figs. 1(b)–(c). The cellular components composed of the fiber DPs and Cu solid solu-tion phase developed spontaneously, consuming the sound grains containing the fine CPs. Finally, the cellular compo-nents occupied almost the entire region of the specimen, as shown in Fig. 1(d). No apparent microstructural evolution could be observed for a prolonged aging period longer than 408 h.
A similar microstructural result, i.e., continuous precipita-tion of fine disk-shaped δ-Ni2Si particles, discontinuous
pre-cipitation of cellular components containing coarse fi-ber-shaped δ-Ni2Si, and the eventual occupation of the
specimen with cellular components, was observed for the specimens aged at every temperature between 698 K–873 K. This indicates that, in the investigated temperature range, the equilibrium state for the alloy with a composition of Cu-4.3 at% Ni- 2.2 at% Si consists of two phases, namely, the Cu solid solution and the δ-Ni2Si formed both continuously
and discontinuously.
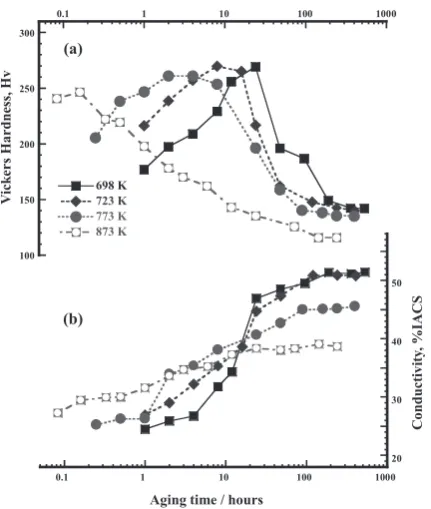
To investigate the kinetics of the microstructural subse-quence during aging, we examined the variations in the Vickers hardness and electrical conductivity for the speci-mens aged at temperatures of 698 K, 723 K, 773 K, and 873 K as a function of the aging time, as shown in Fig. 2. The Vickers hardness of the quenched specimens was 87 ± 5 HV. During aging at the investigated temperatures, the hardness increased and then reached a maximum, after which it decreased at a rate, as shown in Fig. 2 (a). The max-imum values of the hardness decreased with the aging
tem-perature, although the period required to achieve the maxi-mum hardness was reduced. The electrical conductivity of the quenched specimens was 14.5% IACS. The electrical conductivity of the specimen increased with the aging time and then reached saturation at every temperature (Fig. 2(b)). The saturated values of the conductivity decreased as the ag-ing temperature increased, although the period required to reach saturation was shortened.
The hardness of the age-hardened specimen should be af-fected mainly by structural factors, such as the size and number density of the precipitates, together with the compo-sition and volume fraction of the constituent phases. It is also accepted that the electrical conductivity (and resistivity) of the metallic materials are sensitive to the composition and volume fraction of the constituent phases24,25). Therefore,
the saturation of both the hardness and electrical conductiv-ity indicates that the specimens should be virtually in an equilibrium state, at least in terms of microstructural subse-quence. Thus, the time required to reach the equilibrium state was roughly obtained, from Fig. 2, as 360 h for the specimen aged at 698 K, 240 h for that aged at 723 K, 168 h for that aged at 773 K, and 144 h for that aged at 873 K.
Figure 3 shows the Arrhenius plots describing the satura-tion of both the hardness and electrical conductivity during isothermal aging, together with the maximum-hardening condition. The data points are well plotted on a straight line in the temperature range between 698 K–873 K, which were fitted using the following equation:
Condition of maximum-hardening:
ln (t)=−20.9+16.8×10³/T (1)
Saturation of electrical conductivity:
ln (t)=1.47+2.96×10³/T (2)
where t is the aging time [h] and T is the aging temperature [K]. Equations (1) and (2) approximately correspond to the
Fig. 2 (a) Vickers hardness and (b) electrical conductivity for Cu-4.3 at% Ni- 2.2 at% Si alloy specimens aged between 698 K–873 K.
[image:3.595.62.278.507.762.2] [image:3.595.331.518.528.714.2]kinetics required to reach the highest density of CP δ-Ni2Si
and the phase equilibrium, respectively.
3.2 Phase equilibrium
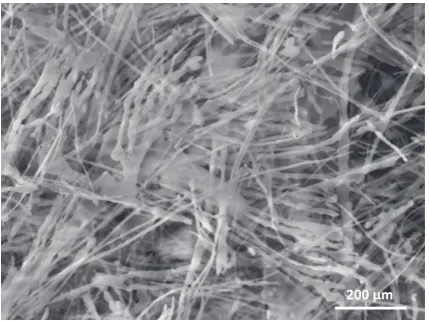
We assumed that the specimen aged beyond the period given by eq. (2) should be in an equilibrium state. To con-firm the structure of the precipitates in the equilibrium state, the precipitates of the fully aged specimens were separated by the extraction procedure, and were then subjected to XRD analysis. Figure 4 shows the appearance of the precipi-tates separated from the specimen aged at 723 K for 408 h. We can see fibers measuring several tens of nm in diameter and several µm in length, and a small number of fine parti-cles with a size of several tens of nm. This morphological feature is consistent with the DPs and CPs, respectively, shown in Fig. 1(d). Figure 5 shows the XRD profile of the precipitates separated from the specimen, which exhibited peaks corresponding to δ-Ni2Si with an orthorhombic
struc-ture having a space group of Pnma. Therefore, the precipi-tates in the aged specimens were identified as δ-Ni2Si.
The compositions and volume fractions of the constituent matrix and precipitates for the aged specimens can be also evaluated directly by performing ICP-OES analyses on the
filtrate and insoluble residue remaining after the extraction procedure. Table 1 lists the weight fractions of the elements Cu, Ni, and Si in the matrix and the precipitates of the speci-mens aged up to the final state at 698 K for 530 h, 723 K for 408 h, 773 K for 400 h, and 873 K for 240 h, which are de-noted as W m
Cu, W mNi, and W mSi, and W pCu, W pNi, and W pSi,
respectively. The total weight fractions of the Cu, Ni, and Si in the matrix and precipitates of the aged specimens, i.e.,
W m
Cu + W mNi + W mSi + W pCu + W pNi + W mSi, were always
very close to 100% (100 ± 0.5%) for all the specimens, sug-gesting that the chemical extraction procedure could account for all the constituent elements in the specimens.
The validity of the chemical compositions obtained by an extraction procedure and then ICP-OES measurement is also supported by the saturated electrical conductivity measured for the fully aged alloys. The electrical conductivity of the aged alloys can be estimated from the amount of solutes of Ni and Si in the matrix, ignoring the contribution of the δ-Ni2Si precipitate phase. Actually, the volume fractions of
the δ-Ni2Si precipitates for the specimens that are fully aged
at every temperature were estimated to be only less than 5.1 vol%, using the weight fraction in Table 1 and a calcu-lated density, 7.30 g/cm3 for δ-Ni
2Si and 8.94 g/cm3 for Cu.
The electrical conductivity of the Cu matrix containing Ni
and Si solutes, σ, was estimated using the following
Nordheim s equation:
1/σ=1/σCu+ANiCNi+ASiCSi (3)
Here, σCu is the electrical conductivity of pure copper, ANi
and ASi are the coefficients, and CNi and CSi are the
concen-trations of solutes Ni and Si, respectively. The values of ANi
and ASi were reported to be 1.25 × 10⁻⁸Ωm/at% and 3.95 ×
10−8Ωm/at%, respectively26). Thus, the electrical
[image:4.595.62.277.374.535.2]conduc-tivity calculated using eq. (3) was 52% IACS for the speci-men aged at 698 K for 530 h, 51% IACS for that aged at 723 K for 408 h, 46% IACS for that aged at 773 K for 400 h, and 39% IACS for that aged at 873 K for 240 h. These val-ues are very close to the measured ones shown in Fig. 2; i.e., 51.4% IACS at 698 K, 50.8% IACS at 723 K, 46.7% IACS at 773 K, and 38.6% IACS at 873 K.
Table 1 states that the amount of solute elements of Ni and Si in the matrix of the quenched specimen decreased significantly as a result of aging at every temperature, which is due to the formation of Ni- and Si-enriched precipitates during aging. For the specimens in an equilibrium state, the Ni and Si contents in the matrix phase increased slightly with an increase in the temperature. Meanwhile, the precipi-tates of δ-Ni2Si were found to contain a small amount of Cu,
and the Cu content increased with the temperature. The mea-sured atomic ratio of Ni/Si was almost constant, being 1.79 ± 0.04, which is somewhat less than the stoichiometric composition of 2.0. This suggests that the δ-Ni2Si
interme-tallic phase has some compositional range caused by con-taining Cu element, which was reported previously27).
The atomic fractions of Ni and Si in the matrix, and Cu in the precipitates of the specimens in the equilibrium state, which were converted from the data in Table 1 and denoted as C m
Ni, C mSi, and C pCu [at%], can be fitted with linear
func-tions and plotted as shown in Fig. 6, and be expressed by the following equations:
Fig. 4 Micrograph of precipitates separated from Cu-4.3 at% Ni-2.2 at% Si alloy specimen aged at 723 K for 408 h using an extraction procedure.
[image:4.595.60.278.590.751.2]ln Cm
Ni =0.397−545.8/T (4)
ln Cm
Si=2.864−3240/T (5)
ln Cp
Cu=3.648−2787/T (6)
In addition, the solubility product of δ-Ni2Si precipitates in
the Cu solid-solution matrix, (C m
Ni)1.79(C mSi), was given
from the eqs. (4) and (5), as following,
ln (Cm
Ni)1.79(CmSi)=3.579−4222/T (7)
Here the power of 1.79 for C m
Ni is from the Ni/Si ratio for
δ-Ni2Si precipitates based on the result listed in Table 1. The
(Ni+Si) content plotted in Fig. 6(a) is fitted by the eq. (7). The magnitudes of (C m
Ni)2(C mSi) and C pCu correspond to
the terminal compositions of the matrix and δ-Ni2Si
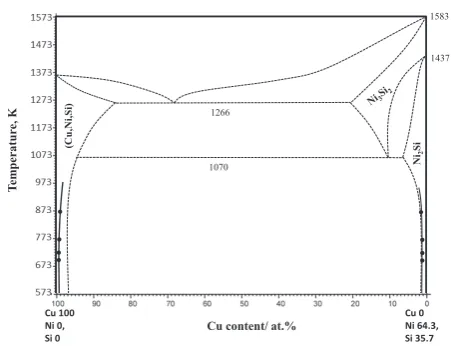
precipi-tates phases, respectively. Considering the Cu–δ-Ni2Si
pseudo binary system, we can propose the solvus (solid lines) depicted in the phase diagram of Fig. 7, which was constructed using the phase diagram produced by Sokolovslaya et al. from the experimental assessment (dot-ted lines)28). The terminal composition of the δ-Ni
2Si phase
defined by eq. (7) is in good agreement with that reported by Sokolovslaya et al.28) with an experimental accuracy, as
shown in Fig. 7. Meanwhile, the terminal composition of Cu solid solution phase, defined by eq. (6) was slightly shifted to the left with respect to the magnitude depicted in the re-ported diagram.
Strictly describing, it is controversial whether the content in the matrix and δ-Ni2Si precipitates phases, shown in
[image:5.595.44.551.93.185.2]Fig. 6, corresponds to a true equilibrium composition. The composition measured in this study might be shifted from the true one, arising from contribution of interface energy between the matrix and disk-shaped CPs or fiber-shaped
Table 1 Elemental contents in Cu solid solution and δ-Ni2Si precipitates, and atomic ratio of Ni/Si in precipitates for fully aged Cu-4.3 at% Ni-2.2 at% Si alloy specimens, as obtained by extraction procedure and ICP-OES measurement.
Aging Temp., time Matrix Precipitates
W m
Cu (mass%) W mNi (mass%) W mSi (mass%) W PCu (mass%) W PNi (mass%) W PSi (mass%) Atomic ratio of Ni/Si 698 K, 530 h 94.93 ± 0.15 0.604 ± 0.009 0.073 ± 0.021 0.048 ± 0.001 3.363 ± 0.026 0.898 ± 0.010 1.79 ± 0.03 723 K, 408 h 94.96 ± 0.11 0.609 ± 0.010 0.080 ± 0.013 0.045 ± 0.001 3.361 ± 0.006 0.924 ± 0.010 1.74 ± 0.02 773 K, 400 h 94.67 ± 0.55 0.644 ± 0.007 0.117 ± 0.014 0.053 ± 0.001 3.439 ± 0.015 0.897 ± 0.009 1.81 ± 0.02 873 K, 240 h 94.85 ± 0.67 0.712 ± 0.011 0.178 ± 0.011 0.095 ± 0.001 3.231 ± 0.014 0.851 ± 0.009 1.82 ± 0.02 as-quenched (before aging) 94.91 ± 0.13 3.991 ± 0.050 1.004 ± 0.048 --- --- ---
---Fig. 6 (a) Ni, Si, and Ni+Si contents in the Cu solid solution phase and (b) Cu content in the δ-Ni2Si precipitate phase of the fully aged Cu-4.3 at% Ni- 2.2 at% Si alloy specimens.
[image:5.595.112.483.211.406.2] [image:5.595.312.538.459.632.2]DPs with a small diameter of several ten nano-meters, ac-cording to Gibbs-Thomson effect29). Thus, an influence of
precipitation size on the compositional distribution of the constituent phases should be understood to discuss true phase equilibrium. In addition, it should be also important to confirm the solvus at a higher temperature than 873 K, as well as the eutectic and eutectoid points shown in Fig. 7. These can be examined reliably using extraction procedure, which will be reported in a future.
4. Conclusions
The precipitation behavior and phase equilibrium for Cu- 4.1 at% Ni- 2.2 at% Si alloy isothermally aged at tempera-tures of 698 K–873 K were investigated in the present study. On the basis of the results obtained, the kinetics of the mi-crostructural subsequence and the saturated composition of the constituent phases were quantitatively evaluated. The sa-lient findings can be summarized as follows:
(1) The microstructural subsequence of those specimens aged at a temperature of 698 K–873 K progressed in ac-cordance with the following subsequence; continuous precipitation of fine disk-shaped δ-Ni2Si particles,
dis-continuous precipitation of cellular components contain-ing coarse fiber-shaped δ-Ni2Si, and eventual occupation
of the specimen with cellular components. Accordingly, the quenched specimen aged at these temperatures is fi-nally decomposed into a two-phase microstructure con-sisting of a Cu solid solution and δ-Ni2Si precipitates.
(2) The kinetics of the maximum-hardness can be approxi-mated by eq. (1), which must correspond to the highest number density of continuous precipitates of fine δ-Ni2Si hardening species. The kinetics of the saturated
electrical conductivity are described by eq. (2), which corresponds to the phase equilibrium.
(3) The δ-Ni2Si precipitates in the fully aged specimens
contain a small amount of Cu, the content of which in-creases slightly with the aging temperature. The solvus of the Cu for the δ-Ni2Si phase can be provided by
eq. (6). The measured Ni/Si ratio was 1.79 ± 0.04, which is somewhat less than the stoichiometric compo-sition of 2.0. The amount of Ni and Si elements in the Cu solid solution also increases with the aging tempera-ture, as defined by eq. (7). The solvus revised in this study slightly shifted to the Cu-rich side in comparison with the Cu–δ-Ni2Si pseudo-binary diagram produced
by Sokolovslaya et al.
Acknowledgements
The original alloy ingot was provided by YAMATO ALLOY Co., Ltd. The authors are grateful to Prof. S. Hanada, and Prof. N. Masahashi of the Institute for Materials Research (IMR) of Tohoku University, Dr. A. Sugawara and Mr. H. Suda of DOWA METALTECH Co.,
Ltd. for their useful discussions and comments. The authors also thank Mr. E. Aoyagi of the IMR for the technical assis-tance that was provided. Financial support provided by the Japan Society for the Promotion of Science (JSPS) as a Grant-in-Aid for Scientific Research (C) (No. 26420663) and by the Japan Copper and Brass Association are grate-fully acknowledged.
REFERENCES
1) H. Tsubakino, R. Nozato and A. Yamamoto: J. Mater. Sci. 26 (1991) 2851–2856.
2) C. Watanabe, T. Sakai and R. Monzen: Philos. Mag. 88 (2008) 1401–1410.
3) M.G. Corson: Iron. Age (Omaha) 119 (1927) 421–424. 4) M.G. Corson: Electr. World (Brisb.) 89 (1927) 137–139.
5) Z. Rdzawski and J. Stobrawa: Mater. Sci. Technol. 9 (1993) 142–149. 6) F. Huang, J. Ma, H.L. Ning, Y.W. Cao and Z. Geng: Mater. Lett. 57
(2003) 2135–2139.
7) R. Monzen and C. Watanabe: Mater. Sci. Eng. A, 483–483 (2014) 117–119.
8) S. Lee, H. Matsunaga, X. Sauvage and Z. Horita: Mater. Charact. 90 (2014) 62–70.
9) M. Gholami, J. Vesely, I. Altenberger, H.-A. Kuhn, M. Janecek, M. Wollmann and L. Wagner: J. Alloy. Compd. 696 (2017) 201–212. 10) S.A. Lockyer and F.W. Noble: J. Mater. Sci. 29 (1994) 218–226. 11) D.M. Zhao, Q.M. Dong, P. Liu, B.X. Kang, J.L. Huang and Z.H. Jin:
Mater. Sci. Eng. A 361 (2003) 93–99.
12) Y. Takahashi, T. Sanada, S. Sato, T. Okajima, K. Shinoda and S. Suzuki: Mater. Trans. 48 (2007) 101–104.
13) E. Donoso, R. Espinoza, M.J. Dianez and J.M. Criado: Mater. Sci. Eng. A 556 (2012) 612–616.
14) J. Yan-lin, W. Ming-pu, C. Chang, D. Qi-yi, W. Shan and L. Zhou: J. Alloy. Compd. 557 (2013) 147–51.
15) T. Hu, J.H. Chen, J.Z. Liu, Z.R. Liu and C.L. Wu: Acta Mater. 61 (2013) 1210–1219.
16) H. Azzeddine, B. Mehdi, L. Hennet, D. Thiaudière, B. Alili, M. Kawasaki, D. Bradai and T.G. Langdon: Mater. Sci. Eng. A 597 (2014) 288–294.
17) S. Semboshi, S. Sato, A. Iwase and T. Takasugi: Mater. Charact. 115 (2016) 39–45.
18) F. Bosselet, J.C. Viala, C. Colon, B.F. Mentzen and J. Bouix: Mater. Sci. Eng. A 167 (1993) 147–154.
19) Q. Lei, Z. Li, M.P. Wang, L. Zhang, S. Gong, Z. Xiao and Z.Y. Pan: J. Alloy. Compd. 509 (2011) 3617–22.
20) E. Lee, K.K. Euh, S.Z. Han, S.H. Lim, J.H. Lee and S.S. Kim: Met. Mater. Int. 19 (2013) 1183–1188.
21) C. Watanabe, R. Monzen and K. Higashimine: Proceedings of an International Conference on Solid-Solid Phase Transformations in Inorganic Materials, 1 (2005) 713–718.
22) S. Semboshi, M. Ishikuro, S. Sato, K. Wagatsuma and T. Takasugi: Mater. Charact. 82 (2013) 23–31.
23) S. Semboshi, S. Amano, J. Fu, A. Iwase and T. Takasugi: Metall. Mater. Trans., A 48 (2017) 1501–1511.
24) R. Landauer: J. Appl. Phys. 23 (1952) 779–874.
25) J. Miyake and M.E. Fine: Acta Metall. Mater. 40 (1992) 733–741. 26) J.S. Smart, A.A. Smith, Jr. and J.A. Philips: Trans. Metall. AIME 143
(1941) 272.
27) W. Sun, H. Xu, S. Liu, Y. Du, Z. Yuan and B. Huang: J. Alloy. Compd.
509 (2011) 9776–9781.
28) E.M. Sokolovslaya, O.I. Chechernikova, E.I. Gladyshevskii and O.I. Bodak: Russ. Metall. 6 (1973) 114–118.