Non-Destructive Evaluation of Weld Structure Using Ultrasonic Imaging Technique
Takahiro Ebuchi, Junichi Kitasaka and Tatsuyuki Nagai
Non-destructive Inspection Co., Ltd., Osaka 550-0014, Japan
The welding penetration depth and width measured by destructive inspection are very important items to evaluate welding quality. However, the destructive method has some limitations and disadvantages. In this study, ultrasonic measurement technique which can make the image of cross sectional macro structure non-destructively was investigated. As a result, it is concluded that signal processing of ultrasonic back scattering is effective to measure the penetration depth of welds. [doi:10.2320/matertrans.I-M2011857]
(Received November 9, 2009; Accepted October 29, 2011; Published March 25, 2012) Keywords: ultrasonic, back scattering wave, signal processing, imaging, weld
1. Introduction
One of the most important items of the control in the welds is to detect lack of penetration and to estimate penetration depth and width. In general, sampling destructive inspection, namely cutting some specimens, has been carried out to observe cross sectional configuration of metallurgical struc-ture of welds. This method, however, has some disadvantages such as high cost, time consuming, waste of materials and so on. Therefore, non-destructive examination (NDE) method is expected to substitute for destructive method.
Although there are several NDE methods to detect flaws in welds, any of them cannot be used for observation of metallurgical structure. Under this background, we tried to apply ultrasonic examination which has potential ability to identify metallurgical structure comparing any other NDE methods. High frequency ultrasound scatters crystal-line during propagating in metallic materials and scattered energy depends on grain size of crystal. Accordingly there are some possibilities to estimate penetration depth and width non-destructively using ultrasonic scattering wave technique.
In this study, we tried to develop image processing to observe the structure and constitution of metal section of welds. Furthermore the obtained results were compared to metal section observed by metallographic methods to confirm the accuracy of the developed technique.
2. Experimental Procedure
We used three types of specimen as shown in Fig. 1. A weld bead was placed on the steel plate (6 mm in thickness) in specimen 1, fillet welding was carried out on lap joint (3.2 mm in thickness) in specimen 2 and fillet welding was carried out on set-on nozzle in specimen 3, as shown in Figs. 1(a), 1(b) and 1(c), respectively.
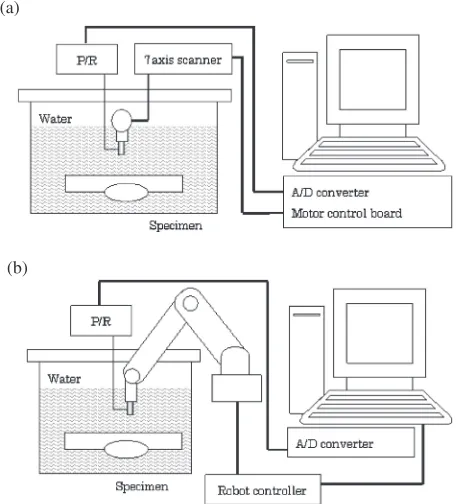
We used immersion technique for ultrasonic measurement. Two types of ultrasonic measuring devices, FLEXSCAN SYSTEM (INSIGHT KK) and robot arm type ultrasonic measuring system (developed by NDIC), were used. The former device is appropriate to simple scanning and the later device was developed for making complex motion. We select these devices by the test conditions. Figure 2 shows a schematic illustration of the experimental setup.
The testing conditions of ultrasonic measurement are as follows, type of sensor: focus type [focal length: 25.4 mm (in water)], frequency of sensor: 20 MHz, focus position: 50%of thickness of specimen and band-pass-filter of 550 MHz.
3. Results and Discussion
3.1 Results of normal beam technique
The difference of signal patterns from back scattering wave
(a) (b) (c)
Fig. 1 Schematic illustration of each specimen. (a) specimen 1 (b) speci-men 2 (c) specispeci-men 3.
(a)
(b)
Fig. 2 Diagram of system for backscattering measurements. (a) FLEXSCAN system (b) robot arm type system.
Special Issue on APCNDT 2009
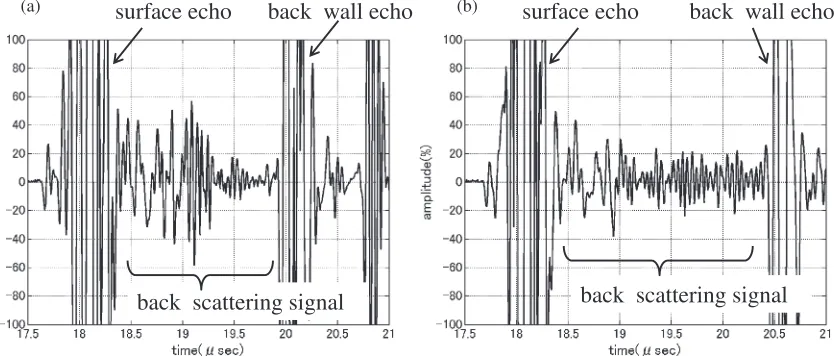
[image:1.595.312.543.263.335.2] [image:1.595.314.543.381.633.2]between base metal and weld was investigated using normal beam technique and specimen 1 (thickness=6 mm). In this case, ultrasound goes into the test specimen from bottom (the opposite side of weld) of base metal. Figure 3 shows the typical example of RF (Radio Frequency) waveform of base metal and weld area.
The amplitude and the phase of back scattering signal observed in RF presentation depend on the size and orientation of metallurgical grain, consequently the random sample of back scattering signals has not constant wave form dependent on measuring area. However, it is thought that the behavior of magnitude of back scattering wave in the uniform structure, such as a base metal should be constant. Therefore, we executed signal processing, and averaging, to clarify the behavior of magnitude of back scattering wave.1) We used the envelope detection before executing signal processing, because the amplitude after averaging becomes zero that means the signal would disappear.
Figure 4 is results after signal processing. The dotted line in Fig. 4 shows reference level of base metal. We canfind out the significant difference between base metal and welds as shown in Fig. 4. However, the large magnitude signal is presented in the center between surface and back wall echo in
spite of uniformity of base metal structure. This result shows that the waveform includes the characters of sensor itself and characters of attenuation of material, namely the difference does not indicate the metal structure itself. Therefore, we attempted to normalize the signal against the waveform of base metal shown by dotted line in Fig. 4.
Figure 5 is result of normalized analysis. We recognize difference of signal pattern between base-metal and weld-area as shown in Fig. 5. As a result, the normalized magnitude of backscattering wave shown in vertical axis is indicate changing continuously for weld area, while it is constant of approximately 1 for base metal. This result shows that grain size in base metal is constant and grain size in welds varies by considering that normalized magnitude depend on the grain size.2,3) The structure of weld has changed continuously, so we can recognized a clear difference.
Now, we provide the case that the metal structure has uniformity for welding line direction, we averaged 12,000 data which were obtained by B-scan data of 30 mm in width (Pitch: 0.1 mm) and step-scan data of 20 mm in width (pitch: 0.5 mm) to apply the above-mentioned method of image processing. Accordingly, we acquired certain amount of data from wide area for averaging.
surface echo
back wall echo
surface echo
back wall echo
back scattering signal
back scattering signal
(a) (b)
Fig. 3 Ultrasonic RF wave for normal beam technique from back side. (a) base metal (b) weld.
surface echo
back wall echo
surface echo
back wall echo
back scattering signal
back scattering signal
(a) (b)
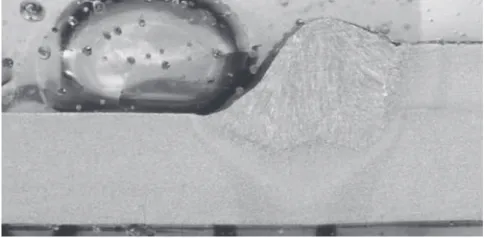
[image:2.595.94.511.73.251.2] [image:2.595.87.509.295.476.2]Figure 6 shows the result of UT imaging of specimen, and Fig. 7 is optical macroscopic photograph of cross section of specimen 1. As a result, we confirmed that the magnitude of normalized back scattering wave is related to grain size of test material large signal is obtained from the area of large grain size, such as a weld metal zone, small signal is obtained from the area of small grain size, such as heat affect zone (HAZ). Thus, it was confirmed that the ultrasonic technology with use of image processing makes it possible to construct the image of cross sectional view of welds. The result of UT imaging can be expected to take the place of optical macroscopic photograph.
The penetration depths are usually measured by visually on optical macroscopic photograph. For instance the broken line A is regarded as penetration depth in Fig. 7. To investigate the method to measure the penetration depth from the images we obtained, optical macroscopic photo-graphs were compared with UT imaging. Each of the
brightness extracted from the photos in optical microscopy and the magnitude of back scattering wave in UT imaging was normalized on the basis of the data from base metal. In other words, the relative values were calculated assuming that each of the brightness in photos and signal amplitude in UT from base metal is equal to 1. Then, we picked the data from the center line of the welds. As a result, the normalized brightness in photos and normalized magnitude in UT are represented in Fig. 8. The real line shows normalized brightness of optical macroscopic photo and the dotted line shows the normalized magnitude of back scattering wave of UT in the figure. The line B, in Fig. 8, corresponds to the line A in Fig. 7. When an immediate sharp increase of normalized signs magnitude in UT are obtained, the line B can be determine at the cross point 2 in normalized magnitude. And if we constantly measure along the scanning direction by the measuring method andfind out its maximum value, we can estimate the maximum penetration depth. For this example, it could be 0.9 mm, and it is the same as the depth by visually on macroscopic photograph.
3.2 Results of angle beam technique
The imaging of macro structure can be carried out by the normal beam technique, however it is limited to approach from bottom of specimen. Accordingly, we tried to apply the angle beam, double traverse technique, from front surface (same face of weld) of base metal. This technique can avoid obstruction of bead. We consider using specimen 2 (specimen offillet weld) and data of wide area.
Figure 9 is the result of UT imaging of angle beam technique, and Fig. 10 is optical macroscopic photograph of specimen section. It can be said that UT imaging is very similar to the macroscopic photograph. So, this technique makes it possible to construct the image of cross section. And the penetration depth measured by the same method using normal beam technique is 1.5 mm and the same as the depth by using optical macroscopic photograph.
3.3 Results of advanced technique
As described the above, we need averaging from a number of data to establish a cross section image, so we have to acquire certain amount of data from wide area. Moreover, this
surface echo
back wall echo
surface echo
back wall echo
back scattering signal
back scattering signal
(b) (a)
Fig. 5 Normalized backscattering signal. (a) base metal (b) weld.
Fig. 6 Ultrasonic cross section image.
A
[image:3.595.84.511.73.252.2] [image:3.595.49.290.295.471.2]area must have uniformity of metal structure. This means that the result of imaging in a local area is obtained by the data averaged within certain area, therefore the short length welding, spot weld and so on, can not be reconstructed. Because, it is thought that the metal structure is different for each measuring position.
To solve these problems, we examined possibility of imaging by the use of data from multi angle similar to sector scan. We conducted averaging from the data of different angle of incidence at the same position of cross section, using ultrasonic measuring system of robot arm type. We applied the technique to specimen 2 (specimen of fillet weld). The direction of incidence of ultrasound is same to angle beam
technique. The refraction angle is changed from 35 to 55 degree. In this case, the focus position is expressed in the following eq. (1).4) Figure 11 shows the schematic illustra-tion of focus posiillustra-tion by angle beam technique of immersion method.
L2=L1¼tan¡=tanª!D¼L2cosª ð1Þ
Where, L1 is focal length without considering refraction at the interface, L2 is focal length with refraction at the interface, L3 is length from sensor to incident point of specimen,ªis refraction angle, and D is focus position from surface of specimen.
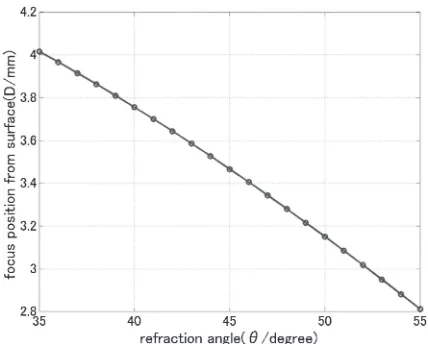
Assuming that the incident angle ¡ is changed with constant distance of L3=10 mm (L1=15 mm), the relation-ships between angle of refraction (ª=3555 degree) and focus position (D) are shown in Fig. 12. We used the velocities of 1480 m·s¹1 in water and 3230 m·s¹1 in the specimen to calculate refraction angle. So focus position can be estimated from 2.8 to 4.0 mm. This measuring method is refereed to as‘multi-angle and multi-focus position method’ in this paper.
Figure 13 is the result of multi-angle and multi-focus position method when ªis from 35 to 55 degree, and focus position (D) is from 2.8 to 4.0 mm. As a result, it was
surface echo
Back wall echo
surface echo
Back wall echo
B
Fig. 8 Macroscopic photo of cross section for specimen 1.
[image:4.595.84.515.73.261.2]Fig. 9 Ultrasonic cross section image for angle beam technique.
[image:4.595.315.535.296.456.2]Fig. 10 Macroscopic photo of cross section for specimen 2.
[image:4.595.48.290.302.435.2] [image:4.595.48.290.470.589.2]confirmed that we can obtain a similar result to the previous method using the multi-angle and multi-focus position method. So we can get the cross section image based on local area data.
Next, we executed verification test for competitive of using multi-angle and multi-focus position method in local area. The imaging technique using angle beam technique was compared with the imaging using angle and multi-focus position method by specimen 3 (weld of non-linearly bead).
Figures 14(a) and 14(b) show the results of specimen 3 by the angle beam technique and by multi-angle and multi-focus position method respectively. Figure 15 is optical macro-scopic photograph of specimen 3 section. As shown in the Fig. 14(b) the shape of welds can be confirmed precisely using the multi-angle and multi-focus position method although it cannot be confirmed using the angle beam technique in Fig. 14(a).
Figures 16(a) and 16(b) show the area which can be measured by angle beam technique and multi-angle and multi-focus position method. The cross section image was not reconstructed using angle beam technique, because the weld position is different for each B-scan data, and the signal of weld nearly disappeared by averaging.
[image:5.595.306.549.63.195.2]On the other hand, the cross section image was reconstructed using angle multi-angle and multi-focus position method, because the weld position is same for each
Fig. 12 Relationship between refraction angle (ª) and focus position (D).
Fig. 13 Ultrasonic cross section image for multi-angle and multi-focus position method.
(a) (b)
[image:5.595.62.276.68.240.2]position of weld
position of weld
Fig. 14 Ultrasonic cross section image for specimen 3. (a) angle-beam technique (b) multi-angle and multi-focus position method.
[image:5.595.80.511.271.427.2]shape of weld
Fig. 15 Macroscopic photo of cross section for specimen 3.
measuring area measuring area
(a) (b)
[image:5.595.307.548.465.622.2]B-scan data. Thus, we can apply the data for averaging, and we can confirm that the result of angle beam technique is different from the result of multi-angle and multi-focus position method.
In the case of weld of non-linearly bead, it is concluded that the result can be improved by angle and multi-focus position method.
4. Conclusion
The following conclusions were obtained through this study.
(1) Signal processing of normalized back scattering waves is effective to distinguish weld metal from base metal. (2) The ultrasonic imaging technique makes it possible to construct the image of cross sectional view of welds and
to estimate penetration depth non-destructively. (3) It is confirmed that the imaging in local area, which is
impossible in the normal beam technique and the angle beam technique, can be obtained using the multi-angle and multi-focus position method.
REFERENCES
1) J. Kitasaka, T. Ebuchi and T. Nagai: JSAE Fall Conference 2007, Kyoto, (Society of Automotive Engineers of Japan, 2007) pp. 912.
2) K. Goebbels: Research Techniques in Nondestructive Testing, Orlando, ed. by R. S. Sharpe, (Academic Press, 1980) pp. 87157.
3) J. Kitasaka and K. Mukai: JSNDI Fall Conference 2000, Miyagi, Japan, (The Japan Society for Non-Destructive Inspection, 2000) pp. 1316. 4) I. N. Ermolov and V. G. Shcherbinskii: Use of