DISCUSSION PAPER SERIES
ABCD
www.cepr.org
Available online at:
www.cepr.org/pubs/dps/DP5639.asp
www.ssrn.com/xxx/xxx/xxx No. 5639
DECENTRALIZATION AND THE
PRODUCTIVE EFFICIENCY OF
GOVERNMENT: EVIDENCE
FROM SWISS CANTONS
Iwan Barankay and Ben Lockwood
ISSN 0265-8003
DECENTRALIZATION AND THE
PRODUCTIVE EFFICIENCY OF
GOVERNMENT: EVIDENCE
FROM SWISS CANTONS
Iwan Barankay, IZA and University of Essex Ben Lockwood, University of Warwick and CEPR
Discussion Paper No. 5639 April 2006
Centre for Economic Policy Research 90–98 Goswell Rd, London EC1V 7RR, UK Tel: (44 20) 7878 2900, Fax: (44 20) 7878 2999
Email: [email protected], Website: www.cepr.org
This Discussion Paper is issued under the auspices of the Centre’s research programme in PUBLIC POLICY. Any opinions expressed here are those of the author(s) and not those of the Centre for Economic Policy Research. Research disseminated by CEPR may include views on policy, but the Centre itself takes no institutional policy positions.
The Centre for Economic Policy Research was established in 1983 as a private educational charity, to promote independent analysis and public discussion of open economies and the relations among them. It is pluralist and non-partisan, bringing economic research to bear on the analysis of medium- and long-run policy questions. Institutional (core) finance for the Centre has been provided through major grants from the Economic and Social Research Council, under which an ESRC Resource Centre operates within CEPR; the Esmée Fairbairn Charitable Trust; and the Bank of England. These organizations do not give prior review to the Centre’s publications, nor do they necessarily endorse the views expressed therein.
These Discussion Papers often represent preliminary or incomplete work, circulated to encourage discussion and comment. Citation and use of such a paper should take account of its provisional character.
CEPR Discussion Paper No. 5639
April 2006
ABSTRACT
Decentralization and the Productive Efficiency of Government:
Evidence from Swiss Cantons*
Advocates of fiscal decentralization argue that amongst other benefits, it can
increase the efficiency of delivery of government services. This paper is one of
the first to evaluate this claim empirically by looking at the association
between education expenditure decentralization and the productive efficiency
of schools using a data-set of Swiss cantons. We first provide careful
evidence that expenditure decentralization is a powerful proxy for legal local
autonomy. Further panel regressions of Swiss cantons provide robust
evidence that more decentralization is associated with higher educational
attainment. We also show that these gains lead to no adverse effects across
education types but that male students benefited more from educational
decentralization closing, for the Swiss case, the gender education gap.
JEL Classification: H40, H52, H70 and I20
Keywords: decentralization, local public goods and productive efficiency
Iwan Barankay
Department of Economics
University of Essex
Wivenhoe Park
Colchester
CO4 3SQ
Tel: (44 1206) 872 729
Email: [email protected]
For further Discussion Papers by this author see:
www.cepr.org/pubs/new-dps/dplist.asp?authorid=156718
Ben Lockwood
Department of Economics
University of Warwick
Coventry
CV4 7AL
Tel: (44 247) 6528 906
Fax: (44 247) 6572 548
Email: [email protected]
For further Discussion Papers by this author see:
* We thank Imran Rasul, Michael Smart, Koleman Strumpf, Daniel Sturm,
Alois Stutzer, the editor Sören Blomquist and two anonymous referees for
comments. Thanks also go to seminar participants at the Workshop on
Federalism and Decentralization at ZEI Bonn 2003, the Public Economics
Weekend Leicester 2003, the Canadian Public Economics Group Annual
Conference Toronto 2004, CEPR/SNS Public Policy Symposium Stockholm
2004, CESifo Munich, CORE, Essex, and Warwick for useful comments. The
first author thanks the ESRC for financial support. We are indebted to the
Swiss Federal Statistical Office for invaluable data support. All errors remain
our own.
1. Introduction
Fiscal decentralization, the allocation of tax and spending powers to lower levels of gov-ernment, is now an established policy objective, in many developed and developing coun-tries. Moreover, it is actively promoted as a development strategy by organizations such as the World Bank (Azfar et al., 2001, World Bank, 2000). The usual advantages that are claimed for decentralization that one can …nd in the literature include the following (Azfar et al., 2001, Lockwood, 2005, Oates, 1999). First, decentralization is claimed to improve
allocative e¢ ciency, in the sense that the goods provided by governments in localities will be better matched to the preferences of the residents of those localities. This is some-times known as thepreference-matching argument. Second, decentralization is argued to increase the e¢ ciency of delivery of government services. In this literature, production e¢ ciency is interpreted in a wide sense, to accommodate ine¢ ciencies like corruption, waste, and poor governance. There is now quite a large literature on decentralization and allocative e¢ ciency1. By contrast, the literature on decentralization and productive
ine¢ ciency is small.
The theoretical literature identi…es three mechanisms by which decentralization may lead to increased e¢ ciency2. The …rst is that decentralization may give voters increased
electoral control over incumbents. For example, in Seabright (1996) and Persson and Tabellini (2000, Chapter 9), decentralization is shown, under some conditions, to reduce the incentives for incumbents to divert rents from tax revenue, because under decentral-ization, the (negative) link between such rent diversion and the probability or re-election is stronger. Hindriks and Lockwood (2005) extend this argument to show how decentral-ization may increase the equilibrium probability that corrupt incumbents are voted out of o¢ ce (a stronger selection e¤ect in the terminology of Besley and Smart, 2004).
The second mechanism is that decentralization enables yardstick competition be-tween sub-national governments: voters can use the performance of neighbouring gov-ernments (or govgov-ernments of regions that are otherwise similar to their own) to make inferences about the competence or benevolence of thier own local politicians (Besley and
1See for example, Alesina and Spolare(1997), Besley and Coate (2003), Bolton and Roland (1997),
Ellingsen (1998), Gilbert and Picard (1996), Lockwood (2002), Oates (1972), Oberholzer-Gee and Strumpf (2002), Wallis and Oates(1988).
2Note that along with all of the related literature, we estimate a reduced form relationship between
…scal decentralization and productive e¢ ciency. In our data set, we have no way of distinguishing between the lobbying channel, and the political agency channel. In particular, data on any dimension of lobbying activity in any country, including Switzerland, is very hard to …nd, and does not exist at the cantonal level.
Smart(2004), Bordignon, Cerniglia, and Revelli (2004))
The third mechanism is that decentralization may lead to a decrease in lobbying by interest groups, which both distorts policy choice and increases waste of public funds. Here, a small number of contributions by Bardhan and Mookherjee (2003), Bordignon, Colombo, and Galmarini (2003), and Redoano (2003) emphasize that the link between decentralization and lobbying is ambiguous. Indeed, under some conditions, there can be more lobbying and distortion of policy choice under decentralization, con…rming the belief, going back to the US Federalist Papers in the 18th century, that local government is more susceptible to “capture” by lobbies.
The existing empirical literature does not try to precisely identify these mechanisms. Rather, the approach is to look at a reduced-form relationship between …scal decentral-ization and some indicator of the e¢ ciency of government. This literature is, to our knowledge, principally based on cross-country data. The level of …scal decentralization is usually3 measured by the percentage of government expenditures made, or taxes collected, at sub-national level, as recorded by the IMF’s Government Financial Statistics. These papers then run regressions where the dependent variable is some easily measured and internationally comparable outcome of government activity against the preferred decen-tralization measure together with a set of controls. For example, in Khaleghian, 2003, the outcome is immunization coverage rate in the population Treisman, 2002, used im-munization coverage also, along with basic drug availability, youth illiteracy rates, and the number of kilometers of paved road per resident of the country. Alternatively, some papers use as the dependent variable some more general indicator of government e¤ective-ness (Huther and Shah, 1998), or corruption (Mello and Barenstein, 2001, Fisman and Gatti, 2000).
In our view, there are two main problems with this literature. First, many of these papers rely on the IMF measure of …scal decentralization which it is widely recognized -does not measure very accurately the true autonomy of sub-central government to choose expenditures and set taxes4. Second, these regressions do not estimate government
“pro-3Triesman (2002) is an exception here: he uses several di¤erent constitutional indicators of
decen-tralization, such as a dummy variable for a federal country, the number of di¤erent tiers of government, etc.
4For a critique of the IMF’s Government Finance Statistics. the use of these statistics as measures
of the true autonomy of local governments, see Ebel and Yimaz(2002). These statistics tend to over-estimate the share of government expenditure and tax revenues that are under the control of sub-national government, and they do so in a way that varies widely across countries. For example, consider a country (e.g. Germany) where some taxes are set nationally but where the revenues are shared with sub-national governments via a …xed formula. The share of tax revenue going to sub-national government is measured
duction functions”, because they do not control for the inputs to the output that is the dependent variable. For example, several papers that study health outputs do not con-trol for health expenditures, number of doctors, etc. In the absence of concon-trols for these inputs, these regressions can not tell us much about the e¢ ciency of government as any observed correlation between decentralization and government output can be attributed to omitted variable bias.5
To confront these criticisms, our paper uses data on …scal decentralization and ed-ucational inputs and outputs from Swiss cantons over the period 1982-2000. There are several advantages of these data. First, there are data on the level of …scal decentraliza-tion of spending on educadecentraliza-tion within each Canton, collected on a consistent basis over Cantons and years. So, this indicator is likely to be a much better indicator of true …scal autonomy than in the cross-country case. Moreover, the spending relates to education only, and so there is no danger of the kind of aggregation bias that arises when using the decentralization of total expenditure as an indicator, as do the studies cited above. Our paper also relies on speci…c features of the Swiss context that allow us to treat the varia-tion in decentralizavaria-tion to be exogenous with respect to educavaria-tional attainment, discussed further in Section 2.4 below.
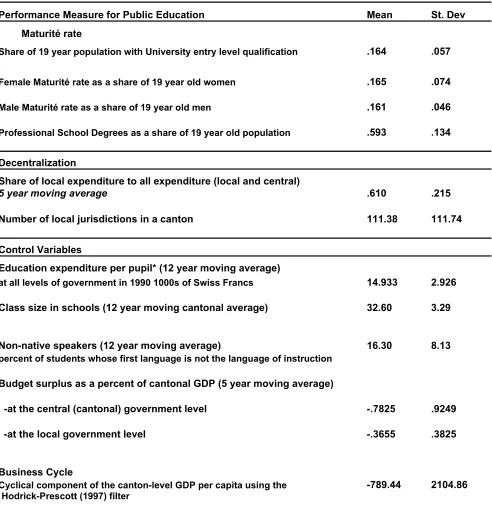
As an additional check on this, we study the relationship across Cantons between the spending measure of decentralization and various direct measures of sub-cantonal auton-omy in educational policy, speci…cally, which level of government has the authority to appoint teachers and/or determine their pay level, whether the local government has the power to set incentive pay, and whether they have some powers over the organization of the school or curriculum. There is a strong positive correlation between the expendi-ture measure and an index of these direct measures. Second, in contrast to the existing literature, as well as measuring “output,” we can control for the in‡uence of inputs on educational outputs, such as educational expenditure per pupil and class size. In our sample the education output in a given year is the fraction of the 19 year old population that obtains the Maturité certi…cate that allows continuation to university.6
in the IMF’s statistics as sub-national revenue, even though the lower level of government may have little or no control over choice of the rate or the base. Similar problems appear on the expenditure size from spending that is mandated by central government but implemented by lower-level governments.
5For example, if it is found that decentralization is positively related to immunization rates (as does
Khaleghian, 2003), this could simply re‡ect the fact that decentralized countries spend more on immu-nization, not that they can deliver this service with greater e¢ ciency.
6This measure is a natural choice for Switzerland as standardized test scores are not available. Other
papers (Jacob and Lefgren, 2005), employs measures of educational attainment combined with subjective teacher performance evaluations. Using US data they show that higher poverty schools strongly value
Our main …nding is that there is a robust positive relationship between …scal decen-tralization and productive e¢ ciency of public good provision in the case of education. This is present even when canton and year e¤ects and further control variables are al-lowed for. Finally we …nd no empirical support that the gains were accompanied by losses in terms of other measures of educational attainment. However, we should note that because the education “production function” is being estimated at the level of the can-ton, rather than the individual school, our …nding might be interpreted as partly due to better preference-matching with …scal decentralization. For example, more decentralized cantons may be better able to direct resources towards schools where they know there is a stronger demand for education up to maturité level.
We also take our investigation further by asking whether other - possibly time-invariant - features of cantonal and local government interact with decentralization of education to a¤ect the Maturité pass rate. We …nd that a …ve-year moving average of both cantonal and local budgetary surplus (which we take to measure “good governance”, following Galiani. and Schargrodsky, 2002) tends to have a positive interaction e¤ect on the pass rate. So, a given amount of decentralization will lead to greater e¢ ciency gains if the local government is more competent.
We also …nd, that the number of local jurisdictions in a canton (which we take to measure possible economies of scale) has a negative interaction e¤ect on decentralization. This is consistent with theoretical predictions, centralizing expenditure on education will have greater e¢ ciency gains - or rather, smaller losses - when the scope for economies of scale is larger.
The rest of the paper is laid out as follows. Section 2 describes the context of decen-tralization in Switzerland and why the variation in decendecen-tralization can arguably taken to be exogenous. Section 3 assesses the extent of local autonomy across cantons and its relationship to expenditure decentralization. Section 4 then turns to the empirical evi-dence of expenditure decentralization and educational attainment. Section 5 concludes and discusses the results.
student achievement and are essentially indi¤erent to the principal’s report of a teacher’s ability to promote student satisfaction.
2. Education Decentralization in Switzerland
2.1. Some Background
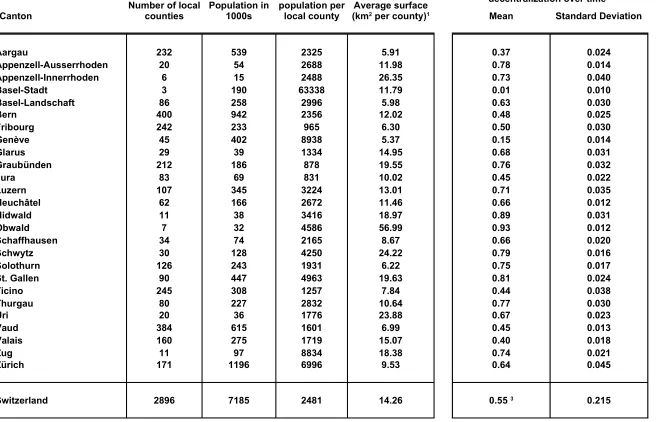
Switzerland is a Confederation of 26 cantons. These cantons are independent from the federal government in terms of school-level education and most aspects of the day-to-day life in which the state is involved. These 26 Cantons are further divided into 2896 local counties. Table 1 gives for each canton the number of local counties, the average population size per county and the average surface per local county.7 As it is apparent,
the number of local counties per canton, also referred to as fragmentation, is associated with population size. A simple correlation between population size in a canton and the number of local counties is 0.69, so more populous cantons have more local counties. Despite this high correlation between population size and the number of counties there is still a large variation in the degree of administrative decentralization, as measured by the average population per local county in a canton. As the number of counties per region does not vary over time we control for this aspect of administrative decentralization by …xed e¤ects.
Our focus is on school education. In Switzerland, there is a primary school level, a lower secondary school level, and, …nally, an upper secondary school level. The …rst two school levels comprise the nine years of compulsory education8. The third level, with a
duration of four to …ve years, o¤ers the university entry quali…cation, called the Maturité, to students who successfully completed this school and past the …nal exams.9 This last
level of education will be used as a proxy for educational attainment.
Many responsibilities are common across all cantons in the way they are shared be-tween the local and the central government. Common features among all cantons are that the primary school is the exclusive responsibility of the local communities and many as-pects of the upper secondary school is under the jurisdiction of the cantonal government. School material and the de…nition of aims, scope, and structure of school at all three levels are regulated by cantonal, i.e. central, law. Organizational issues concerning the day-to-day running of the schools like the allocation of pupils to classes, the enforcement of discipline at the school, and ensuring that pupils attend class are the responsibility
7The average surface is based on the total polygonal surface for each canton minus the non-productive
surfaces, i.e. lakes, glaciers, rocks, etc.
8Many cantons however give pupils the option to stay on for one more year after the ninth year without
giving an additional quali…cation.
9There also exist professional schools that qualify students for …eld-speci…c tertiary education. We
return to those type of schools in the section assessing adverse e¤ects of decentralization.
Table 1: Descriptive Statistics by Canton
Canton Mean Standard Deviation
232 539 2325 5.91 0.37 0.024
20 54 2688 11.98 0.78 0.014
6 15 2488 26.35 0.73 0.040
3 190 63338 11.79 0.01 0.010
86 258 2996 5.98 0.63 0.030
Bern 400 942 2356 12.02 0.48 0.025
242 233 965 6.30 0.50 0.030
45 402 8938 5.37 0.15 0.014
29 39 1334 14.95 0.68 0.031
212 186 878 19.55 0.76 0.032
83 69 831 10.02 0.45 0.022
107 345 3224 13.01 0.71 0.035
62 166 2672 11.46 0.66 0.012
11 38 3416 18.97 0.89 0.031
7 32 4586 56.99 0.93 0.012
34 74 2165 8.67 0.66 0.020
30 128 4250 24.22 0.79 0.016
126 243 1931 6.22 0.75 0.017
90 447 4963 19.63 0.81 0.024
245 308 1257 7.84 0.44 0.038
80 227 2832 10.64 0.77 0.030
Uri 20 36 1776 23.88 0.67 0.023
384 615 1601 6.99 0.45 0.013
160 275 1719 15.07 0.40 0.018
11 97 8834 18.38 0.74 0.021
Zürich 171 1196 6996 9.53 0.64 0.045
Switzerland 2896 7185 2481 14.26 0.215
Number of local
counties Population in 1000s
Average population per
local county (kmAverage surface 2 per county)1
Average education expenditure decentralization over time 2
Aargau Appenzell-Ausserrhoden Appenzell-Innerrhoden Basel-Stadt Basel-Landschaft Fribourg Genève Glarus Graubünden Jura Luzern Neuchâtel Nidwald Obwald Schaffhausen Schwytz Solothurn St. Gallen Ticino Thurgau Vaud Valais Zug
0.55 3
Notes: Decentralization is defined as the ratio between the sum of all local expenditure in a canton and the sum of all local plus cantonal expenditures. 1Based on total surface per canton minus
non-producutive surface (lakes, rock, glaciers). The population data is based on an average between 1997 and 2001. 2Calculated for average education exependiture between 1981 and 1999. 3Average
of the local counties. As in most OECD countries pupils are guaranteed a place in a school within the ‘catchment area’ of residence.10 Furthermore pupils can only attend schools of another area under exceptional circumstances. Education is free for residents of a canton but school fees can be levied for pupils residing outside the canton; 95% of pupils in Switzerland attend public schools.
So as such pupils and parents only have a choice of school via the choice of residence. However unlike the US and the UK where the relative performance of schools across and within areas is well documented and made public, no generalized information of this kind exists in Switzerland. Even if parents get informed through casual observations and experience, no objective evaluation is available which suggests that school quality is not of …rst order importance in residential choice. We return to this point in more detail below. Inspections and auditing of schools is present in all cantonal legislation and is made operational through external inspectors appointed by the central cantonal government.11 They are in charge of training and evaluation of teachers, the supervision of school man-agement, the observation of school curricula, and the use of teaching material, and the inspection of school locations.
2.2. Decentralization in Education Expenditures
As noted above, in Switzerland, responsibility for school-level education divided between the cantons and the local counties, with the federal government playing no role. Thus, a natural measure of decentralization is the degree at which local counties are in charge of public expenditure. We use data from the Swiss Federal Statistical O¢ ce. Our measure of expenditure decentralization in yeart and in canton c; Dct is
Dct =
LEct LEct+CEct
(2.1)
where LEct is the sum of education expenditures in all counties in canton c in year t,
and CEct is he sum of education expenditures at the cantonal level in year t: When all
10See for instance in Appenzell-Ausserrhoden art. 20 Schulgesetz, par 1. (Also in art 20.3 states that
when pupils from another local county attend school than …nancial support can be requested from that county to help in the …nancing of those pupils; in Bern art. 7, Volksschulverordnung (VSV) 432.211; in Freiburg art. 8, Schulgesetz and also "Gesetz über den Mittelschulunterricht"; in Nidwald art. 11 Volkss-chulgesetz (312.1); in St. Gallen art.s 52 and 53 VolkssVolkss-chulgesetz;in Solothurn art. 45, VolkssVolkss-chulgesetz, or in Schwytz art. 32 Verordnung über die Volksschulen.
11For instance see the legislations of the cantons of Thurgau (art 5, 410.1 Unterrichtsgesetz, www.tg.ch),
Valais (Titre 2, Chapitre 1, 400.1 Loi sur l’instruction publique, www.vs.ch), or Zug (art 67, 411.11 Schulgesetz, www.zg.ch)
expenditures are carried out on the local levelDct = 1;and when the cantonal government
is solely in charge of expenditure then Dct = 0:12
For the education sector we see in Table 1 that the average level ofDct in Switzerland is
0.55, that is about half of all expenditure on primary and secondary education in a canton is spent by the local counties. Whereas Basel-City is a very centralized canton along this measure, Obwald is almost entirely decentralized. The last column in Table 1 gives the standard deviation of education decentralization for each canton which re‡ects the variation in decentralization within a canton over time. Two facts can thus be highlighted. First there is su¢ cient time variation ofDct within each canton for meaningful …xed e¤ects
regressions. Second, there is no general discernible time trend in decentralization.
A key question, of course, is what Dct is really measuring. First, in the empirical
literature on …scal decentralization, there is always a concern that …scal indicators may not measure the true autonomy of sub-central government over educational policy decisions. (Ebel and Yimaz(2002)). In the next section, we address this issue in some detail.
2.3. Decentralization and Autonomy
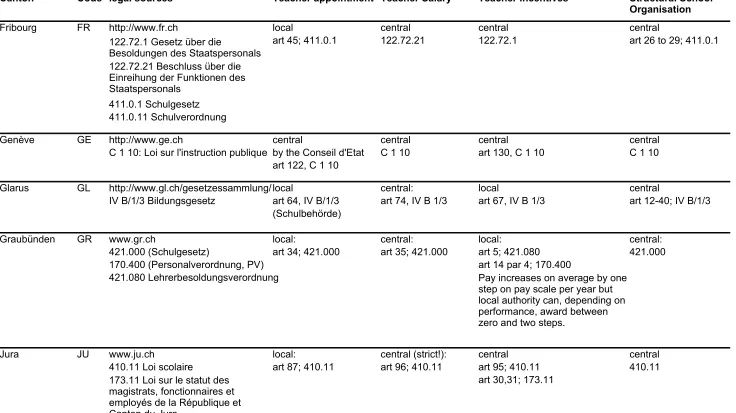
The purpose of this section is to see how actual legislation on local autonomy is related to observed decentralization. As the primary school is always under local and the upper secondary always under central jurisdiction we focus on the delegation of decisions at the lower secondary school. Speci…cally we identi…ed who is in charge of:
appointing teachers,
determining the pay level of teachers,
teachers’incentives
structural school organization.
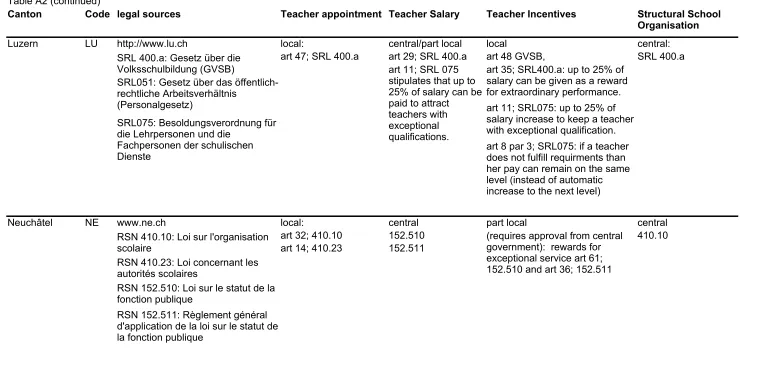
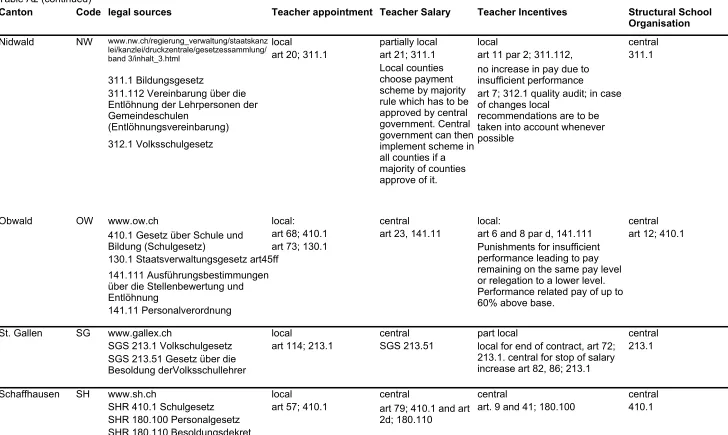
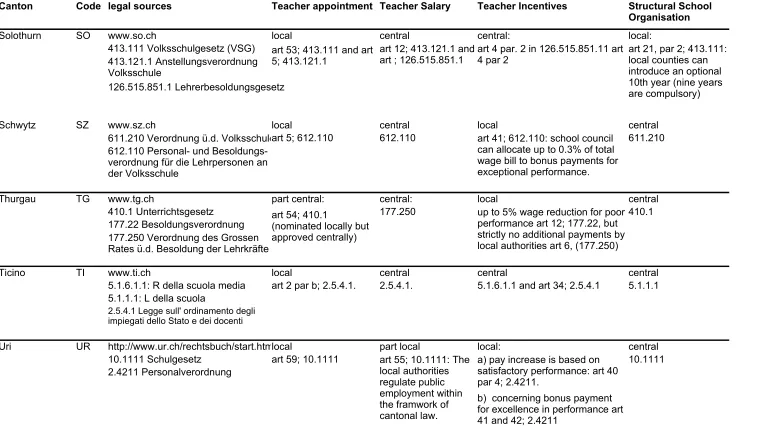
In each of these four aspects of education policy, we made a judgement, based on our reading of legal sources, as to whether the policy was wholly under the control of central (cantonal) government or local government. Table A2 describes in detail the legal sources, and the level of government responsible for each of the four decisions, for each of the 26
12An issue that is raised in the literature on federalism is the transfers across states via the federal
government - or in our context between the cantonal governments and the local counties. In Switzerland, the local counties principally raise their own taxes to cover expenses and the transfers play, in general, a minor role in adjusting living standards across regions.
cantons. The sources relate to current legislation as of August 2003. Where possible each legislations has been traced back to assess if within the sample period there have been changes to these laws; but no evidence for such changes have been found.
To interpret this table, it is probably helpful to go into more detail on the last three dimensions of autonomy. The second dimension asks whether pay can be set at the local level. In most cantons, teachers’ pay is regulated by the law on civil servants. Each teacher is allocated a pay grade (or spinal point) depending on quali…cation, the type of occupation, and work experience. However in a few cantons the local counties can make additional payments to attract teachers or can independently design their own pay systems.
The third dimension of local autonomy concerns the presence of incentive pay set at the local level. Usually teachers, after being hired, are automatically promoted at the beginning of each academic year to the next pay grade (or spinal point). However in some cantons13, this progression can be put to a halt should the performance of teachers be insu¢ cient. Then teachers can either be kept on the same pay level or even relegated to a step further down the salary scale.
The fourth dimension concerns local autonomy in terms of school organization. This does not refer to routine management of schools, but whether local counties can in fact make important structural decisions of some kind. Here we …nd that four cantons can indeed make such choices. In two cantons the local counties can choose between di¤er-ent school models to provide a speci…c level of education (Appenzell-Ausserrhoden and Zürich). In a further two cantons - Solothurn and Valais - local counties can decide whether they want to introduce an additional 10th year of education.14 Finally, the can-ton of Valais entitles the local counties to decide if they want to regroup pupils from di¤erent school years for reasons of e¤ectiveness.
13This form of autonomy is present in the cantons of Appenzell-Ausserrhoden, Glarus, Nidwalden, Zug
and Zurich and to a certain extent (punishment requested by local authority and granted by cantonal government) in Basel-Landschaft. In the canton of St. Gallen teachers can be dismissed by the local counties. Apart from such “sticks,”some cantons allow the local counties to award its teachers “carrots” in the form of performance related pay. This can take on di¤erent forms. In Appenzell-Ausserrhoden, local governments can spend up to 0.2% of their wage bill on performance related pay. In Schwytz local councils can budget a speci…c credit - referred to asSpontanhonorierung (spontaneous reward) - of up to 0.3% of gross total wage pay. If this credit is granted by the local legislative body, school councils can then reward teachers for their exceptional performance. In Zug, local councils are generally also allowed to make such bonus payments.
14Except for these two cantons the presence of the 10th year is regulated by cantonal law and local
counties can not choose to introduce when it is not present or opt out of it when it is.
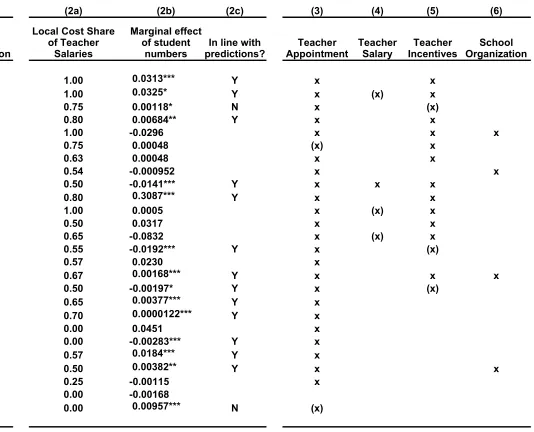
In Table 2 cantons are ranked in descending order in terms of their level of education decentralization de…ned as the sum of local expenditures divided by all education expen-diture, local and central, in a canton. In columns (3) to (6) we show if a canton allows for local autonomy in any of the four types of dimension discussed above. This table reveals an interesting pattern: cantons with high levels of decentralization are more likely to have broader local autonomy. In particular one can see that cantons with more decen-tralization have a higher probability to give their local counties autonomy over teachers’ incentive pay. A simple cross section regression analysis - not reported - makes this point more formally where we regress the average level of decentralization per canton over time on a set of dummy variables equal to one if in a local autonomy is present. Two categories have statistically signi…cant explanatory power: autonomy over teacher appointment and on teacher incentive pay is positively correlated with higher decentralization and over 70% of the variation in decentralization across cantons can be explained by a variation in autonomy.15
We can thus conclude that autonomy is indeed associated with to expenditure decen-tralization in this speci…c context. The question then arises as to why we do not use the four autonomy measures (or some index based on them) directly in regressions below explaining the maturité rate. The answer is simply that the autonomy measures are not time variant and therefore their e¤ects are indistinguishable from canton …xed e¤ects. So, in our regressions below, the e¤ect of …scal decentralization on the maturité rate is iden-ti…ed from the time-series variation inDct:So, it is important to know that this variation
is not just random noise. We now turn to discuss this issue.
2.4. Sources of Variation in Education Decentralization over Time
In this section, we argue that at least part of the time-series variation in Dct can be
explained by variations in school student numbers over time in a canton, and also that variation in student numbers is likely to be independent of the maturité rate.
Note …rst that the local and cantonal components of school education spending can be written by de…nition as:
X
l
LElct LT Sct+LOCct; CEct (1 c)LT Sct+HT Sct+COCct (2.2)
where LT Sct denotes the total teachers’salary bill in primary and lower secondary
edu-15This result is also robust to the introduction of other control variables: cantons that are more
fragmented in the administrative divisions - as measured by the population per local county - do have higher decentralization.
Table 2: Sources of Variation in Education Decentralization
(1) (2a) (2b) (2c) (3) (4) (5) (6)
Canton
0.93 1.00 Y x x
0.89 1.00 Y x (x) x
0.81 0.75 0.00118* N x (x)
0.79 0.80 0.00684** Y x x
0.78 1.00 -0.0296 x x x
0.77 0.75 0.00048 (x) x
0.76 0.63 0.00048 x x
0.75 0.54 -0.000952 x x
0.74 0.50 -0.0141*** Y x x x
0.73 0.80 Y x x
0.71 1.00 0.0005 x (x) x
0.68 0.50 0.0317 x x
Uri 0.67 0.65 -0.0832 x (x) x
0.66 0.55 -0.0192*** Y x (x)
0.66 0.57 0.0230 x
Zürich 0.64 0.67 Y x x x
0.63 0.50 -0.00197* Y x (x)
0.50 0.65 Y x
Bern 0.48 0.70 Y x
0.45 0.00 0.0451 x
0.45 0.00 -0.00283*** Y x
0.44 0.57 Y x
0.40 0.50 Y x x
0.37 0.25 -0.00115 x
0.15 0.00 -0.00168
0.01 0.00 N (x)
Education Decentralization
Local Cost Share of Teacher
Salaries
Marginal effect of student
numbers predictions?In line with AppointmentTeacher Teacher Salary IncentivesTeacher OrganizationSchool
Obwald 0.0313*** Nidwald 0.0325* St. Gallen Schwytz Appenzell-Ausserrhoden Thurgau Graubünden Solothurn Zug Appenzell-Innerrhoden 0.3087*** Luzern Glarus Neuchâtel Schaffhausen 0.00168*** Basel-Landschaft Fribourg 0.00377*** 0.0000122*** Jura Vaud Ticino 0.0184*** Valais 0.00382** Aargau Genève
Basel-Stadt 0.00957***
cation (lower-school) in cantoncat time t; HT S denotes the total teachers’salary bill in higher secondary education (higher-school) in cantoncat timet;and …nallyLOCct; COCct
denote other education costs incurred at local and cantonal level which may be a function of the number of students.
These formulae describe several important stylized facts of the Swiss context. First, in all cantons, the cost of teachers’ salaries at the lower level are shared between local counties and the canton. In particular, the share c varies across cantons but is …xed
over time during our sample period16: it is given for all cantons in column (2a) of Table 2. Note that there is quite a lot of cross-section variation in c: for example, in the
canton Obwald the full cost of teacher salaries is …nanced at the local level, whereas in Zürich 67% of the cost is borne by the local counties and …nally in Geneva all costs are covered by the central government. Second, the cost of cost of teachers’ salaries at the higher secondary level is paid entirely by cantonal government. Third, all other costs are shared between local and cantonal government. We do not have details on the sharing of other costs, but we do know that other costs in the aggregate are relatively unimportant compared to teachers’salaries - the latter comprise 50-70% of spending in the aggregate (Plotke, 1979, 2003)
Note that (2.1) and (2.2) must explain fully the variation over time in the decentral-ization indicator, in particular,
Dct
cLT Sct+LOCct
LT Sct+HT Sct+LOCct+COCct
(2.3)
This shows that mathematically, variation over time in the indicator must come from either (i) ‡uctuation in lower-school teacher salaries LT Sct; (ii) ‡uctuation in local and
central other costs, and (iii) cantonal expenditure on higher-school teacher salaries and other costs which may be related to the number of students.
Moreover, as the cost of lower-school teacher salaries is shared between the central and the local governments in a …xed ratio, a change in the number of teachers in a canton generically induces a change in the degree of decentralization. Indeed when the local cost share c in a canton is higher (lower) than the degree of decentralization, > Dct; then
more teachers leads to a subsequent increase (decrease) in the level of decentralization17.
16These local shares do not vary over time for the sample period. Legal sources for this data are
available from the authors.
17For example in the canton of Fribourg where on average the degree of decentralization is 0.50 and
the local cost share is 0.65 an increase in the number of teachers leads on average to an increase in decentralization whereas in Zug, where decentralization is at 0.74 and the local cost share is 0.50, more teachers leads to lower decentralization.
Mathematically, from (2.3):
@Dct @LT Sct
= Dct
LT Sct+HT Sct+LOCct+COCct
Thus the foremost source of year-to-year variation of decentralization in a canton is in-duced by changes in the number of teaching personnel and their compensations.
Second, all cantons regulate the class sizes for all school levels by imposing minimum and maximum class sizes.18 When a class in a school goes above or below these thresholds
readjustments are made either by relocating students to other classes within the same school or across nearby schools. So, ultimately changes in student numbers in a canton will lead to straightforwardly changes in teacher salary costs (though cantons have the discretion to adjust to changes in student numbers19 by hiring more part-time teachers
or not renewing their contracts, or hiring new full-time permanent teachers). Thus, in principle, an important source of variation in the variableLT Sct over time is variation in
the size of the student population in canton cover time.
This shows up in our data. We can also establish empirically that there is a positive relationship between student numbers and the level of decentralization in those cantons where the local cost shares in teacher salaries is higher than the level of decentralization. As the level of expenditures on education other than salaries varies across cantons the e¤ect of changes in student numbers on the level of decentralization will vary, too. Fur-thermore changes in student numbers may entail other expenditures that are …nanced by the local or the cantonal governments depending on each canton. As we do not disaggre-gated data decompose expenditure types within the education category we follow a more general approach by estimating;
Dct =
P
c cFc +
P
c c(Fc Sct) + ct (2.4)
where Fc are canton dummies which model …xed e¤ects in the level of decentralization
andSct are the student numbers in a canton and year which is interacted with the canton
…xed e¤ects Fc: As no intercept is present in this model, the c measure the e¤ect of
changes in the number of students separately for each canton. The prediction is that the coe¢ cient c is positive (negative) when the local cost shares are higher (lower) than the
level of decentralization. We estimated this model and report the c coe¢ cients in column
(2b) of Table 2.
18For reasons of space the legal sources have been omitted but are available upon request.
19It can be argued that schools have di¤erential incentives to exhaust the possibilities of adjusting
classes through relocating students rather than by hiring more teachers if they have to face more of the …nancial burden themselves when the cost shares are high. We return to this point in section 4.6.
As can be seen the coe¢ cient has the predicted sign in 13 cantons, in 11 cantons the coe¢ cient is insigni…cant and but in 2 cantons is the coe¢ cient of the opposite sign than predicted. Thus we …nd broad empirical support that changes in student numbers induce changes in the level of decentralization.
The question then arises as to whether over time, changes in student numbers in a can-ton over have any additional power in explaining the maturité rate, over and above their e¤ect onDct:This is investigated in the next section, where we study the determinants of
the maturité rate. Column 7 of Table 3 below shows that for our preferred speci…cation, which obviously includes the variableDct;student numbers has no signi…cant e¤ect on the
maturité rate. This insigni…cance seems to be quite robust across a number of di¤erent speci…cations (details on request).
This …nding is also consistent with the fact that in Switzerland - in contrast to the U.K. or the U.S.A. - there is no school level or even canton level ranking of schools that are made available to students, parents, or teachers which would allow them to update over time their information about school quality. Thus parents, for instance, do not have yearly updates on school performance on which they can base their decision where to move to enrol their children20. So, we would not expect student numbers to vary directly with the maturité rate.
3. Decentralization and Educational Attainment
3.1. Empirical Strategy and Data
We now turn to an econometric estimation of the relationship between decentralization and e¢ ciency of public good provision in the educational sector. We will approach the estimation with a panel data set of 26 Swiss Cantons over the period 1982-2000. We have for each canton yearly observations on …scal decentralizationDct, a measure of educational
output, the maturité rateEct;and various input measures. All these variables are de…ned
in Table A1 and are discussed in more detail below.
We estimate the e¤ect of decentralization in canton c in year t; on the educational attainmentEct with
Ect = c+ t+ D t 1;t k
ct + X
t 1;t k
ct +uct: (3.1)
20There may well be time-invariant di¤erences across schools due to historic di¤erences in the level of
development across cantons which parents are aware of. Yet, these permanent di¤erences are controlled for by …xed-e¤ects.
All variables are converted into natural logarithms. The variable Dtct1;t k contains a measure of the degree of decentralization that a¤ected a cohort in period t in canton c
over the pastk periods. This allows to capture the e¤ect a cohort of students experienced over their whole schooling career. Speci…cally in the regression we will model Dctt 1;t k by
Dctt 1;t k = Dct 1+:::+Dct k
k ; (3.2)
i.e. as a moving average of the pastk periods.21 The next section will varyk to …lter out
the appropriate speci…cation. In particular we will identify separately the e¤ect during the whole schooling career, i.e. during the past 12 years, and separately from the e¤ect during the post-compulsory upper-secondary education, i.e. during the past 5 years, and during the primary and lower secondary education period, i.e. during the …rst seven years of education.
Similarly the vectorXctt 1;t k contains moving averages of the pastkperiods of further control variables capturing the quality of the human resources, schooling infrastructure, and per student expenditure. Finally care canton and tare year …xed e¤ects anductare
unobservable disturbance terms clustered at the cantonal level. The precise speci…cation of uct will be explained and discussed below.
So, (3.1) can be interpreted as a canton-level production function relating educational "output" Ect to "inputs" Xctt 1;t k and the decentralization indicator (3.2). So a
posi-tive sign for coe¢ cient indicates that increased …scal decentralization leads to greater "output" for given "inputs" i.e. implies greater productive e¢ ciency.
The main22 output variable E
ct is the Maturité rate which is the number of students
who obtain the university entrance level quali…cation de‡ated by the size of the 19 year old population. Overall in Switzerland in 2000 17% of the 19 year old population obtained the Maturité which entitles them to attend university. This level of education is four to …ve years beyond the compulsory level of education in Switzerland. Numerous studies have shown how students who obtain this level of education have higher future income, better choice of jobs and subjective well-being.
Turing to choice of input variables, there is a vast literature on the economics of education that concentrates on the question as to which input measures a¤ect educational attainment (Hanushek, 1997 and 2003). Our choice of variables is constrained by data
21We also allowed discounting values further in the past which yield similar results.
22However, not all students who continue their education at the upper secondary school level, i.e.
beyond compulsory education, attend schools that provide theMaturité, but rather attend professional schools that also lasts four to …ve years past compulsory schooling. In the next section we will also address the e¤ect of decentralization onprofessional school degrees.
availability but includes such standard variables such as class size and expenditure per student at primary and secondary school level excluding tertiary education. To capture the e¤ect of the social composition of the student population we have the proportion of students whose …rst language is di¤erent to the language of instruction: on average 16% of students are not instructed in their …rst language. By this we want to control for the fact that more foreign students can reduce the educational attainment of a cohort as they may be more di¢ cult to teach due to the language barrier; in a way we thereby capture the quality of the input factor.
Of course, many other covariates contribute to the level of educational attainment of a speci…c individual student, such as neighborhood characteristics. However the focus of this paper is to identify the e¤ect of the level of decentralization, which is measured at the cantonal level, and as such the identi…cation and the bias of that coe¢ cient is not sensitive to the omission of individual level data (Hoxby (2000)).
3.2. Regression Results
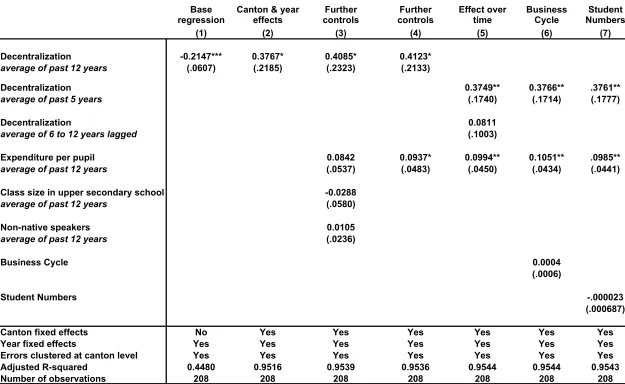
Table 3 turns to a set of panel regressions. In the …rst column we report a …rst cut at the data regressing the educational attainment among the 19 year old population in a year as a function of decentralization during the past 12 years, i.e. the average e¤ect of exposure to variations in decentralization during the time this cohort spent in school. This regression is thus in the spirit of cross section regressions that ignore the problem of omitted variable bias induced by unobserved heterogeneity (Bardhan 2002). There is a signi…cant negative correlation between decentralization and educational attainment. However this can be due to omitted factors that are speci…c to a region. The importance of this omitted variable bias is revealed when we add canton and year …xed e¤ects in column (2). Note that now the coe¢ cient is signi…cantly positive at the 10% level. This illustrates that it is not innocuous to ignore the potential for unobserved heterogeneity stemming from historical or cultural di¤erences that are correlated with the degree of decentralization. This can explain why in some studies using cross-section regressions a negative correlation has been found.
In column (3) we introduce our set of control variables. Per pupil expenditure, class size,23 and the share of non-native speakers are not related to educational attainment.
The coe¢ cient on educational expenditure has the expected positive sign just as larger classes are related to lower educational attainment. When we omit the least signi…cant
23This refers to total expenditure, local and central, per pupil. Equally, class size refers to cantonal
yearly averages. Note that the e¤ect is estimated only by the variation within a canton over time.
Table 3 – Decentralization and Educational Attainment in Swiss Cantons
Robust standard errors reported in parentheses, allowing for clustering at canton level
(1) (2) (3) (4) (5) (6) (7)
Decentralization -0.2147*** 0.3767* 0.4085* 0.4123* average of past 12 years (.0607) (.2185) (.2323) (.2133)
Decentralization 0.3749** 0.3766** .3761**
average of past 5 years (.1740) (.1714) (.1777)
Decentralization 0.0811
average of 6 to 12 years lagged (.1003)
Expenditure per pupil 0.0842 0.0937* 0.0994** 0.1051** .0985**
average of past 12 years (.0537) (.0483) (.0450) (.0434) (.0441)
Class size in upper secondary school -0.0288
average of past 12 years (.0580)
Non-native speakers 0.0105
average of past 12 years (.0236)
Business Cycle 0.0004
(.0006)
Student Numbers -.000023
(.000687)
Canton fixed effects No Yes Yes Yes Yes Yes Yes
Year fixed effects Yes Yes Yes Yes Yes Yes Yes
Errors clustered at canton level Yes Yes Yes Yes Yes Yes Yes
Adjusted R-squared 0.4480 0.9516 0.9539 0.9536 0.9544 0.9544 0.9543
Number of observations 208 208 208 208 208 208 208
Dependent variable = Share of 19 year old population obtaining university entry qualification (Maturité rate)
Base regression
Canton & year effects
Further controls
Further controls
Effect over time
Business Cycle
Student Numbers
variables, class size and foreign language speakers, we …nd that expenditure per student is signi…cant at the 10% level. Most notably however is that even after controlling for this last set of variables we …nd that decentralization is positively related to educational attainment.
So far the right hand side variables are the moving averages of the past 12 years, i.e. Dctt 1;t 12 and Xctt 1;t 12:In column (5) we identify separately the e¤ect of changes in decentralization during the last 5 years of schooling, i.e. during the post-compulsory education at the upper secondary school, from the e¤ect of changes during the …rst seven years of schooling;
Ect= c + t+ 1D t 1;t 5
ct + 2D
t 6;t 12
ct + X
t 1;t 12
ct +uct: (3.3)
We …nd that it is in fact the changes in decentralization experienced during the last …ve years of education that matter. The coe¢ cient 1 is signi…cant at the 5% level but
2 is not signi…cant. The coe¢ cient on expenditure per student remains signi…cant at the
5% level.
Looking at column (5) of Table 3, our preferred speci…cation, we see that if decen-tralization increased by ten percentage points it leads to a 4% higher share of 19 year olds obtaining the Maturité. This e¤ect is quite large given that a one standard deviation increase in expenditure is only associated with 12% of a standard deviation increase in educational attainment.24 A further concern are local business cycles which could drive educational attainment directly thus making our estimates of 1 biased. We thus
con-structed a measure of the local business cycle by taking the cyclical component of per capita GDP per capita using the using the Hodrick and Prescott (1997) …lter. As can be seen in column (6) of Table 3 the coe¢ cient of decentralization is robust and the coe¢ cient on our business cycle measure is not signi…cant.
3.3. Economies of Scale
It has often been argued that one crucial advantage of centralized provision of public goods is that it can bene…t from economies of scale in the production process of public goods: it may be more e¢ cient to focus the design, implementation, and maintenance of public goods in one place rather than have several jurisdictions simultaneously engage in the same production process. To assess if this claim holds in our context we proxy for the scope for economies of scale in two ways.
24Calculated as(0:0994 0:1805)=0:151 = 0:1188
First we by look at the number of jurisdictions in a canton.25 We thus estimate the following model:
Ect= c + t+ D t 1;t 5
ct + (D
t 1;t 5
ct Jc) + Xctt 1;t 12+uct: (3.4)
The variableJc measures the number of jurisdictions in a canton. Note that even though
the number of jurisdictions is time-invariant, the interaction term is identi…ed by the time-series variation in Dct. The idea of estimating the interaction term is to capture
scale economies that are not a function of population size but only driven by the number of administrations in a canton. This is arguably a plausible measure of economies of scale as an important part of administration takes place at the school level whose size is determined by local factors and is di¢ cult to vary. The empirical prediction is that the interaction term is negative, i.e. < 0: decentralizing is more e¢ cient when there are fewer jurisdictions involved in the process. Among the Swiss cantons the number of jurisdictions varies considerable between 3 in Basel-Stadt and 400 in Bern. In Table 4 column (1) we report results using the same sample as in Table 3. We restrict the speci…cation to those variables that were signi…cant in Table 4, column (5). As can be seen the coe¢ cient on the interaction term is negative and signi…cant at the 5% level. The coe¢ cient on decentralization 1 now increases to 0:6: This is mainly due to the
presence of the interaction term: the mean number of jurisdictions is 111 in the data set and therefore the average e¤ect of decentralization is 0:4426. Increasing the number of jurisdictions by 50 reduces the e¤ect of decentralization on education by 0.1. Thus there is strong evidence that economies of scale have a strong positive impact in the context of decentralization.
A second measure of economies of scale is to look at the average population size per local jurisdiction. This measure captures those aspects of scale economies that are a function of population size. We …nd no evidence, as reported in column (2) of Table 4, for a di¤erential e¤ect of decentralization when the population per local county changes.
3.4. Local Cost Shares
We now want to explore if di¤erential incentives are induced by variations in the local cost shares of teacher salaries. One could argue that a highly decentralized canton with a low
25An alternative measure is to use population per jurisdiction which yields qualitatively similar results
to the one presented in Table 6. Similarly the estimated e¤ect is robust to the inclusion of population size as an additional control variable.
26Calculated as0:6619 111 0:00199:
Table 4 – Decentralization, Economies of Scale, Local Autonomy, and Budgetary Competence
Robust standard errors reported in parentheses, allowing for clustering at canton level
(1) (2) (3) (4)
Decentralization 0.6619** 0.3920** 0.6380** 0.6356**
average of past 5 years (.2547) (.1776) (.2655) (.2647)
Decentralization x Number of local jurisdictions -0.00199** -0.0017* -0.0017*
average of past 5 years (.00088) (.0010) (.0010)
Decentralization x Average population per local jurisdiction -0.0163
average of past 5 years (.0304) Decentralization x Dummy =1 when teacher incentives
decided at local level
average of past 5 years
Decentralization x Smoothed budget surplus at local level 0.0212** 0.0208**
average of past 5 years (0.0097) (0.0097)
Decentralization x Smoothed budget surplus at cantonal level 0.0021 0.0021
average of past 5 years (0.0046) (0.0046)
Expenditure per pupil 0.1080** 0.1097** 0.1040** 0.1061**
average of past 12 years (.0427) (.0427) (.0427) (.0410)
Business Cycle 0.0001
(0.0004)
Canton fixed effects Yes Yes Yes Yes
Year fixed effects Yes Yes Yes Yes
Errors clustered at canton level Yes Yes Yes Yes
Adjusted R-squared 0.9554 0.9544 0.9562 0.9562
Number of observations 208 208 208 208
Dependent variable = Share of 19 year old population obtaining university entry qualification (Maturité rate)
Number of local jurisdictions
Population size per
jurisdiction CompetenceBudgetary Business Cycle
cost share may be more willing to make policy changes to improve educational attainment given that it will only partially have to bear the …nancial consequences of their decisions. Equally, a canton that has a high degree of decentralization but also a high local cost share may be less willing to implement changes as they will have to cover more of the …nancial cost. To see if there is empirical support for this argument we introduce an interaction term between the level of decentralization in a canton, Dctt 1;t 5;and the local cost share LCc;27:
Ect = c+ t+ D t 1;t 5
ct + (D
t 1;t 5
ct LCc) + X
t 1;t 12
ct +uct: (3.5)
If a high local cost share would indeed inhibit the gains from decentralization then the the coe¢ cient on interaction term would be negative. As can be seen, however, in column (3) of Table 4 the coe¢ cient on the interaction term is negative but not signi…cant and moreover, when evaluated at the mean level of the interaction term, the coe¢ cient on decentralization remains the same. Thus the e¤ect of more decentralization is not a¤ected by how much the local governments have to contribute to the …nancing of their policies.
3.5. Decentralization and Budgetary Competence
A further criticism of decentralization is that the competence of local politicians standing for election may be lower than those standing for positions in the central government. This may be due to the fact that holding an o¢ ce at the local government is less prestigious than at the central government. These issues can be particularly acute in the context of developing countries, as discussed in Bardhan (2002), where the competence of local public o¢ cials is often low. To assess this second argument we follow the methodology in Galiani and Schargrodsky (2001). In that paper, competence of a government is proxied by the size of the budgetary surplus. Low or negative surplus, i.e. de…cit, is interpreted to be associated with less competent governments. In contrast to Galiani and Schargrodsky (2001) we have data not only on the level of budgetary surplus at the central but also at the local level. To assess the e¤ect of decentralization jointly with the level of competence we estimate the following model:
Ect = c+ t+ D t 1;t 5
ct + L(Dtct1;t 5 SLct)+ C(Dctt 1;t 5 SCct)+ Xctt 1;t 12+uct (3.6)
Here SLct measures the budgetary surplus of all local governments in a canton as a
percent of cantonal GDP;SCct measures the budgetary surplus of thecentral government
27Recall that the level of local cost share only varies across cantons but is …xed across time.
as a percent of cantonal GDP. Thus L measures the e¤ect of decentralizingtowards local
governments with a relatively high level of competence and C measures the e¤ect of
decentralizingaway from a central government with a relatively high level of competence. Note that we continue to control for canton …xed e¤ects which holds …xed levels of de…cits that are determined by the …nancing structure in a canton. As there is a strong cyclical component in the budget data we …rst smoothed the underlying budget de…cit data series using the Hodrick and Prescott (1997) …lter.
In column (3) of Table 4 we report regression results on examining budgetary com-petence. We see that L is signi…cantly di¤erent from zero and positive and C is
in-signi…cant. This is evidence that decentralizing towards a competent local government, increases the gains from expenditure decentralization. In column (4) we add a measure of canton level business cycle to address a potential further omitted variable bias. We measure the business cycle as the cyclical part of the per capita GDP in a canton using the Hodrick and Prescott (1997) …lter. The results also remain the same if do not control for business cycles directly or in the underlying budget data. Thus there is evidence that decentralization is more e¤ective when the local government is incompetent. This result gives support to the notion that competence - even in a developed country like Switzerland - needs to be taken into account when deciding on the degree of decentralization.
3.6. Adverse E¤ects of Decentralization
So far we have found evidence that decentralization is associated with better educational attainment as measured by Maturité rates. It is important, however, to test if these gains were accompanied by losses along other dimensions. We focus on two types of adverse e¤ects.
3.6.1. Gender
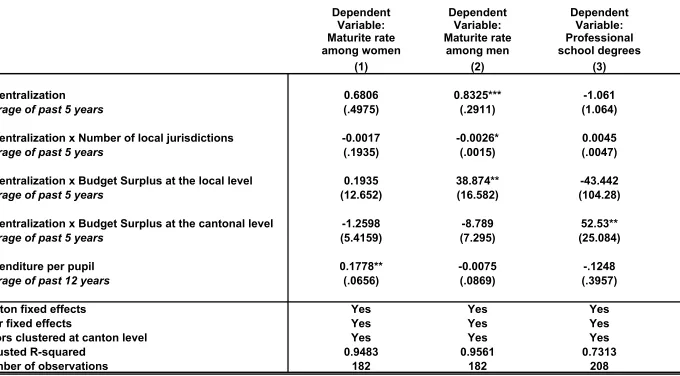
First, we ask is these gains in educational attainment are gender speci…c, i.e. if the gains to one gender has been accompanied by losses for the other. There are various reasons why decentralization leads to more targeted outcomes. If decentralization is increasing responsiveness to the median voter in each region then the preferences of this voter will change the policy choice. Central governments on the other hand are argued to be more able to redistribute gains to minority interests that are less well represented at the local level. In the case of Switzerland, there are more women than men obtaining the Maturité as a share of 19 year old female and male population respectively. Table 5 presents panel regressions where now the dependent variable is the Maturité rate among women in column
Table 5 – Any Adverse Effects of Decentralization?
Robust standard errors reported in parentheses, allowing for clustering at canton level
(1) (2) (3)
Decentralization 0.6806 0.8325*** -1.061
average of past 5 years (.4975) (.2911) (1.064)
Decentralization x Number of local jurisdictions -0.0017 -0.0026* 0.0045
average of past 5 years (.1935) (.0015) (.0047)
Decentralization x Budget Surplus at the local level 0.1935 38.874** -43.442
average of past 5 years (12.652) (16.582) (104.28)
Decentralization x Budget Surplus at the cantonal level -1.2598 -8.789 52.53**
average of past 5 years (5.4159) (7.295) (25.084)
Expenditure per pupil 0.1778** -0.0075 -.1248
average of past 12 years (.0656) (.0869) (.3957)
Canton fixed effects Yes Yes Yes
Year fixed effects Yes Yes Yes
Errors clustered at canton level Yes Yes Yes
Adjusted R-squared 0.9483 0.9561 0.7313
Number of observations 182 182 208
Dependent Variable: Maturite rate among women
Dependent Variable: Maturite rate
among men
Dependent Variable: Professional school degrees
(1) and the Maturité rate among men in column (2).28 For the case of female educational attainment, decentralization has a positive e¤ect but it is not statistically signi…cant. Only expenditure is signi…cantly related to the female Maturité rate. In column (2) we repeat the same exercise but now for male students only. Here decentralization has a strong and signi…cant e¤ect on men; equally the economy of scale a¤ect and the budgetary competence e¤ect only comes into play for male students but not for female students. Given that the gains have accrued more to men than to women we also estimated a gender education gap model - not reported but available on request - where we do indeed …nd some evidence that decentralization reduced the gender gap in education.
3.6.2. Professional degrees
Second, we assess if the gains in terms of Maturité rates has been accompanied by a decline at other degrees. Among post-compulsory education the modal group of students attends professional schools rather than Maturité schools. For instance in 2000 17% of 19 year old students obtained the Maturité but 57% obtained a degree from a professional school. In column (3) of Table 5 we estimate a model where the dependent variable is the share of 19 year olds that obtain a degree from a professional school. We …nd that decentralization had no e¤ect on that level of education.
In summary, we …nd no evidence for adverse e¤ects of decentralization. More local expenditure is associated with better education among men but that has not been to the detriment of education among women and we …nd evidence that is reduced the gender gap in education for the Maturité. Similarly other degrees like those obtained from professional schools are not related to decentralization. Therefore it seems that decentralization is associated with a net gain in terms of educational attainment.
4. Conclusions
We investigated the empirical evidence on the relationship between decentralization and the e¢ ciency of public good provision. As a …rst step we looked at the current legislation in the Swiss cantons to provide careful evidence on the positive relation between expen-diture decentralization and local autonomy in decision, and also describing the sources of variation in expenditure decentralization over time. We then proceeded to panel regres-sions of data from Swiss cantons for the last 20 years. We saw that even after controlling
28The sample is somewhat smaller as educational attainment by canton and gender is not available for
the year 2000.
for other input variables the degree of decentralization is positively related to educational attainment. We take this to be novel and consistent evidence that contradicts earlier cross-section …ndings that decentralization worsens governance (Treisman, 2002). Indeed it is the quality of data and the correct speci…cation of the model that helps to uncover the precise e¤ect of decentralization on the e¢ ciency of public good provision.
We also …nd evidence that expenditure decentralization is more bene…cial when central governments are less competent. These results shed new light on the empirical relevance of decentralization and the conditions under which it can attain its often claimed aim of improving the e¢ ciency of public good provision. Future research should aim to further re…ne the institutional details under which decentralization is bene…cial and to also take the data to a micro level to see which people bene…t or lose most and under what conditions from decentralization.
References
[1] Alesina, A. and E. Spolare (1997), “On the Number and Size of Nations,”Quarterly Journal of Economics, 112, 1027-56.
[2] Azfar, O., S. Kahkonen, and P. Meagher, (2001) “Conditions for E¤ective Decen-tralised Governance: A Synthesis of Research Findings,” IRIS Center, University of Maryland.
[3] Bardhan, P. (2002). “Decentralization of Governance and Development,”Journal of Economic Perspectives, 16(4), Fall.
[4] Bardhan, P. and D. Mookerjee (2000), “Capture and Governance at Local and Na-tional Levels,”American Economic Review, 90(2), 135-139.
[5] Bordignon,M, Colombo, and Galmarini (2003), "Fiscal Federalism and Endogenous Lobbies’Formation", CESIfo Working Paper 1017
[6] Bordignon,M F.Cerniglia, and R.Revelli (2004), "Yardstick Competition in Intergov-ernmental Relationships: Theory and Empirical Predictions",Economics Letters 83, 325-333
[7] Besley, T. and S. Coate (2003), “Centralised vs. Decentralised Provision of Public Goods: a Political Economy Analysis,”Journal of Public Economcs, forthcoming.