http://go.warwick.ac.uk/lib-publications
Original citation:
Dutton, B., et al. (2010). Defect feature extraction using surface wave interactions and time-frequency behavior. AIP Conference Proceedings, 1211(1), pp. 647-654.
Permanent WRAP url:
http://wrap.warwick.ac.uk/5146 Copyright and reuse:
The Warwick Research Archive Portal (WRAP) makes the work of researchers of the University of Warwick available open access under the following conditions. Copyright © and all moral rights to the version of the paper presented here belong to the individual author(s) and/or other copyright owners. To the extent reasonable and practicable the material made available in WRAP has been checked for eligibility before being made available.
Copies of full items can be used for personal research or study, educational, or not-for-profit purposes without prior permission or charge. Provided that the authors, title and full bibliographic details are credited, a hyperlink and/or URL is given for the original metadata page and the content is not changed in any way.
Publisher’s statement:
Copyright (2010) American Institute of Physics. This article may be downloaded for personal use only. Any other use requires prior permission of the author and the American Institute of Physics.
The following article appeared in Dutton, B., et al. (2010). Defect feature extraction using surface wave interactions and time-frequency behavior. AIP Conference Proceedings, 1211(1), pp. 647-654, and may be found at http://dx.doi.org/10.1063/1.3362455.
A note on versions:
The version presented here is a working paper or pre-print that may be later published elsewhere. If a published version is known of, the above WRAP url will contain details on finding it.
DEFECT FEATURE EXTRACTION USING SURFACE WAVE
INTERACTIONS AND TIME-FREQUENCY BEHAVIOR
B. Dutton, M. H. Rosli and R. S. Edwards
Department of Physics, University of Warwick, Coventry, CV4 7AL, UK
ABSTRACT. In this paper we exploit the interaction of ultrasonic surface waves with surface cracks in order to extract defect characteristics. An experimentally validated computer model was developed to simulate laser generated surface waves interacting with defects of several depths and angles. The Rayleigh reflection coefficient vs. crack angle and depth was explored. Amplitude and frequency behaviour at the defect interface in aluminium samples was also considered. Additionally, the phase component of the FFT was used to extract similar information. Finally, we explore the time-frequency behaviour using the Wigner transform.
Keywords: Defect Characterization, SAW, Rayleigh, Laser Ultrasound, Ultrasound Modelling PACS: 43.20 +g, 43.55.Ka, 81.70.Fy
INTRODUCTION
Surface cracks can have catastrophic consequences if they are not detected in a timely manner; in pipelines, railway lines, etc., small surface cracks can grow and cause a major disaster. A rail disaster caused by multiple surface-breaking cracks (rolling contact fatigue, RCF) occurred in 2000 at Hatfield, UK [1]. By characterizing and dealing with these cracks in a timely manner before they become critical, these accidents may be avoided.
Real cracks can grow at small angles to the surface; see, for example, RCF which grows at an angle of around 25º to the surface. It is therefore important to understand the behaviour of surface waves when they interact with defects of different angles and depths. For the purpose of this research we consider the use of non-contact ultrasound. Rayleigh waves are extremely useful for characterizing surface cracking [2-13], with an amplitude attenuating as r-1/2, compared to r-1 for bulk waves, allowing measurements over a longer distance [14]. The particle motion is elliptical, with the out-of-plane (OP) component at the surface approximately 1.6 times the in-plane (IP) for aluminium [15]. We explore the Rayleigh wave interaction with surface defects, primarily considering the OP motion, using laser-ultrasound experiments and a 3D Finite Element Method (FEM) model.
3D FEM MODEL
FIGURE 1. Model and sample geometry details. d was kept constant with angle varied. Dimensions in mm.
boundaries. Models were generated with a fixed crack length, d, and crack angles, measured from the top surface, ranging from 10º to 170º; this was done for d = 1, 2, 3 and 4 mm (see Figure 1).
To validate our model, a comparison was made with an experimentally acquired Rayleigh wave from an aluminium sample without any defects, of dimensions 50x50x150 mm. Lasers were used to both generate and detect ultrasound, with generation in the thermoelastic regime. The laser beam was first expanded using a concave lens, and then focused into a line using a cylindrical lens. By focusing into a line, the generated ultrasound is enhanced in a preferable direction which is perpendicular to the line [18], and also increases the frequency content of the surface waves generated [19]. An adapted Michelson interferometer was used to detect out-of-plane displacements, with a sensitivity of 10s of pm, spatial resolution of approximately 50 µm and a bandwidth of 80 MHz. The laser source and detection were 21 mm apart, and the central Rayleigh wavelength was approximately 2 mm. The top surface of the sample was polished in order to use the Michelson interferometer. 64 averages were used to reduce noise.
Modelled and acquired waves are compared in Figure 2, where the solid line is model and dashed line experimental data. On the left hand side of the dashed curve is the radio frequency (RF) noise created by the laser high voltage power supply. In both traces P is a surface skimming longitudinal wave, and the large pulse to the right is the Rayleigh wave. Reasonable agreement of the Rayleigh shape is shown. There is also a very good agreement with the calculated arrival times for both P and Rayleigh waves. This model was also used to explore Rayleigh wave interaction with cracks.
RAYLEIGH REFLECTION COEFFICENTS
We first explore the effect that crack angle and depth have on the Rayleigh amplitude reflection coefficient, for both model and experimental data. Models were
FIGURE 2. Model validation using surface wave generation, comparing model with experimental data.
Crack detail
d (1 to 4) 4
θ 0.5
Al
Top Symmetry axis
P
Rayleigh
Wave Calculated
arrival time (µs)
P 3.33
Rayleigh 7.14
LL 16.22
LS/SL 24.48
SS 32.86
[image:3.612.136.448.57.144.2] [image:3.612.145.429.558.712.2]FIGURE 3. Scanning detection laser arrangement. All dimensions in mm.
generated with defects with angles ranging from 10º to 170º and depths from 1 to 4 mm. The dimensions were chosen such that bulk acoustic waves (BAW) would not arrive at the same time and hence interfere with the Rayleigh wave, using calculated wave arrival times. Several aluminium experimental samples were made with cracks at different angles to the top surface, from 30º to 150º, and a fixed length, d, of 2 mm. The scanning laser detection arrangement is shown in Figure 3, using lasers to both generate and detect ultrasound. The laser generation point was kept at a fixed position; the Michelson interferometer was scanned across the defect starting at more than 10 wavelengths from the laser source, and over 3 wavelengths from the defect.
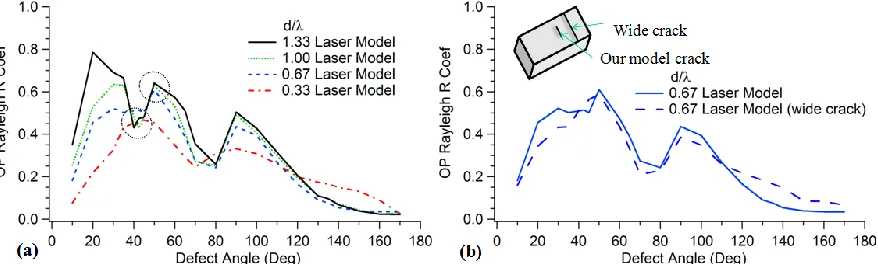
For the OP component, reflection coefficients were calculated from the data by comparing the amplitude of a reflected Rayleigh wave with that of the Rayleigh wave passing directly from source to detector. Figure 4(a) shows the model and experimental reflection coefficients for a crack depth to central wavelength ratio of d/λ=1.00, showing very good agreement. Additionally, in Figure 4(b), we compare our model output for d/λ = 1.33 with a previous semi-analytical model for an angled wedge (effectively a crack of infinite depth, across the whole face of the sample) [20], showing similar behaviour despite the very different depths; the OP component of the Rayleigh wave reduces significantly by one wavelength below the sample surface.
[image:4.612.80.509.572.704.2]To study the reflection coefficient behaviour as a function of angle and crack depth a range of depths were modelled, with the OP Rayleigh reflection coefficients shown in Figure 5(a); the reflection coefficient, for the most part, increases with d/λ, which agrees with the intuitive expectation that the deeper the crack the larger the reflection. The change in the peak and valley pattern (shown by circles) between d/λ=0.33 and 0.67 is to be investigated in more detail. An additional model was created which had a crack across the whole face of the sample, rather than being of finite width, to look at the edge diffraction effect that may be occurring. A comparison of both is shown in Figure 5(b), showing good agreement.
FIGURE 4. OP Rayleigh reflection coefficient vs. crack angle for (a) model and experiments for d/λ=1.00; (b) comparison of model for d/λ=1.33 and previous model for d/λ=infinite [20].
Al sample Laser line source
(fixed) Michelson det. (scan)
150 50
50
FIGURE 5. Modelled OP Rayleigh reflection coefficient vs. crack angle for (a) 4 different depth cracks of finite width; (b) comparison with crack across the whole face for d/λ=0.67.
ENHANCEMENT AT A DEFECT
Another area of interest is the enhancement of the Rayleigh wave which occurs when scanning close to a crack edge [2, 4, 6, 12], and whether this is also affected by crack angle. We present a study of this behaviour using two types of scanning techniques: scanning laser detection (as shown in Figure 3) and scanning laser source (SLS) [12]. Previous authors have reported enhancements for defects which are normal to the surface [2, 4, 6, 12], while this section discusses this effect as the crack angle changes.
Scanning Laser Detection
The enhancement that occurs when a detection transducer (such as the laser detection used here) is close to the crack opening has been reported to be due to multiple wave interaction: incident and reflected Rayleigh waves plus a mode converted surface skimming longitudinal wave, which positively interfere with each other [6]. Using the scanning laser detection arrangement the amplitude enhancement vs. crack angle was investigated. The enhancement was calculated using the ratio of the peak to peak amplitude of the Rayleigh wave at the crack and that measured at a distance from the crack; this was performed for each angle. Figure 6(a) shows enhancements for different d/λ. We can see that the amplitude enhancement is more pronounced for smaller angles. The amplitude enhancement diminishes at 10º, which may be because a considerable amount of the Rayleigh wave amplitude is able to be transmitted underneath the crack, as can be seen in model output displayed in Figure 6(b). This figure shows OP displacements on a vertical slice of the modelled sample, showing how the Rayleigh wave interacts with the defect at 10º. Additionally, the peaks at high angles, in Figure 6(a), may be due to diffraction, since they do not appear in our models for wide cracks. Finally, Figure 6(a) shows a comparison between the modelled data and data measured experimentally using an electro-magnetic acoustic transducer (EMAT), which despite acting as a velocity sensor shows similar behaviour to the modelled data.
FIGURE 6. (a) Amplitude enhancement vs. crack angle from models with d/λ=0.33, 0.67, 1.00, 1.33 and experimental data from EMAT. (b) OP displacements for a vertical slice of a model with a 10º crack, showing how a considerable amount of the Rayleigh wave amplitude is transmitted below the defect
be experimentally confirmed, however, similar enhancement behaviour has been shown in EMAT measurements.
Scanning Laser Source
Several authors have reported the observation of frequency changes when using the scanning laser source (SLS) technique, when the generation source is close to a surface crack [4, 12]. In this type of scanning, the enhancement which occurs close to the crack is also partly due to source truncation, the free boundary conditions at the edge of the crack and interference effects. Preliminary results for angled defects show a frequency enhancement, however, we present here only initial experimental results for a sample with a 90º crack. Figure 8 shows the change in frequency content as the generation laser nears the crack, with the central frequency peaking at around 9.1 MHz. The frequency enhancement factor was calculated as 6.1, which compares well with previous work using a real crack which reported an enhancement factor of 6.2 [4].
Phase Effects
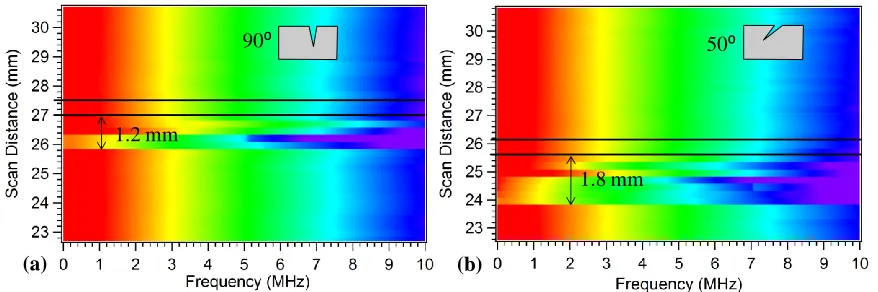
The FFTs of the Rayleigh waves can also give information through the phase component. Figure 9(a) shows the phase information from the same 90º crack as in Figure 8, showing a phase discontinuity starting at around 1.2 mm before the crack edge. An additional SLS scan was performed on a sample with a crack at 50º, Figure 9(b), showing a
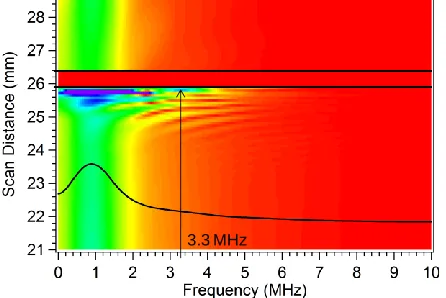
FIGURE 7. B-scan created using FFTs of the Rayleigh wave for a modelled crack of 10º and d/λ = 0.67, showing a variation in frequency content very close to the crack edge. One FFT is shown and horizontal lines mark the crack edges.
10⁰crack
Out-of-plane displacement Rayleigh wave
(a) (b)
[image:6.612.79.516.59.186.2] [image:6.612.175.398.544.693.2]FIGURE 8. FFT of an SLS scan of a crack at 90º and d/λ = 1.00 showing a change in peak frequency occurring very close to the crack edge. Horizontal lines indicate crack edges.
similar feature, with the phase changing around 1.8 mm before the crack edge. This occurs as the Rayleigh wave begins to interact with the crack, and could give information about defects of angle less than 90º.
TIME-FREQUENCY BEHAVIOUR
We have used an FFT to extract frequency and phase information from scans; however, the FFT does not provide information about when each frequency occurs in time, which may be useful in identifying interacting waves. One way to extract this information is by using a short time Fourier Transform (STFT), which computes the Fourier spectrum using a sliding temporal window. By adjusting the width of the window, time resolution can be determined. STFT introduces some time–resolution, but at the expense of frequency–resolution. Instead, we explore an alternative, the Wigner transform [21-23], also known as the Wigner Distribution Function (WDF), which maps a 1D time signal, U(t), into a 2D time-frequency representation. WDF is conceptually analogous to a musical score where the horizontal axis is time and the vertical axis is the frequency or note, giving a real answer, unlike an FFT. The WDF is defined by:
(1)
FIGURE 9. FFT phase information of an SLS scan of a crack of (a) 90º and (b) 50º, where d/λ = 1.00. Horizontal lines indicate the crack edges at the top surface.
9.1 MHz
90⁰
1.2 mm
(a)
50⁰
1.8 mm
[image:7.612.177.393.66.217.2] [image:7.612.73.512.543.689.2]In order to reduce the cross-term interference that a WDF is normally associated with, the Wigner transform was convolved with a 2D Gaussian, resulting in:
(2)
where δt and δf are the Gaussian widths. The modified transform is called a Gaussian-Wigner transform (GWT).
A GWT was applied to the A-Scan data from the sample with a 90º crack, previously explored using FFTs. Three A-Scans (top) and their corresponding GWTs (bottom of figure) are displayed in Figure 10, for the following laser source position: (a) 1.9 mm before the crack, (b) at the edge of crack and (c) 3.4 mm after crack. The A-Scans show the amplitude vs. time while the GWTs show their frequency vs. time. In Figure 10(a) (bottom), the GWT has a strong coloured feature on the left which corresponds to the frequency content of the incident Rayleigh wave, while the pale feature on the right is the reflected wave’s frequency information. Figure 10(b) (bottom, GWT) clearly shows a large frequency enhancement, where the peak frequency occurs at 9.1 MHz, which agrees with the previous value extracted from the FFT. Figure 10(c) shows a frequency content reduction below that possessed by the incident Rayleigh (Figure 10(a)). The GWT amplitude colours were auto-scaled according to maximum values.
CONCLUSIONS
[image:8.612.75.514.547.704.2]Modelled Rayleigh OP reflection coefficients showed good agreement with experimental results for cracks with a large range of angles (10º to 170º). Additionally, it was found that amplitude enhancements were higher at smaller angles, which agrees with EMAT measurements; experimental laser verification will be carried out in the future. FFT phase information identified defect position and showed promising capabilities to recognize cracks with angles less than 90º. The Gaussian-Wigner transform was successful in identifying frequency enhancement in addition to showing how the frequencies vary over time as waves interact. This initial work will be used to direct later work studying the behaviour of real cracks, which may be angled and partially closed, using a wide-bandwidth laser detection system that works on rough surfaces.
ACKNOWLEDGEMENTS
This work was funded by the European Research Council under grant 202735, ERC Starting Independent Researcher Grant. We also thank NESTA for Crucible Seed Funding.
REFERENCES
1. Hatfield Derailment. 2000; Available from: www.hse.gov.uk.
2. Boonsang, S. and R.J. Dewhurst, Applied Physics Letters, 82, 3348-3350, (2003). 3. Cheeke, J.D.N., Fundamentals and Applications of Ultrasonic Waves, CRC Press,
Boca Raton, Florida, 2002, pp. 143-149.
4. Dixon, S., et al., Nondestructive Testing and Evaluation, 23, 25-34, (2008).
5. Edwards, R.S., S. Dixon, and X. Jian, NDT & E International, 39, 468-475, (2006). 6. Edwards, R.S., et al., Applied Physics Letters, 87, 3, (2005).
7. Edwards, R.S., et al. 32nd Annual Review of Process in Quantitative Nondestructive Evaluation Amer. Inst. Physics, Brunswick, ME, 2005.
8. Fan, Y., et al., NDT & E International, 40, 471-477, (2007). 9. Jian, X., et al., Journal of Applied Physics, 101, 7, (2007). 10. Jian, X., et al., Journal of Applied Physics, 100, 6, (2006).
11. Kinra, V.K., Journal of the Acoustical Society of America, 79, 1688-1692, (1986). 12. Kromine, A.K., et al., 26th Annual Review of Progress in Quantitative Nondestructive
Evaluation, Amer. Inst. Physics, Montreal, Canada, 1999.
13. Vu, B.Q. and V.K. Kinra, Journal of the Acoustical Society of America, 77, 1425-1430, (1985).
14. Scruby, C.B. and L.E. Drain, Laser Ultrasonics: Techniques and Applications, Adam Hilger, Bristol, England, 1990, ps. 261,305.
15. Viktorov, I.A., Rayleigh and Lamb Waves: Physical Theory and Applications, Plenum Press, New York, 1967, pp. 5-6.
16. Arias, I. and J.D. Achenbach, International Journal of Solids and Structures, 40, 6917-6935, (2003).
17. Arias, I. and J.D. Achenbach, Wave Motion, 39, 61-75, (2004).
18. Aindow, A.M., R.J. Dewhurst, and S.B. Palmer, Optics Communications, 42, 116-120, (1982).
19. Hutchins, D.A., Canadian Journal of Physics, 64, 1247-1264, (1986). 20. Babich, V.M., et al., NDT & E International, 37, 105-109 (2004).
21. Wright, P.S. 1998 Conference on Precision Electromagnetic Measurements (CPEM 98), IEEE-Inst. Electrical Electronics Engineers Inc., Washington, D.C., 1998.
22. Bartelt, H.O., K.H. Brenner, and A.W. Lohmann, Optics Communications, 32, 32-38, (1980).


![N [(3RS,4SR) 1 Benzyl 4 methylpiperidin 3 yl] 1 (4 methylphenylsulfonyl) 5 nitro 1H pyrrolo[2,3 b]pyridin 4 amine](data:image/gif;base64,R0lGODlhAQABAIAAAP///wAAACH5BAEAAAAALAAAAAABAAEAAAICRAEAOw==)