Feasibility Study of Power to Gas
Technology at Twence
A report of a three months internship at Twence Waste
Processing Plant in Hengelo, the Netherlands
Bima Anggun Putra
(s1536818)
Supervisors:
ing. Henk Fikkert
ir. Leendert Tamboer
Prof. dr. ir. T.H. van der Meer
.
Faculty of Engineering Technology
University of Twente
Title: Feasibility Study of Power to Gas Technology at Twence
Subtitle: A report of a three months internship at Twence Waste Processing Plant in Hengelo, the Netherlands
Period: 20 July 2015 – 31 October 2015
Author: Bima Anggun Putra
Student’s no.: s1536818
Master Program: Sustainable Energy Technology (SET)
Supervisor at Twence : 1. ing. Henk Fikkert, Senior Process Engineer
2. ir. Lendert Tamboer, Manager Business Development & Strategy
Supervisor at University of Twente: Prof. dr. ir. T.H. van der Meer, Program Director of SET
Twence
Boeldershoekweg 51
P.O. Box 870
7550 AW Hengelo
The Netherlands
Faculty of Engineering Technology
University of Twente
P.O. Box 271
7500 AE Enschede
PREFACE
This report in front of you is the result of my internship assignment, as a requirement to fulfill the curriculum of Sustainable Energy Technology at the University of Twente. My internship takes place at Twence, a waste processing plant in Hengelo, The Netherlands. During the internship, I was assigned to a team of business and strategy development.
It has been great working experience at Twence and I have learned many things especially in the field of sustainable energy technology. Firstly, it shows me the working culture of Dutch people. My impression is that not only they are very professional and smart, but also they do not forget to maintain their work life balance. I would recommend that the Netherlands particularly Twence is one of the top places to work as an engineer. Second, working at Twence has inspired to be always optimist with the green technology because there are so many business opportunities for being green. After all, it was a very precious time to be part of Twence.
With the given topic, I have dealt with many challenges but it gave me interesting tasks as an engineer. At first, it worried me a little bit because the main core technology at Twence is about chemical engineering, while my major background is mechanical engineer. However, the smart philosophy of Power to Gas has kept me enthusiastic with the topic. Basically, I was given much free time to explore all of the research possibility and I really enjoyed the brainstorming session. Besides, this topic also has given me opportunities to learn the thermodynamic flowsheet model, financial budgeting study, and energy market analysis. After all, I can say it has been valuable experience for my master study and for my career.
I would like to thank my mentor, Henk Fikkert, for his continuous support and kindness, Leender Tamboer for the internship opportunity he gave to me, T.H. van der Meer for his guidance, and other friendly and supportive colleagues.
Last but not least, I would like to thank my lovely wife, Fikria Karinanur, who is always supporting me in every single moment of my life, my child, Airafilah Nabiha, who is always smiling at me when I get back home, and my parents, who are always praying for the best of my life.
Bima Anggun Putra
Enschede,
EXECUTIVE SUMMARY
The business of selling electricity is becoming less profitable at Twence, as the wholesale electricity price tends to continuously drop. In responding to this problem, it is important for Twence to find any of new possibilities to create a business case that can offer benefits by using the low price electricity. For this purpose, Power to Gas (P2G) technology can be one of the candidates and it is becoming a topic of feasibility study at Twence.
P2G is a potential business case at Twence. The P2G technology could be well collaborated with biomass/waste processing plant, thus it fits with the main business of Twence. The final products of P2G are also very flexible such as hydrogen, methane, or methanol. This flexibility makes P2G adaptable with the future energy market.
In accordance to above, it is worthy to do an investigation regarding the possibility to apply P2G at Twence. During three months internship, several investigations have been done. The result of investigation is provided in this report in which the structure consist of the following chapters.
Chapter 1 gives a brief introduction into the subject. First, a short description is given to the existing plants at Twence that are likely to have a relation with P2G. It is then followed by definition of problems, objectives, and methodology.
The aim of investigation is to identify possible routes of P2G and to define probability operation scenarios as well as business case. To achieve the objective four methodologies are used: (1) literature reviews, (2) analysis of electricity price, (3) thermodynamic and flowsheet modeling, and (4) financial calculation.
Chapter 2 provides a vision of the P2G technology. Basically, P2G takes important role in making a new
sustainable carbon cycle. This cycle has a process that can convert CO2 to synthetic fuels. In addition, the
fundamental theory of important reactions such as gasification, methanation, and methanol synthesis are introduced.
Chapter 3 explains the summary of literature reviews. It mainly describes the state of the art of power to gas, the different routes of P2G, and the latest development of plasma gasification. The main result of this chapter is that Power to gas plays a role in the decarbonization scenario. In this scenario, P2G is more likely to act as a chemical converter instead of energy storage. As a chemical converter, P2G offers the routes of methanation or
methanol synthesis from CO2, biomass, or waste. Through these routes, it is possible to create business cases of
replacing fossil based chemicals/fuels. These renewable fuels can be distributed to mobility sector or industry.
Chapter 4 provides analysis of spot electricity price using frequency curve. The data of the Netherlands, Sweden, Norway, and Denmark are taken for the analysis. As a result, it is revealed that the high penetration of wind based electricity production positively affects the electricity market price for P2G. This effect of high wind penetration is represented by Denmark spot price in comparison with the other three markets. From this result, it can be discussed that Dutch market will evolve toward a condition similar with DK1, because the Netherlands as well as other European countries has set a higher target of RE production for the next decades.
Chapter 5 describes the process of making flowsheet model. In short, the flowsheet model was successfully created and it can be used for comparison analysis between different input variables, routes, or operation scenarios of P2G system.
Chapter 6 presents the simple mass calculation using ideal stoichiometric ratio. The calculation is done to compare the difference between the output quaintly of methanation and methanol synthesis. From this chapter, it is concluded that the process of methanol synthesis is more efficient than methanation.
Chapter 7 elaborates the route of methanol synthesis. Three scenarios are investigated: (1) methanol synthesis
using CO2, (2) low yield methanol synthesis using biomass, (3) high yield methanol synthesis using biomass.
Chapter 8 presents the result of the financial calculation. The waste case shows a better result than the biomass case. In the waste case, profitable business case is noted (IRR>0), but the NPV has not fulfilled the Twence minimum requirement yet. Following this result, the sensitivity analysis is done to investigate which factor could significantly affect the value of NPV and IRR. It is found that NPV and IRR are sensitive to the investment cost of gasifier. Also, intermittent operation (winter summer cycle) has negative impact on NPV. This is because the growth of cash flow by intermittent operation does not compensate the larger capital cost.
TABLE OF CONTENTS
PREFACE ... 3
EXECUTIVE SUMMARY ... 4
CHAPTER 1: INTRODUCTION ... 3
1.1. General overview of Twence ... 3
1.2. Problem definition ... 4
1.3. Objectives ... 5
1.4. Methodology ... 5
CHAPTER 2: FUNDAMENTAL THEORY ... 6
2.1. P2G in the carbon cycle ... 6
2.2. Technology pathway of energy carrier ... 7
2.3. Reaction of gasification, methanation, and methanol synthesis ... 7
CHAPTER 3: LITERATURE REVIEW ... 9
3.1. Power to gas: state of the art ... 9
3.2. Waste/biomass to synthetic fuel: integration with power to gas ... 10
3.3. High temperature of gasification ... 11
3.4. Summary ... 11
3.5. Discussion and conclusion ... 12
CHAPTER 4: STATISTIC ANALYSIS OF ELECTRICITY PRICE ... 13
4.1. Data collection: energy market price ... 13
4.2. Analysis of day ahead hourly electricity price ... 14
4.3. Analysis of imbalance electricity price ... 15
4.4. The effect of seasonal changes ... 15
4.5. Discussion and conclusion ... 16
CHAPTER 5: THE MAKING OF FLOWSHEET MODEL ... 18
5.1. Basic theory: modelling reaction ... 18
5.2. Possible routes of P2G at Twence ... 18
5.3. The making of flowsheet model ... 20
5.4. Results ... 22
5.5. Discussion and conclusion ... 22
CHAPTER 6: IDEAL STOICHIOMETRIC CALCULATION ... 24
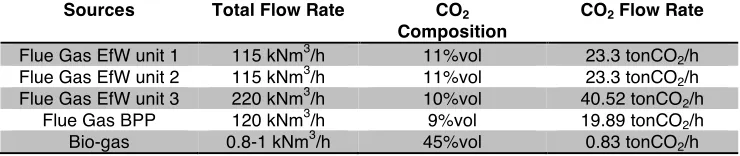
6.1. CO2 source at Twence ... 24
6.2. Maximum potency of methane and methanol production by recycling CO2 ... 24
6.3. Discussion and conclusion ... 25
CHAPTER 7: ROUTE OF METHANOL SYNTESIS ... 26
7.1. Methanol synthesis using CO2 feedstock ... 26
7.2. Methanol synthesis using waste/biomass feedstock ... 26
7.3. Simulation result and discussion ... 27
7.4. Conclusion ... 28
CHAPTER 8: FINANCIAL STUDY ... 30
8.1. Basic theory ... 30
8.2. Flowchart of financial feasibility ... 30
8.3. Capital cost ... 30
8.4. Net cash flow ... 32
8.5. Operational and other cost ... 32
8.6. Results and discussion ... 33
8.5. Conclusion ... 36
CHAPTER 9: Overall CONCLUSION AND RECOMMENDATION ... 37
9.1. Conclusion ... 37
9.2. Recommendation ... 38
APPENDIX ... 42
Appendix A: Data of energy market price: electricity, methanol, methane, CO2 ... 42
Appendix B: The combined flowsheet ... 47
CHAPTER 1: INTRODUCTION
The definition of Power to Gas Technology (P2G) may differ, depending on different perspectives. Commonly, P2G is defined as an energy system used to convert the electricity to gas. This meaning might be misinterpreted because it is impossible to transform the energy to a mass. However, from a different point of view, the electricity is in fact used to convert hydrogen and/or carbon containing feedstock to more valuable products such as gas or liquid fuel. The produced synthetic fuel is then used for instance as an energy carrier or a final chemical product. After all, P2G is the technology that may involve several chemical reactions including electrochemical, thermochemical, and/or biological reactions.
Twence might be a suitable place for realizing the P2G technology due to its availability of electricity and the chemical source (carbon, hydrogen, and oxygen) from municipal waste and biomass. Therefore, the feasibility of applying P2G at Twence Waste Processing Plant is discussed in this report. As an opening, general introductions of this study are explained in this chapter. The introduction includes the overview of Twence, problem definition, objectives and research questions, and methodology.
1.1. General overview of Twence
Twence is a waste processing plant producing raw materials and renewable energy. The raw materials are recovered from the waste by means of the separation process as well as the biological or chemical reaction processes. Meanwhile, the renewable energy is generated in a form of electricity and heat by burning the non-recyclable municipal waste and woody biomass. Located in Hengelo, Province of Overijssel, Twence has been delivering 50% of the steam production to a neighbor factory namely AKZO Nobel. Additionally, Twence is also providing heated water for district heating to the city of Enschede, FC Twente Football Stadium and
University of Twente. The name of customer of the district heating is EnNatuurlijk. In 2014, the electricity
production supplied to the public grid is approximately 401.8 GWh. This is comparable with the consumption of 15.000 households. Moreover, the heated water and steam production reached 169 GWh and 475 GWh respectively. This resulted in saving of around 95 million cubic metres of natural gas along with CO2 emission savings of more than 168,000 tons [1].
Several waste processing plants have been installed at Twence. The photograph of the entire plant layout is shown in Figure 1. It consists of the Energy from Waste Plant (EfW Unit 1,2,3), Biomass Power Plant (BPP), Bio Fermentation Plant, Bioconversion Plant (Digesting and Composting Plant), Waste Separation Plant, and a Landfill. In this introduction, high attentions are given to the EfW, BEC, and Bio Conversion Plant, since these plants may offer some possibilities to be in integration with Power to Gas technology.
Energy from Waste Plant (EfW
)
The energy from non-recyclable wastes is regenerated in this plant. The EfW plant processes over 600,000 tons of waste every year. Units 1 and 2 of this plant have the same design capacity and were built for the early operation, while unit 3 is designed for a bigger capacity and was established later. The waste is delivered into the furnace where the incineration process takes around 45 minutes. The combustion occurs in the furnace at a
temperature of 850 -1100 oC. With this process, various emissions are released and treated in flue gas scrubbing.
Additionally for the unit 3, Carbon Capture Storage (CCS) is mounted for capturing CO2 from the flue gas. The
bottom ash/slags are also formed in the incinerator as by-products of the waste burning process. For this, the bottom ash reprocessing plant at Twence is operating to extract the valuable metal remaining in the slag after the incineration process. Until now, Twence has been able to recover around 12,000 tons of ferrous and 3,500 tons of non-ferrous metals [2]. Despite of the constant of overall steam production, the supply of heat and electricity from this plant is varying throughout the year. This is mainly because of the changing demand from Twence’s
main customers: AKZO Nobel and EnNatuurlijk. Since AKZO Nobel can also partly generate the steam and
power by burning natural gas, the supply of renewable steam from Twence is fluctuating, depending on the grid electricity price. Furthermore, the demand of steam for district heating is also varying due to seasonal change.
Biomass Power Plant
Unlike the EfW, Biomass Power Plant (BPP) processes only waste wood, mainly low-grade waste wood, woody
with residence time almost the same with the EfW plant. This plant currently produces only electricity with 141.6 GWh supplied to public electricity grid in 2014 [1]. This amount is sufficient for approximately 44,000 households. This unit is recorded to have constant electricity productions throughout the year. However, there has been a development plan to improve the plant energy efficiency by delivering both steam and electricity to customers.
[image:9.595.116.479.139.383.2]Figure 1. The layout photograph of Twence.
Bio Fermentation Plant
Bio fermentation plant, or usually called Combi Digester Plant, is a pilot plant for digesting coarse and contaminated biomass. This plant mainly consists of two types of fermenters/digesters: Container Digester and
Wet Digester. With these installations, Twence enables to generate approximately 100 m3 of biogas. The biogas
is then burned in the Combine Heat Power (CHP) unit, producing 250 kW of electricity and 250 kW of thermal energy [2].
1.2. Problem definition
The idea to use Power to Gas technology is becoming an issue at Twence due to both external and internal problems. These problems include:
1. The increasing of intermittent power supply from Renewable Energy Source (RES): With the increase
of the utilization of solar and wind energy as primary renewable energy sources, it is predictable that the intermittent power supply will grow substantially in the near decades. It is reported that the European target of Green House Gas (GHG) emission in 2050 is 80%-95% reductions from 1990 level. To support this, 75% share of RES in gross final energy consumption is required [3]. Consequently, the increasing of intermittent power source, as an impact of the inconsistency of wind and solar irradiance, may lead to a problem where the excess or deficits of power supply to electricity grids occur more often.
2. The decreasing of wholesale electricity price: The business of selling electricity is becoming less profitable, as the wholesale electricity price tends to continuously drop. In responding to this problem, it is important for Twence to find any of new possibilities to create a business case that can offer benefits from the cheap electricity.
4 3
2
1
1. Biomass Power Plant
determined by balancing the amount of supply and demand in a specific hour. Moreover, the price might significantly move to negative or very high positive level, especially if the volume of electricity is largely influenced by intermittent RE source. In addition, another short time based electricity market, so-called imbalance market, is also available. This market offers electricity trading that is used to manage the surplus or deficit of the actual power generated from a generator. The time frame is shorter than hourly spot market and the price radically and randomly varies over the time. To summarize, the great fluctuation of electricity price may open a business opportunity for P2G, since there are certain periods where the electricity price drops to a value under the level of gas.
4. Ineffective use of organic wastes: Some organic wastes are ineffectively used or treated at Twence. Firstly, by-product of composting plant so called Sieve Overflow has become a major problem at Twence Plant. Currently, Twence must pay taxes for dumping these materials. Although they can be sent and burned in BPP, the amount of Sieve Overflow going to the BPP is very limited. This is due to the fact that Sieve Overflow contains high composition of minerals that may lead to corrosion problems in the burner. Secondly, Twence is now searching for an effective way to treat the Organic Waste Fraction. These materials will be later separated from “other waste” in the Waste Seperation Plant. Until now, there are no options except sending the materials to the incinerator.
5. Unstable electricity production: The actual production, or normally called Realization, rarely match the target production, or normally called Nomination. At Twence, the contracts of steam delivery to AKZO
Nobel and EnNatuurlijk are being made as per daily agreement. Therefore, everyday Twence set the
nomination of steam production, and followed by the nomination of electricity production. The difference between realization and nomination would represent the excess or lost production per day. This instability of electricity production is now being resolved by getting involved in the imbalance market. However, the imbalance market price is very volatile. Therefore, another solution to back up the steam and electricity production is required.
After all, the proposed P2G system in this study is therefore meant to overcome the above problems.
1.3. Objectives
The main objective of this feasibility study is to find a possible solution to tackle the future energy challenges and to see if there are any of new business opportunities for the future market. With understanding of the defined problems, it is therefore important to identify possible routes of P2G and to define probability operation scenarios as well as the business case. To be more specific on to what extend this study will contribute in achieving the objectives, the following research questions are determined.
1. Which P2G route is likely feasible to be in integration with the existing Twence Plant?
2. What operation scenario has the most benefits for Twence?
3. How much the Interest rate of Return (IRR) of the selected P2G business case?
1.4. Methodology
This study is conducted as a requirement to complete the master program of Sustainable Energy Technology in University of Twente. Therefore, the methodology to reach the assignment goal shall be in relevant to the intended program and the scope of works shall be feasible to be accomplished within the given period of internship (three months). In this assignment, the following methodology is used.
1. Literature review: This includes studies about the state of the art of P2G, energy market and price, and other technologies related with waste pre processing such as high temperature of gasification.
2. Statistic analysis of electricity price: the history data of wholesale electricity price from different countries are collected. Using this data, statistic analyses will be made.
3. Route modeling by a flowsheet program: The P2G/ route will be modeled in a flowsheet program named Cape Open (COCO) simulator. The purposes of this model are to understand the mass and energy flow, to show the performance of the selected route, to analyze the sensitivity of multiple parameters, etc.
CHAPTER 2: FUNDAMENTAL THEORY
The fundamental theories related closely to P2G technology are explained in this chapter. First, a simple picture of a carbon cycle with a new sustainable carbon route will be introduced. It is then followed by a brief explanation about the technology pathway with respect to energy carrier and biomass conversion process. Lastly, the basic theories in modeling important reaction such as methanation, methanol synthesis, and gasification will be mentioned as well.
2.1. P2G in the carbon cycle
The importance of P2G can be seen in the new carbon cycle. To understand this, the conventional carbon cycle
is introduced first. CO2 is conventionally released to the air as a product of combustion, and the carbon is
recycled by means of photosynthesis. Then, the carbon is used again as a fuel in the form of biomass or fossil fuels (coal, oil, natural gas). The rate of this cycle is slow in the process photosynthesis, as well as in the
transformation of biomass to fossil fuel. Consequently, it will lead to a high concentration of CO2 in ambient,
known as the major cause of global warming. Compared to the conventional carbon cycle, the new generation of
carbon cycle shows different loop and processes, as the P2G devices are utilized to convert CO2 emission to fuel.
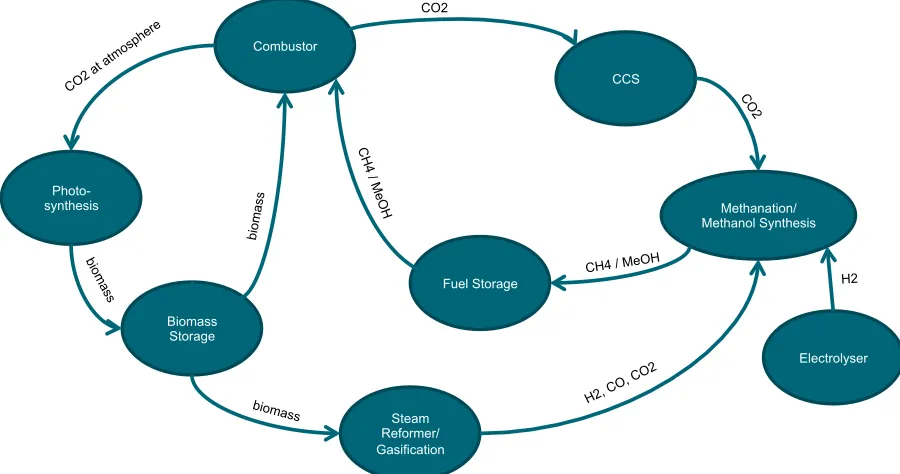
The new carbon cycle is illustrated in Figure 2. To catch the CO2 from the flue gas of combustor, Carbon
Capture Storage (CCS) can be used. Then, the CO2 will be transferred to a process such as methanation or
methanol synthesis in which the fuel producing reaction will occur. Next, the fuel would be stored until it is released whenever the energy demand is high. In this way, the cycle rate is improved and it is now possible to increase the energy rate without releasing more carbons to the atmosphere.
[image:11.595.71.521.386.623.2]Figure 2. The carbon cycle with the use of P2G.
Recycling CO2 is not always an efficient way to produce synthetic fuels. Unless it is extracted from the flue gas
of combustion, it takes a lot of energy to catch CO2 from the ambient air. Moreover, when it is not necessary to
burn the fuel, it is meaningless to obtain CO2 from flue gas.
Based on the above reason, it is also important to find a route to produce fuels directly from the biomass. As
shown in Figure 2, it is possible to create a shortcut to generate H, CO, or CO from biomass by means of a
Photo-synthesis
Combustor
Biomass Storage
CCS
Methanation/ Methanol Synthesis
Fuel Storage
Steam Reformer/ Gasification
Electrolyser
CO2 at atmo
sphe
re
bioma
ss
bioma ss
biomass
CH4 / MeOH
CO2
CO2
H2, CO, CO2
H2 CH4 /
Me O
Steam reforming and gasification have similar function but different concepts. The steam reforming reaction occurs to biomass with the addition of steam. Moreover, this reaction is done in the absence of oxygen, resulting
in a highly endothermic reaction. Hydrogen and CO2 are the final products of this reaction. On the other,
gasification could become an alternative to store the energy from biomass. The main products of this reaction are
CO and H2 or so commonly called Syngas. The main difference between the concept of gasification and steam
reforming is that the gasification process requires gasifying agents/mediums. Depending on the type of the agents, the gasification could become an endothermic or exothermic reaction.
The steam reforming is the most challenging process. This process needs catalyst and high amount of energy. Currently the steam reforming for biomass is still under research. In fact, the steam reforming is now being used commercially only for natural gas as a feedstock.
2.2. Technology pathway of energy carrier
Technology pathway of an energy carrier could be predicted by examining its history trend. Presented in Figure 3, H/C ratio could be the indicator to define what type of energy carrier will be demanded in the future market. As the H/C ratio is continuously increasing over the time, it is predictable that the future fuel is hydrogen. Nevertheless the world's technology has not reached yet the hydrogen economy. It is known that the C-1 fuel such as methane or methanol is currently becoming more attractive in the energy market. This condition indicates that the Power to Methane or Methanol might be feasible options for the electricity storage system.
Figure 3. Technology pathway for energy carrier.
2.3. Reaction of gasification, methanation, and methanol synthesis
Gasification is the process of converting solid/liquid carbonaceous material (in this case biomass) into carbon monoxide and hydrogen or commonly known as Syngas. There are some important reactions taking places in the gasification process. Both exothermic and endothermic reactions (1) - (14) consecutively happen in the reactor. To produce gas with higher H/C ratio, the gasification process adds hydrogen and/or strips away the carbon from hydrocarbon feedstock. Therefore, the gasification requires a medium/gasifying agent to make the reaction occurred. The main gasifying agents used for gasification are oxygen, steam, or air.
In the case of conversion of CO2 and CO to methane, the Sabatier Reaction (11) and (12) can be applied
respectively. Both reactions are highly exothermic but need a catalyst to enhance the kinetic. Depending upon
the application and the catalyst type, the Sabatier methanator is typically run at temperature of 250 – 400 oC [4].
At a higher temperature, the catalyst integrity could become an issue, and the reaction is likely toward the
reverse direction. Methanation reaction needs H2 as a reactant in which the H2 could be obtained as a product of
water decomposition (15). In this case, the P2G is meant for using electricity power to produce H2 by means of
electrolysis.
Methanol synthesis is a process to produce methanol from any hydrocarbon source. The reactions (16) and (17) use a solid catalyst and the global reaction of methanol synthesis is exothermic, reaching the higher conversion at a lower temperature. However, a lower temperature should compromise the small specific reaction rates. A
study shows that the reactor temperature is set as 280 oC such that a high pressure steam can be produced by the
Coal Gasoline/Diesel LPG Methane Hydrogen
H/C Ratio
reactor [5]. In this study, the input material for this reaction is syngas. Methanol from syngas involves
hydrogenation of CO (16), CO2 (17) and reversed water gas shift reactions (9).
Carbon Reactions:
C + CO2 ↔ 2CO ΔH298 K = +172 kJ/mol (1)
C + H2O ↔ CO + H2 ΔH298 K = +131 kJ/mol (2)
C + 2H2↔ CH4 ΔH298 K = -74.8 kJ/mol (3)
C + 0.5O2→ CO ΔH298 K = -111 kJ/mol (4)
Oxidation Reactions:
C + O2→ CO2 ΔH298 K = -394 kJ/mol (5)
CO + 0.5O2→ CO2 ΔH298 K = -284 kJ/mol (6)
CH4 + 2O2↔ CO2 + 2H2O ΔH298 K = -803 kJ/mol (7)
H2 + 0.5O2 → H2O ΔH298 K = -242 kJ/mol (8)
Water-Gas Shift Reaction:
CO2 + H2↔ CO + H2O ΔH298 K = +41.12 kJ/mol (9)
Methanation Reactions:
2CO + 2H2→ CH4 + CO2 ΔH298 K = -247 kJ/mol (10)
CO2 + 4H2↔ CH4 + 2H2O ΔH298 K = -165.0 kJ/mol (11)
CO + 3H2↔ CH4 + H2O ΔH298 K = -206.0 kJ/mol (12)
Steam Reforming Reactions:
CH4 + H2O ↔ CO + 3H2 ΔH298 K = +206 kJ/mol (13)
CH4 + 0.5O2→ CO + 2H2 ΔH298 K = -36 kJ/mol (14)
Water Decomposition:
2H2O ↔ 2H2 + O ΔH298 K = +285.8 kJ/mol (15)
Methanol Synthesis Reactions:
CO + 2H2↔ CH3OH ΔH298 K = -90.55 kJ/mol (16)
CHAPTER 3: LITERATURE REVIEW
In this chapter, literature reviews that support the idea to apply P2G are described. This chapter is started with a brief description of the state of the art of P2G from multiple literatures such as books, scientific papers/journals, and presentation slide of several companies involved in P2G business. It is then followed by brief insights about the importance and the opportunity of utilizing waste/biomass to produce methanol. Next, information summary about the latest development of high temperature gasification using a plasma heater is provided. Lastly, the overall summary of this chapter is given.
3.1. Power to gas: state of the art
Power to Gas is a distinctive route to tackle the future energy challenge. From an exergetic perspective, electricity should always be utilized as electricity. However, when problems occur in the electricity sector (such as congestion, negative electricity price or physical damage) or an electricity infrastructure is lacking at the production site, the electricity can be converted into hydrogen (gas). Power to Gas could also be used to overcome continuous transmission capacity constraint (grid specific) or to transport energy over long distances [6]. P2G is distinctive from other power storage technologies because of the characteristic in which the gas is being produced as an intermediate product. Generally, there are two possibilities of hydrogen conversion: (1) hydrogen from electrolysis is stored and reconverted to electricity by fuel cell, or (2) hydrogen/methane is accommodated in the gas infrastructure and reconverted into power by conventional technology. This way, electrical grid expansion can be avoided when stored energy is transported away through the gas distribution system. However, it shall be noted that the amount of hydrogen that can be fed into a natural gas grid is limited. The maximum allowed hydrogen fraction in the Dutch gas transmission grid is 0.02 vol% [7]. From 2021 onwards, the maximum allowed hydrogen fraction would be 0.5 vol% [8].
Different performances of P2G system are reported in many literatures. A study by [9] concluded that the overall efficiency of different P2G systems is in the range of 77% in case of power to hydrogen, to as low as 18 % in
case of power to methane (CO2 source is from atmosphere). Nevertheless, efficiency is less important in the
wider point of view in which the P2G is enabling the delivery of renewable gas in other sectors, such as the industry or mobility sector.
Research and development on P2G is being followed by the progress of development in Methanation process. Generally, the methanation process can be performed in chemical and biological process. Chemical process is a matured technology that is currently available in different industrial application. However, the development on a biological process shows a significant progress as it could offer more advantages, and it is now started being commercialized [10] [11]. Table 1 shows comparison of characteristics between chemical and biological methanation.
The electrolysis is believed as the major technical and economic challenge for the P2G system. Currently, there are three main water electrolysis technologies available, namely Alkaline Electrolysis (AEC), Polymer Electrolyte Membrane Electrolysis (PEMFC), and Solid Oxide Membrane Electrolysis (SOEC). The SOEC,
operating at 700-1000oC, has the highest efficiency potential but currently is the least developed technology. It
deals with an issue in the material degradation. The AEC is the oldest and the most mature technology but it deals with a limitation on the flexibility of an intermittent operation which it is highly required for P2G technology [12][13]. A great significant progress of development has been shown for PEMFC. This technology could offer various advantages such as the compact design, high current densities, high operation temperature, high flexibility with respect to operation mode and wide partial load ranges. However, it has several drawbacks such as its high cost, the limited materials, and scaling up problem. Regardless the type, the major challenges of electrolyzer are the limited capacities, degradation behavior and high investment as well as operating cost of electrolyzer systems[12]. Regarding the Intermittency load for electrolyzer, batteries are suitable for short-term energy storage and minimize the cycling of electrolyzer. Besides, they can manage load transients and intermittent power peaks, provide bus stability and smooth out the power output of renewables [13].
methanator, the future investment cost for comparison is between 130 – 300 euro/kWe [12]. Although the P2G costs are currently still high, the costs of power to gas can achieve market competitiveness in the long term by including additional cost such as energy infrastructure cost [12]. Power to Gas should not be restricted exclusively on the storage option. It can be useful for other system functions, such as the transportation energy.
There are multiple landscapes/environments observed to have major and minor impacts on the application of P2G technology in the future. Firstly, P2G plays a big role in case of an increasingly large role for renewable source in the deep decarbonization energy system. It is found to play a role in a cost-optimal mix of energy technologies in 85% of CO2 reduction scenario. Secondly, The availability of Biomass and CCS has a large impact in which a reduced biomass and CCS potential lead to a larger investment in electrolysis. Methanation is
an option to achieve a significant CO2 emission reduction when the available capacity for CO2 storage is fully
utilized. Thirdly, a lower investment cost has a moderate impact on the role of P2G. Moreover, the need for the flexibility in a larger intermittency power supply is not the key driver as it has less impact than the deep decarbonisation setting. Moreover, an increase or decrease in fossil fuel price is not a game changer for the role of P2G [15].
Table 1. Comparison between chemical and biological methanation.
Characteristic Chemical Biology Reference
Process temperature (oC) 200-750 35-70 [16], [17], [10], [11]
Delivery Pressure (bar) 4-80 1-3 [17], [10], [18]
Maximum Production Capacity (MWCH4)
<500 15 [19], [6]
Maturity Commercial for
large plant
Pre-commercial
[6] [10]
Cold Start Time hours Minutes [20], [6]
Annual Availability 85% 90% [21] [6]
Efficiency (excl. electrolysis)
70-85% 95-100% [16], [17], [6]
3.2. Waste/biomass to synthetic fuel: integration with power to gas
Understanding the integration of P2G with biomass/waste processing plant is one of the objectives in this chapter. Therefore, the literature review regarding the route of Waste/Biomass to Synthetic fuel as well as the possibilities to be in integration with P2G is performed. It shall be noted that the P2G here refers to hydrogen production with the use of electrolyzer.
The route of waste/biomass to synthetic fuel is essential for Twence in developing a new method to recycle the waste or to utilize the green materials. It can be said that both power to gas and waste/biomass to fuel have the same operation philosophy. This means that there is a possibility to apply integration between these two routes. Figure 4 illustrates the flexibility of using renewable gas storage facility, in a way to combine the route of P2G with the route of waste/biomass to syn-fuel. In addition, the route of making methanol from waste/biomass looks attractive.
3.3. High temperature of gasification
High temperature gasification could become one of the promising technologies for supporting the P2G system. The utilization of pure oxygen from the by-product of electrolysis is the key concept of the integration between the gasification and the P2G system. As explained in the previous chapter the oxygen can be an option for gasifying medium. Oxygen based gasification offers advantages over air based gasification such as lower capital cost or similar operating cost and higher calorific value of syn-gas product [23]. The latest development of gasification technology indicates that the high requirement of clean syngas with controlled composition has led to a very high temperature process with an external energy source. Thermal plasma (plasma with local thermal equilibrium) offers extreme properties with very high temperature of reaction, which can be applied for waste/biomass gasification. Thermal plasmas are dominantly generated by either an electric arc or by a radio-frequency induction discharge [24]. In waste treatment, the DC arc is mostly used. However, the use of some AC plasma torches in biomass gasification are known [25].
Several researches have been conducted for technology conversion of electrical energy to chemical equipped by Argon, Air and water steam DC current plasma torch. The arc temperature of a DC plasma torch varies between 5000 and 1000 K [26]. An experimental investigation by [27] has been performed for a reactor operating at
hundred pascal and temperature of 1200-1400 oC. The throughputs of the tested biomass materials (sawdust,
pellets, waste plastics, and pyrolysis oil) for the gasification ranged between 9 and 30 kg/h. The result indicates
approximately 90% of CO and H2 in the syngas with the torch input power of 100 kW. A similar research of
plasma gasification by [28] was also established for Refused Derived Fuel (RDF). It is revealed that the thermodynamic equilibrium model works very well for plasma gasification. Experiment data shows that the product gas contains small amount of Volatile Organic Compounds (VOCs) and tars. These results are very close to the thermodynamic equilibrium simulation.
[image:16.595.75.524.364.642.2]Figure 4. Schematic route of P2G and waste/biomass to synthetic fuels [29].
3.4. Summary
The latest development of P2G technology can be seen in the methanation process. It is found from the literatures that the biological methanation could offer higher efficiency than the chemical methanation due to its capability to operate at low pressure and temperature.
Electrolyzer is still the major challenge for the technical and economic feasibility of P2G. The most mature technology of Alkaline Electrolyzer (AEC) is dealing with the problem of limitation in intermittent power input, while PEMFC, which works well in flexible load, has some drawbacks such as the high cost, scarce material, and scaling up problem. With the investment cost around 1,500 - 9,000 euro/kWe, the electrolyzer may not become a feasible solution. However the use of electrolyer in P2G shall not be limited for energy storage, It may show competitiveness if the P2G is meant for energy distribution system using gas grid.
Despite its multiple drawbacks, P2G can still play a big role under certain landscapes. The relevant literatures mentioned that it is not the lower investment cost, the larger intermittent energy supply, nor the change of fossil fuel price that will significantly affect the role of P2G in the energy market. It is a landscape of deep decarbonization that can raise the importance of using P2G. In this case, P2G will significantly contribute to
reach the target of 85% CO2 reduction from 1990 level. This can be done by recycling CO2 and replacing the
fossil fuel with RE hydrogen, RE methane, etc.
It is known that renewable gas, so called syn-gas, is the key item in making a well integration system between P2G and waste processing plant. The characteristic of syn-gas in such that its components can be supplied from biomass (via gasification), water (via electrolysis), or organic waste (via biogas fermenter) makes it really flexible to become the connection bridge between the different processes.
As a product of P2G, methanol offers some advantages over the methane and hydrogen. Its easiness in handling, storing, and transporting is the major benefits of methanol. Moreover, wider uses of methanol in energy generation and transportation sector have been found in the literatures. Besides its function as an energy carrier, methanol is also largely used in chemical industry as the basic chemical feedstock.
In terms of conversion of biomass to syngas, the high temperature of plasma gasification could provide more
benefits. This technology is mainly developed for processing the waste. With temperature of around 1200 oC, it
is claimed that the plasma gasifier enables the conversion of waste/biomass to syngas with large improvement in carbon conversion. It is reported that the reactions occurred in such gasification almost reach it thermodynamical equilibrium condition. Plasma gasification can works well with P2G because it uses oxygen from electrolyzer.
3.5. Discussion and conclusion
It is worthy to do an investigation about the feasibility study of P2G technology at Twence. Despite the fact that the technology is still immature, the progress of development is accelerating in the recent times. Moreover, the technology could well collaborate with the biomass/waste processing plant and this certainly fit with the main business of Twence. The final products of P2G are also very flexible, making it adaptable with the future energy market.
Most importantly, instead of seeing P2G as an energy carrier, a much bigger business opportunity can be seen
from a perspective that P2G plays an important role in reducing CO2. The products of renewable syngas,
methanol, methane, etc. can be synthesized using P2G technology. These sustainable products will soon take a
place in the global market, replacing the fossil based products. In addition, P2G enables the CO2 recycling by
using the CO2 as the carbon feedstock for methanation or methanol synthesis. To summarize, P2G will be highly
demanded for deep decarbonization scenario and the opportunity of making a business from P2G will increase.
CHAPTER 4: STATISTIC ANALYSIS OF ELECTRICITY
PRICE
Statistic analysis of electricity price of Netherlands as well as other European countries is provided in this chapter. This is done as a part of investigation to identify in which and what kind of market P2G is likely more applicable. To do the analysis, the historical data of the energy market price in 2014 is collected. The data
includes spot electricity, methane, methanol, and CO2 price. The analysis of spot electricity price is done for both
day ahead hourly electricity price and imbalance price. In addition, the effect of seasonal changes on electricity price is also investigated. Lastly, the discussion and conclusion of this chapter are given.
4.1. Data collection: energy market price
Energy market price is crucial input data for investigating a business of Power to Gas. The need to store the electricity can be indicated by the decrease in the electricity price. Therefore, the data of electricity price should be examined thoroughly. Furthermore, the methane and methanol market are also taken into account, in order to investigate the competitiveness of the synthetic methane/methanol price in the global market. Besides, Data of
CO2 price is also very important because the implementation of P2G is highly supported by a high target of
decarbonization landscape.
In this study, the energy market price is intended for electricity, methane, methanol, and CO2. It shall be noted
that there are two types of electricity price data namely daily ahead hourly price and imbalance price. The graphs of yearly historical data of all mentioned market prices are attached in Appendix A and each market price will be further elaborated below.
Daily ahead hourly price of electricity
A representative data of daily ahead hourly price of electricity has to be taken for the analysis. For this, data of APX hourly in 2014 was obtained, as Twence is usually involved in this market.
For comparison analysis, data from different countries were taken. As known previously that the P2G will play a role very well in a market with high supply of electricity from intermittent RE source. In 2013, Denmark was reported to be the country with the highest wind energy penetration, as 32.2% of its electricity was being supplied by wind turbines [30]. This condition may already represent the trend toward a situation in which power to gas is becoming more applicable. Hence, the data of Denmark is obtained for comparison with the data of Netherlands. In addition, the historical 2014 data of Sweden and Norway were also taken due to respectively the highest total RE consumption and the highest energy production from hydro potential.
Besides historical data, it was previously considered to use a prediction data of electricity price as a function of wind energy penetration. From literatures, there are in fact numerous mathematical models developed to predict the future electricity market price. However, due to many uncertainties of landscape that may affect the electricity price, it is then decided to examine only historical data of electricity price.
Imbalance price of electricity
It is not necessary to obtain the imbalance market price from different countries. This is because the imbalance price does not correspond with the amount of renewable energy supply. As previously mentioned, this electricity-pricing scheme is basically meant for settling the discrepancies between the amounts of electricity in which a company has contracted to generate or consumed and the amounts that are actually generated or consumed. As a result, the data of the imbalance market price was obtained only from Tennet (2014), a market that Twence usually deals with.
Gas/methane price
The historical data of European market price of gas/methane was obtained. Unlike the day ahead hourly electricity price, no significant fluctuations have been recorded for the global market price of methane. According to ICE ENDEX market, the yearly ahead gas price is likely to drop from 25 euro/MWh to 20 euro/MWh in 2014. For quarterly and monthly ahead price, the market shows a difference between winter and summer. However, the average trend is going in the same direction as yearly ahead price. In this study, the methane price unit is converted to a mass basis (euro/ton) by assuming that the Low Heating Value (LHV) is 40 MJ/kg. This is done to make the methane price comparable with the methanol price unit.
Methanol price
The history data of European market of methanol shows an opposite trend, compared to gas price. It is found that the price fluctuation exists over the year, however since 2000 the average contract and spot price are continuously growing until they reach at the level around 250 euro/MT in 2012 [32]. Moreover, the recent data shows even higher price, as it is reported that the price per September 2015 is 355 euro/MT [33].
CO
2price
Despite the fact that the carbon price had dropped due to the European crisis, they are likely to rise again in the coming years due to strong actions by the European government. The extent of the price hikes is unclear, but
European targets are around €30/metric ton CO2 in 2030. An assumption of around €12/metric ton in 2020
seems prudent, compared to €8/ton right now.
4.2. Analysis of day ahead hourly electricity price
Using the data obtained, the histogram/frequency graph can be plotted for each sample, as shown in Figure 5. As stated earlier, there are four samples of spot market: Denmark DK1, Sweden SE1, Norway (Oslo), Netherlands (APX). It is seen that all samples follow the normal distribution, although the statistic variables of each sample are different. The Oslo market indicates a steep profile with the lowest average value. This profile is reasonable because Norway has the biggest share of hydro-based electricity production. In contrary, the APX shows wider frequency distribution but with the highest average value. Although there may be various factors affecting the electricity price, it can be argued that the low RE share in Netherlands has led to a different frequency profile, compared to the other three markets. An interesting fact is revealed from DK1 spot market. It is visible that the DK1 has a small slope around and its average value is comparatively low. Moreover, it also shows a range of frequencies where the electricity price is negative. From this, an argument could be made that the high penetration of wind-based electricity is the major factor of such a frequency profile to occur. The negative price occurs only in the condition of which the energy generation could not be stopped during low load demand. This condition does not occur in Norway because the water potential energy can be quickly stored or released. To summarize, the DK1 is found to be the most suitable market for applying power to gas since it shows the highest probability to have low electricity prices. It is also proved that higher wind penetrations would shift the electricity market to a feasible environment for P2G.
For quantitative comparison, the statistic variables of each market are summarized in Table 2.
Table 2. Statistic variables of the energy prices 2014.
Study case Denmark
(DK1) Hourly Spot
Price (Euro/MWh)
Norway (Oslo) Hourly Spot Price (Euro/MWh)
Sweden (SE1) Hourly Spot Price (Euro/MWh)
APX-NL Hourly Spot
Price (Euro/MWh)
Tennet Quarterly Hour Imbalance Price
(Euro/MWh)
Mean 30.67 27.33 31.42 41.18 44.04
Standard Deviation 10.24 6.16 6.31 10.7 57.46
Figure 5. Frequency graph of the hourly electricity price 2014.
4.3. Analysis of imbalance electricity price
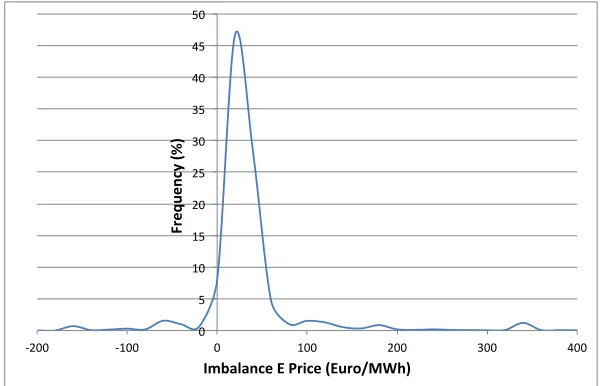
In addition to hourly electricity price, the frequency profile of imbalance market by Tennet in 2014 is plotted separately in Figure 6. It is seen that imbalance market does not fully follow the normal distribution. There are some growths of frequency in both left and right side of the graph. It could be said that such a shape appeared because of unknown factors affecting the inconsistency in the performance of the power plant. There are too many uncertainties in imbalance market, resulting to an unpredictable situation the following year.
The data shows a very disperse data of which Power to Gas Technology might play a role. However, it should be kept in mind that the interval time of price settlement is only 15 minutes. If P2G is applied to this market, it must have a capability to work very flexible in such extremely short time.
The statistic variable of Tennet imbalance market is also given in Table 2. It is revealed that the standard deviation of Tennet is around six times higher than the data of hourly electricity price. The imbalance price could drop very far to -442 euro/MWh or jump to 446 euro/MWh. Nevertheless, Tennet has the highest average price (44 euro/MWh) among all the markets.
Figure 6. Frequency graph of Netherlands (Tennet) imbalance market price 2014.
4.4. The effect of seasonal changes
The effect of seasonal changes may differ, depending on the countries. In this section, the electricity price market of DK1 will be used as an example for the analysis.
0" 10" 20" 30" 40" 50" 60"
)30" )10" 10" 30" 50" 70"
Fr
eq
ue
nc
y)
(%)
)
Daily)Ahead)E)Price)(Euro/MWh)) DK1"2014" SE1"2014" Oslo"2014" APX"2014"
0" 5" 10" 15" 20" 25" 30" 35" 40" 45" 50"
(200" (100" 0" 100" 200" 300" 400"
Fr
eq
ue
nc
y)
(%)
)
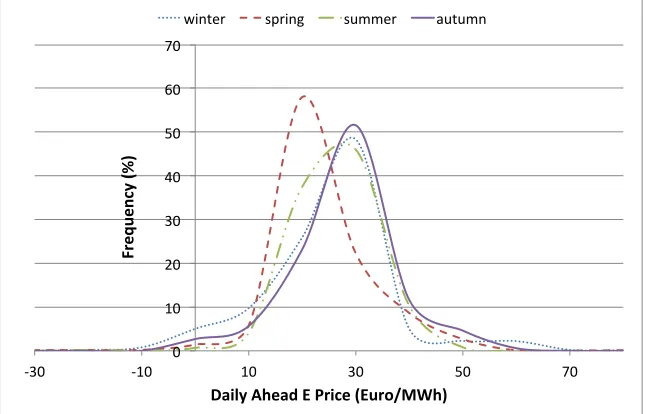
[image:20.595.147.448.493.686.2]The seasonal changes have influenced the price of DK1 in 2014. This becomes visible in the graph of price electricity vs time, provided in Appendix A. The significant difference occurs between winter and summer. Based on the data, the price in the winter season has a greater fluctuation (higher amplitude) and reached a negative value. On the other hand, the price in the summer shows lower fluctuation and the highest prices were recorded. This difference appears due to the fact that wind is much available in winter. By understanding the characteristic of the wind, it can be suggested that P2G shall operate only during the season with high availability of wind or winter season in the case of European countries. To visualize the seasonal effect on the frequency graph, the data for one year is breakdown into four groups of seasons, and then the frequency curve is plotted again for each group, as it is presented in Figure 7.
One may suggest that winter and spring seasons are the good time to run the P2G in DK1. It is visible that only in spring season, the peak frequency is significantly shifted toward lower electricity price. This will indeed gain the cash flow of P2G. Furthermore in the winter, despite the peak frequency occurs at the price around 30 euro/MWh, it shows a lower frequency for high price but higher frequency for low or negative price. To summarize, running P2G in winter and spring may offer more profitable business case.
[image:21.595.137.460.258.465.2]Figure 7. DK1 frequency curves of four different seasons.
The DK1 market price data in the above analysis is selected only for an example. The same analysis can be also applied to the APX or other markets. However the analyses for other markets are not provided in this report.
4.5. Discussion and conclusion
Analyzing the historical data of an electricity price by using statistic and histogram/frequency curve can be a good methodology to understand whether the market is ready (or not) for P2G technology. Besides knowing the average price, frequency distribution of prices also plays an important role for P2G and this can be seen in the frequency curve. After all, it is very convenient to perform qualitative and quantitative analysis by seeing the histogram and static variables.
The high penetration of wind based electricity production positively affects the electricity market price for P2G. This is known by comparing the histogram/frequency curve of DK1 and other countries. Denmark, which is now having the highest wind energy share in its electricity production, has shown a different histogram of electricity price. It is revealed that DK1 2014 has lower average price and higher distribution, compared to APX, Oslo, and SE1. The shape of DK1 frequency curve compared to other countries has given a positive impact to the feasibility of P2G.
The main message from the analysis of the effect of seasonal changes is that it is important to break down the
0" 10" 20" 30" 40" 50" 60" 70"
*30" *10" 10" 30" 50" 70"
Fr
eq
ue
nc
y)
(%)
)
Daily)Ahead)E)Price)(Euro/MWh))
give more benefits than other seasons. For example, spring and winter seasons are the best period to run P2G for DK1 market.
Nevertheless, running the system in a seasonal basis time frame is not always an ideal solution. Ideally, the hourly electricity price should be applied to an hourly-operated P2G system. However, this may lead to flexibility problems such as the long time requirement for start up or shut down. To overcome this problem, the operational time frame shall be lengthened to a daily, weekly, monthly, or seasonal basis time frame. From this, it could be known that the seasonal basis time frame is merely one of the options, not the best/ideal case.
CHAPTER 5: THE MAKING OF FLOWSHEET MODEL
This chapter presents the possibilities of P2G route at Twence together with the process of making the flowsheet model. At the beginning, the basic theory of how to model the reaction is introduced. Then, a number of route possibilities at Twence are shown and the descriptions of each route are given. These routes are then drawn in a flowsheet modeling tool namely Cape Open (CoCo) Simulator. The explanation of the model such as the components used, assumption, design parameters, etc are mentioned. Finally, this chapter ends with discussions and conclusions regarding the model.
5.1. Basic theory: modelling reaction
Simulation or mathematical model takes an important role for the study of reactions, thermodynamic condition, chemical mass and heat balance. It may not give a very accurate prediction, but it can provide at least guidance in understanding the operating condition and the effect of changes on input parameters.
In this study, simulation by a flowsheet model is applied to visualize and analyze the proposed P2G system. This model includes multiple reactors and auxiliary equipment. One of the important steps in making the flowsheet model is to understand how to determine the proper model for the reactions involved.
A model of reaction can be classified into two groups, thermodynamic equilibrium and kinetic model. The thermodynamic equilibrium predicts the maximum conversion of reaction, without taking into account the geometry of reactor. The reaction is assumed to occur in infinitive residence time, so that thermodynamic equilibrium is always achieved. On the other hand, for practical application the kinetic model is more accurate to predict the product from a reactor that provides a limited time for reaction. This model takes into account the kinetic rate of each elemental reaction.
One of the thermodynamic equilibrium model, so-called the minimization of the gibbs free energy, is mainly used for this study. In this model, no knowledge of a particular reaction is required to solve a problem. A stable equilibrium condition is reached when the Gibbs free energy of the system is at the minimum level [34]. The
Gibbs free energy, Gtotalcomprising N species (i = 1, 2, 3, ….N) is expressed by eq. (18).
𝐺!"!#$= 𝑛!∆𝐺!!,!+ 𝑛!𝑅𝑇ln !!!
!
! !!!
!
!!! (18)
Where ∆𝐺!!,! is the Gibbs free energy of formation of species i at standard pressure of 1 bar. The equation (18)
has to be solved for unknown values of ni to minimize the Gtotal.
5.2. Possible routes of P2G at Twence
There are basically multiple ways of utilizing electricity for chemical conversion. As P2G is always identic with the process of electrolysis, it is commonly known that P2G refers to the conversion of water to hydrogen. However, P2G could also be differently defined as a process to produce syngas from biomass, namely gasification. This way, the electricity is used to generate heat to reach the temperature of gasification. Besides, the electricity is needed to run the auxiliary equipment in the sub-system/plant such as the compressors in methanation plant or methanol synthesis plant.
Figure 8. Possible routes of power to gas at Twence.
• Route no. 1: Hydrogen + CO2 emission à CH4: This is a simple route, consisting only two of pure
reactants: the hydrogen from electrolysis and the CO2 from CCS. This route has the highest energy
consumption, since the hydrogen is extracted only from water. It is suitable for chemical process with big
capacity. Assuming the water is abundantly available, the limited amount of CO2 becomes a constraint of
this route. This route may also have a good integration with the bio-fermenter plant.
• Route no. 2: Hydrogen + Syngas à CH4: Replacing CO2 emission with syngas offers multiple
advantages. The component of hydrogen in the syngas reduces the supply of hydrogen from electrolysis.
Furthermore, the use of CO as reactant leads to a higher yield of CH4, as the stoichiometric ratio can be seen
in reaction (12). Nevertheless, this route requires the process of waste/biomass gasification, resulting to an increase in plant capital cost.
• Route no. 3: Hydrogen + CO2 emission à CH3OH: This route is basically same as the route no. 1 unless
the product of reaction is methanol. This route can provide higher product yield than route no.1 because of the oxygen containment in methanol. However this route may not be well integrated with the bio fermenter plant, since the methane in biogas would become an inert gas and must be discharged from the system.
• Route no.4: Hydrogen + Syngas à CH3OH: This route includes a methanol synthesis process using
syngas. The process of making methanol from syngas has become a mature technology nowadays. As long
as the stoichiometric ratio between CO, CO2, and hydrogen are maintained, it is possible to generate highest
methanol yield without the presence of water as by product.
• Route no. 5: Syngas + O2 à Power: This is an additional route, where oxygen is mixed with syngas to produce power by means of combustion. The oxygen will raise the combustion efficiency because it replaces the air as an oxidant. The supply of oxygen for this route is from electrolyzer. However, it shall be noted that the oxygen from electrolyzer is primarily sent to the gasifier. If the amount of oxygen is exceeding the need for gasification, the excess will be directed to this route.
In order to find the best route for Twence, the above five alternatives shall be investigated thoroughly, for instance, by looking its thermodynamic performance. To do so, a flowsheet simulation is required and the making of the flowsheet model will be described in the next section.
RE Methanol
Heat Electrolyser
Electric heater
Gasification
Sabatier Reactor (Methanation)
Bio-Converter, Fermenter
Electricity Grid
Water/H2O
El
ect
rici
ty
at
lo
w
p
rice
Heat
H2
O2
Waste / Biomass Syn Gas
Biomass (Bioconversie) Bio-gas,
(CH4, CO2)
CH4 (SNG)
Heat
residue
Flow of Electricity/heat Flow of mass
steam
CCS
Solid Residue
Methanol Synthesis
Pre-Treatment Process Bio-Coal
Sensible Heat
Combustor/ Syn Gas
Turbine
Heat Electricity CO2
Heat
5.3. The making of flowsheet model
The flowsheet model is created based on the possible route of P2G at Twence, as mentioned previously. The flowsheet model mainly consists of five major segments: (1) water electorlysis (2) gasification, (3) methanation plant, (4) methanol synthesis plant, (5) syngas power generation. These segments are combined in the model, so that the change of input or operating condition of one process will automatically affect to the other processes. In the end, it is expected that the model enable many variations of P2G route.
The details of each segment are described below.
Segment no. 1: Water Electrolysis: This process is modeled in such that the stoichiometric reaction of water decomposition (15) occurs. The model is equipped with a fixed conversion reactor, a pump, and a compound splitter. The power input of electrolyzer is set as the input parameter, controlling the water federate to reach its stoichiometric ratio. The water is pumped from atmospheric pressure to 20 bars before it enters the electrolyzer.
Then, the products (H2 and O2) are separated afterward through a compound splitter. Beside the ideal
stoichiometric reaction, several assumptions are applied to the model, for instance the pump isentropic efficiency
of 0.9, the electrolyzer efficiency of 0.83 at operating temperature of 25 oC, and no heat and pressure loss. The
[image:25.595.189.394.299.369.2]flowsheet diagram of the model is shown in Figure 9.
Figure 9. Flowsheeting diagram of water electrolysis.
Segment no. 2: Gasification: The thermodynamic equilibrium reaction is implemented in the gasification model. This way, the reactor/gasifier is modeled as gibbs minimization/non stoichiometric reactor, where all of feed streams are converted into defined gases at the minimum gibbs value. In this model, the solid biomass is decomposed to certain composition of gases (Raw Gases). This is done because the Cape Open Simulator has a constraint of in which the gibbs minimization reaction can only work with the gas phase. The mass fractions of each element (such as carbon, hydrogen, and oxygen) in the raw gas are set to be equal as if it is in the solid phase. Both water and oxygen from electrolyzer are used for the gasifying medium, and their flow rate are adjusted to a value of which it leads to an endothermic reaction. This condition is expected because the main objective of the system is to create a power consuming system. The temperature of reacting zone and the
operating pressure are set to 1200oC and 20 bar. The gasification temperature is based on several literatures
regarding the experiment of a new developed gasification process using DC arc plasma heater [27][35]. In addition, two heat exchangers/recuperators are placed to utilize the sensible heat of the product gases. The flowsheet diagram of the model is shown in Figure 10.
Figure 10. Flowsheeting diagram of gasification.
[image:25.595.152.452.578.685.2]
![Figure 4. Schematic route of P2G and waste/biomass to synthetic fuels [29].](https://thumb-us.123doks.com/thumbv2/123dok_us/9812779.482498/16.595.75.524.364.642/figure-schematic-route-p-waste-biomass-synthetic-fuels.webp)