1 1 Improving thermal performance of an existing UK district heat network:a case for temperature
2 optimization
3 Authors
4 Michele Tunzi*a, Rabah Boukhanoufb, Hongwei Lic, Svend Svendsenc, Anton Ianakievd
5 *Corresponding author. Tel: +44 7544 70 12 47, E-mail address: [email protected]
6 aSchool of Civil & Building Engineering, Loughborough University, LE11 3TU, Loughborough, UK 7 b Department of Architecture and Built Environment, University of Nottingham, NG7 2RD, 8 Nottingham, UK
9 cDepartment of Civil Engineering, Technical University of Denmark, Brovej, Building 118, DK-2800
10 Kgs. Lyngby,Denmark
11 dDepartment of Civil Engineering, Nottingham Trent University, NG1 4BU, Nottingham, UK
12 Keywords: Plate radiators, temperature optimization, low temperature district heating, heat network 13 modelling
14 Highlights
15 Optimization of plate radiators operating temperature
16 Modelling and optimization of low temperature district heat network thermal performance 17 Method of investigating and improving performance of existing heating systems connected to 18 district heat network
19 Abstract
2 30 pointed out that optimal operation of future low temperature district heat networks will require close 31 engagement between the operator and the end user through incentives of mutual benefit.
32
33 1 Introduction
34 The decarbonization of the UK heat market is becoming central to achieve the country’s emission 35 targets as it accounts for nearly half of total primary energy consumption [1], [2]. In line with the EU 36 energy policy, UK has outlined its own domestic targets where a reduction of 50% and 80% compared 37 to 1990 carbon emissions level were set respectively for 2027 and 2050 [3]. Among the many 38 solutions envisaged for the heat market, district heat networks (DH) offer the flexibility and capacity 39 for faster integration of low emission heat-generating sources for a smooth transition towards a low 40 carbon society [4]. It is projected that DH technology could supply cost effectively 14% and 43% of 41 the total UK heat demand in buildings by 2030 and 2050 respectively [1] [5]. Moreover, to keep pace 42 with the current development on reducing energy consumption in buildings through improving 43 thermal insulation involving construction materials, which affect heat demand in buildings, the DH 44 technology is undergoing significant improvement to reduce heat distribution losses, increase heat 45 generation efficiency and lower carbon emission [5].
3 58 legionella bacterium in the UK, domestic hot water storage tanks must kept at a temperature of about 59 60 °C, whereas 50 °C has to be guaranteed in one minute in the secondary circuit for the case of 60 instantaneous DHW preparation [6], [17]–[19]. In countries with large DH market, as for Denmark, 61 the comfort temperature instead has to reach 45 °C in 10 seconds according to national policy DS 439 62 [20]. Therefore, in low and ultra-low DH networks, with supply temperatures equal or below 50 °C, 63 DHW temperature would need to be increased to deliver sanitary water safely through, for example, a 64 separate heating device such as electric heaters or micro heat pumps, as presented by Yang et al. [21]– 65 [23].
66 Implementing LTDH requires, however, that the design and operation of heat emitting appliances in 67 buildings be correctly performed to achieve the desired thermal comfort. In existing buildings with 68 traditional high temperature radiators installation, it is crucial to carry out a correct diagnosis for 69 supply and return temperature based on prevailing ambient conditions. It is common practice in the 70 industry that hydronic radiators are oversized to afford indoor comfort in extreme short cold periods; 71 while for the majority of the heating season the installation will operate at part load and lower 72 operating temperatures will be adequate to satisfy heat loads [24]. For example, in well-developed 73 DH markets as in Denmark radiators are designed for typical heat supply at 70/40 °C; whereas in 74 Finland 80/60 °C was the common practice for high temperature radiators. This was reduced to 55/45 75 °C and 40/30 °C for medium and low temperatures radiators respectively [25]. In Sweden instead, 76 radiators with design temperatures higher than 60 °C were phased out since 1980s and current design 77 standards are 55/45 °C [26], [27].
4 86 This work addresses the specific need for considering lower heat supply temperature in UK heat 87 market as a prelude for lower energy consumption and carbon emission. In this context, the paper 88 presents a design strategy for effective optimisation of return water temperature in existing and future 89 heat networks installations. The proposed temperature optimization methodology, developed by the 90 authors in a previous study [30], was tested on an existing UK small-scale heat network case study. 91 Currently, there are not many meaningful studies investigating the transition of existing heat network 92 towards LTDH in the UK and this paper contributes directly to advancing the discussion on 93 implementing DH at national level and provides a tool to support the decision of designers and DH 94 operators.
95 2 Small scale DH case study
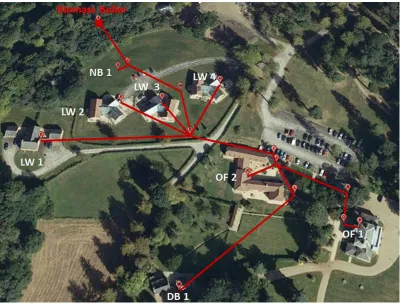
96 The case study represents an isolated small-scale DH network supplying space heating only to 97 different types of buildings located on a farmland north of Nottingham city, UK. Figure 1 shows the 98 aerial view of the estates and layout of the DH.
99
100
[image:4.595.72.473.424.728.2]5 103 The heat network is about 10 years old and serves eight buildings including two office buildings (OF 104 1 and OF 2), one domestic building (DB 1), four Live/Work buildings (LW 1 - LW4) and one newly 105 built Live/Work building (NB 1). Building NB 1 was connected to the DH network after the 106 completion of this study and was disregarded in this paper. The building LW 1 to LW4 combine the 107 activity of office work and living space environment. Table 1 shows occupancy type and floor area of 108 each building.
109 Table 1: Buildings’ highlights
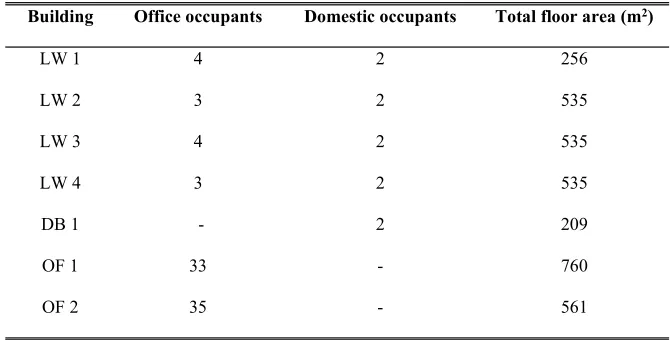
Building Office occupants Domestic occupants Total floor area (m2)
LW 1 4 2 256
LW 2 3 2 535
LW 3 4 2 535
LW 4 3 2 535
DB 1 - 2 209
OF 1 33 - 760
OF 2 35 - 561
110 111
112 2.1 Buildings construction properties and performance
113 The Estate combines a mix of different buildings characterized by different energy consumption, 114 activities and heating systems. Building OF 2, DB 1 and LW 1 are existing buildings which were 115 renovated before 2006 whereas building LW 2, 3 and 4 are identical new buildings constructed 116 according to UK Building Regulations 2006 Part L1A (Conservation of fuel and power in new 117 dwellings ) [31], [32]. The largest building of the estate OF 1, is used as office space and is also a 118 listed “Grade II” building according to the UK building regulations of historic and traditionally 119 constructed buildings [33]. To preserve the architecture heritage, this type of buildings cannot be 120 renovated and only the roof was replaced after being damaged. The construction data of the elements 121 of the buildings is summarized in Table 2.
[image:5.595.129.464.237.407.2]7 142 2.2 Heat network
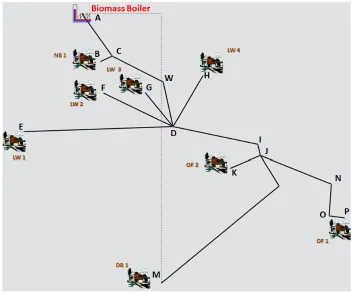
143 The DH network provides space heat (SH) for the estate’s buildings whereas DHW is provided 144 separately by instantaneous electric heaters. The heat for the DH network is supplied from a 199 kW 145 biomass condensing boiler during the heating season of September to May. The boiler installation 146 running cost benefits from Renewable Heat Incentive (RHI) scheme, a government scheme to support 147 renewable energy [35]. The biomass boiler uses locally grown and coppiced willow wood chips as 148 fuel. The DH installation also uses a 5 m3 buffer tank and a twin-head hot water circulating pump 149 equipped with variable speed controller. The DH network has a typical tree configuration and is 150 composed of a mix of double and twin pre-insulated pipes. A schematic view of the DH network is 151 presented in Figure 3.
152
153
154 Figure 3: Heat network schematic
155
[image:7.595.121.474.348.640.2]8 159 Table 3.
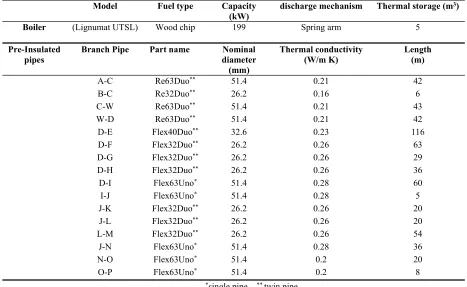
160 Table 3: Heat network design
161
Model Fuel type Capacity
(kW) discharge mechanism Thermal storage (m
3)
Boiler (Lignumat UTSL) Wood chip 199 Spring arm 5
Pre-Insulated
pipes Branch Pipe Part name diameterNominal (mm)
Thermal conductivity
(W/m K) Length(m)
A-C Re63Duo** 51.4 0.21 42
B-C Re32Duo** 26.2 0.16 6
C-W Re63Duo** 51.4 0.21 43
W-D Re63Duo** 51.4 0.21 42
D-E Flex40Duo** 32.6 0.23 116
D-F Flex32Duo** 26.2 0.26 63
D-G Flex32Duo** 26.2 0.26 29
D-H Flex32Duo** 26.2 0.26 36
D-I Flex63Uno* 51.4 0.28 60
I-J Flex63Uno* 51.4 0.28 5
J-K Flex32Duo** 26.2 0.26 20
J-L Flex32Duo** 26.2 0.26 20
L-M Flex32Duo** 26.2 0.26 54
J-N Flex63Uno* 51.4 0.28 36
N-O Flex63Uno* 51.4 0.2 20
O-P Flex63Uno* 51.4 0.2 8
162 *single pipe **twin pipe
163 The estate combination of old and new buildings meant different types of hydronic heat emitters were 164 installed. For example, the hydronic system of building OF 1, LW 1 and DB 1 are of plate radiator 165 type while the rest of the estate’s buildings have underfloor heating (UFH) system. The heater 166 emitters in each building were connected to the DH network through dedicated heat interface units 167 (HIU) which were made of one plate heat exchanger (HE).
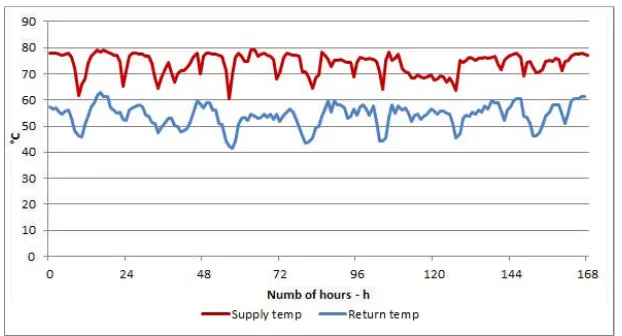
[image:8.595.64.531.127.414.2]9 176 served with plate radiators (OF 1, LW1 and DB 1) were set as high supply temperature. Figure 4 177 represents a sample of recorded hourly temperature variation of the heat network for a period of one 178 week during the heating season of 2014/2015. It was found that the yearly average supply and return 179 temperature of the heat network was 72/55 °C.
180
181 Figure 4: Monitored supply/return temperature of the heat network (20/02/15 to 27/02/15) 182
183 Therefore, this work identified an opportunity to set up a new strategy to optimizing the supply and 184 return temperatures at building level to reduce energy an emission of the whole heat network system. 185 2.3 Heat network benchmark thermal performance
186 The performance of the heat network was initially analysed to reflect the current strategy of 187 controlling thermal comfort in the buildings using night setback strategy. The heating loads associated 188 with each building connected to the heat network were modelled using IDA-ICE software dynamic 189 simulation, taking into account buildings construction properties, occupancy schedule and prevailing 190 local weather condition. Figure 5 illustrates the monthly average heat load of each building.
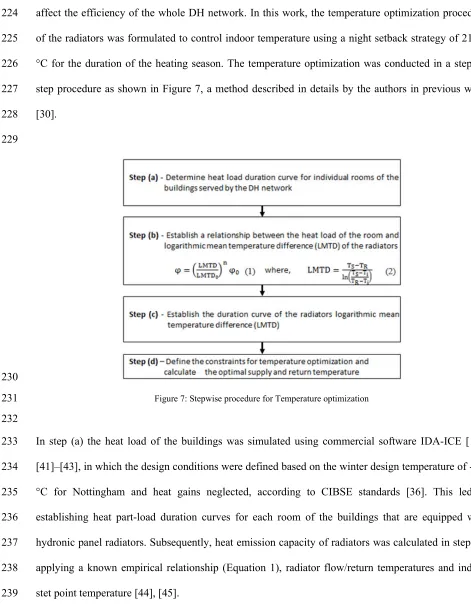
[image:9.595.143.454.170.338.2]12 224 affect the efficiency of the whole DH network. In this work, the temperature optimization procedure 225 of the radiators was formulated to control indoor temperature using a night setback strategy of 21/18 226 °C for the duration of the heating season. The temperature optimization was conducted in a step by 227 step procedure as shown in Figure 7, a method described in details by the authors in previous work 228 [30].
229
230
231 Figure 7: Stepwise procedure for Temperature optimization 232
233 In step (a) the heat load of the buildings was simulated using commercial software IDA-ICE [13], 234 [41]–[43], in which the design conditions were defined based on the winter design temperature of -3.9 235 °C for Nottingham and heat gains neglected, according to CIBSE standards [36]. This led to 236 establishing heat part-load duration curves for each room of the buildings that are equipped with 237 hydronic panel radiators. Subsequently, heat emission capacity of radiators was calculated in step (b) 238 applying a known empirical relationship (Equation 1), radiator flow/return temperatures and indoor 239 stet point temperature [44], [45].
0= 0 (1)
[image:12.595.36.507.66.676.2]13 241 where and o are actual and design heat rating of the radiator, LMTD and LMTDo the actual and 242 design logarithmic mean temperature difference and n is an empirical exponent (n=1.3 for panel 243 radiators [15]). The LMTD of the radiator exchanging heat with its surrounding can be given as:
= (2)
244 whereTS,TRandTiare the water supply and return and indoor operative temperatures respectively.
245 Presenting the LMTD of each radiator connected to the DH in the form of duration curves -step (c), an 246 upper limit LMTD curve (representing the worst case) was then constructed and the corresponding 247 water supply and return temperature were taken as the operating temperatures to be satisfied by the 248 heating system during the heating period. Finally, the threshold temperatures of the constructed 249 LMTD duration curve were identified, step (d), and the water supply temperature is set to an 250 appropriate value and held as a constraint while the water return temperature is allowed to vary and 251 considered as an objective function to optimize. The optimization procedure is based on calculating 252 the optimal combination of supply and return temperatures to deliver the needed LMTD for the worst 253 case curve which in turn produces the highest DH system efficiency and economic benefit to end-254 user.
255 4 Results and discussion
256 4.1 Temperature optimization of heating system in buildings with plate radiators
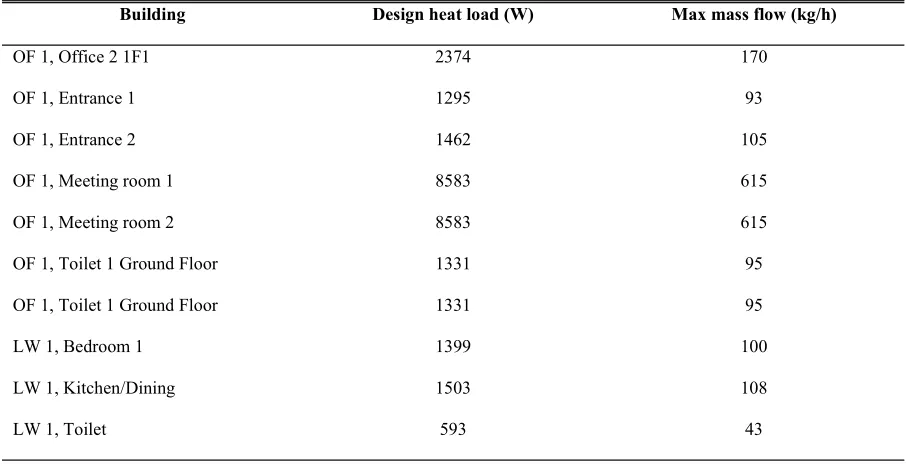
17 301 on legionella control in building, and an upper limit of 82°C as used in current UK high temperature 302 radiator design conditions. Likewise, the water return temperature constraint of 25 °C was considered 303 to be as close to the indoor room temperatures settings as practically possible. The mass flow rate 304 constraints, on the other hand, depend on the heat capacity of radiator and a design (maximum) value, 305 0, was assigned to selected room radiators as shown in and Table 7.
306
307 Table 7: Rooms design heat load and max mass flow rate for the rooms of the upper boundary LMTD duration curve Building Design heat load (W) Max mass flow (kg/h)
OF 1, Office 2 1F1 2374 170
OF 1, Entrance 1 1295 93
OF 1, Entrance 2 1462 105
OF 1, Meeting room 1 8583 615
OF 1, Meeting room 2 8583 615
OF 1, Toilet 1 Ground Floor 1331 95
OF 1, Toilet 1 Ground Floor 1331 95
LW 1, Bedroom 1 1399 100
LW 1, Kitchen/Dining 1503 108
LW 1, Toilet 593 43
308
[image:17.595.71.524.243.476.2]18 320
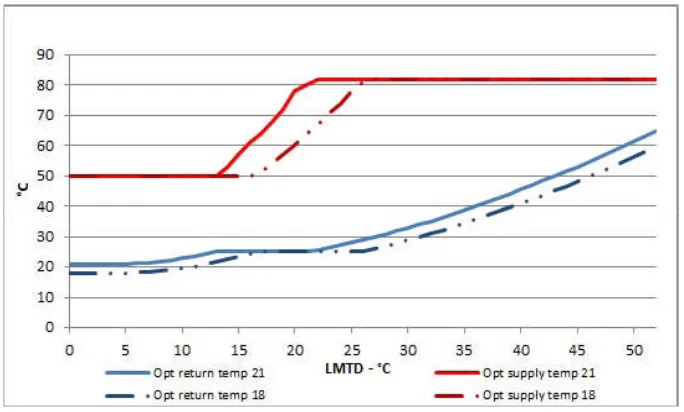
321
322 Figure 12: Step (d) - Optimal combination of radiator supply and return temperatures 323
324 This work shows particularly that it is possible to operate existing radiators arrangement at lower 325 return temperatures and still provide sufficient heat to maintaining indoor design temperature with 326 simple adjustment to heating controls. The optimisation conditions of the existing plate radiators over 327 the range of LMTDs would lead to a new average supply and return temperatures of 81/41 °C for the 328 buildings equipped with plate radiators over the considered heating season. However, the size of the 329 existing radiators has an impact on the capacity of guaranteeing the same indoor comfort when 330 lowering operating temperatures. Hence, the optimal temperatures obtained were influenced by the 331 UK design practise of using high temperatures and small that typically results in installing smaller 332 radiators. Therefore, improving energy efficiency in buildings served by DH could also benefit from 333 upgrading plate radiators installations.
[image:18.595.127.469.95.301.2]19 341 the whole DH network average return temperature. The current motivation tariff provides 1% 342 discount of the end-user’s energy bill for each 1 °C drop in return temperature below the network 343 average return temperature up to a maximum of 20% discount [49]. Applying the motivation energy 344 incentive in this study would discount the end user’s energy bill by 14% simply by reducing the return 345 temperature from the current average of 55 °C to the optimum average of 41 °C, savings that can be 346 afforded through higher overall system energy efficiency as discussed in the following section.
347 4.2 Heat network results: performance improvement
348 The operation of the DH network was reassessed based on the optimised water supply and return 349 temperature of 81/41oC using TERMIS software. It was also found in this case that the buildings with 350 UFH were operated unnecessary at high temperatures as the HIU blending valve was set at 60 °C, 351 causing higher return temperatures. Therefore, in the TERMIS model, it was assumed that supply and 352 return temperature for UFH system could be set at 40/30 °C to reflect current practice for UFH 353 systems operation. The analysis yielded a DH annual average hot water return temperature of 35.6 °C, 354 a drop of 19.4 °C compared to present operating temperature of 55 °C and a circulating pump flow 355 rate of 1450 kg/h compared to the reference case, as summarized in Table 8.
356 Table 8: TERMIS simulation: heat network comparison between reference and optimized scenario Heat Network results Reference case Optimized Scenario
Average return temperature (°C) 54.2 35.60
Energy generated (MWh) 395.03 393.75
Energy delivered (MWh) 380 380
Distribution losses (MWh) 15.03 13.75
Mass flow rate (kg/h) 3790 1450
Pressure (bar) 1.5 1.5
357
358 The monthly energy balances of the optimised DH network simulation results are presented in Figure 359 13. Compared to the benchmark results of energy consumption, the proposed strategy shows the 360 distribution losses make 3.6% of the total energy delivered, corresponding to an improvement of 10% 361 for the entire heat network.
[image:19.595.95.495.472.626.2]21 378 The biomass fuel (wood chips) properties used in the DH boiler had an estimated net calorific value 379 (NCV) of 3.5 kWh/kg for moisture content of 30% [53] and the annual mass of fuel burnt can be 380 expressed as follows:
= 1000 (3)
381 wheremfis the mass of fuel (tonne),Egis the annual energy generated (kWh), NCV is the net calorific
382 value of fuel and b is the relative efficiency of the boiler. Comparing the mass of fuel used in
383 reference and optimized case, it was estimated that a reduction of 9% in the fuel consumption was 384 achieved.
385 The curves proposed can also be used by a DH operator to plan a renovation strategy for improving 386 the performances of the system. For instance, working closely with the end-users, the rooms/radiators 387 aggregated in the worst LMTD curve of Figure 11 can be inspected and a replacement of the critical 388 heat emitters, as also reported by Østergaard and Svendsen [54], as well as a renovation of the 389 building envelop could be planned. Once these enhancements would be addressed, the curve of Figure 390 11 would be improved according to the level of renovation and as a consequence, new lower optimal 391 operating temperatures could be achieved in the systems.
392 5 Conclusion
393 This paper demonstrated that optimizing hot water supply and return temperatures in a district 394 heating system can improve the overall thermal performance of the network. The optimization 395 methodology was demonstrated through the study of a small scale DH network in UK that serves 396 a small estate buildings with a mix of activities, occupancy and type of heat emitters (radiators 397 and underfloor heating).
22 404 40/30 °C, the simulation of the heat network system using TERMIS software shows a reduction 405 of 19.4 °C in the average return temperature. This resulted in reducing the heat network heat 406 losses and boiler fuel consumption by 10% and 9% respectively. Therefore, the study 407 demonstrates the viability of the optimization method in improving district heat networks 408 through simple hot water temperature adjustment that is responsive to end users heat demand, 409 while affording the same level of comfort.
410 Finally, this study showed that energy efficiency of DH in the UK can be improved by fine 411 tuning supply and return temperatures and flow rates without causing invasive renovation of the 412 end user heating systems. Although it is mandatory under UK building regulation that heating 413 controls are installed in buildings, often it was found the controls perform poorly because they 414 were set incorrect setting by the end user. Therefore, DH operator’s direct engagement with end-415 users to provide technical support and customized energy bills based on the operation of the heat 416 installation is vital to the success of the strategy. For instance, the LMTD duration curves of the 417 radiators can be used by the DH operator to plan an appropriate renovation strategy to the 418 building envelope, the heating installations or both as a course to lowering operating 419 temperatures and improving overall heat network thermal performance.
420
421 Acknowledgments
422 The authors wish to thank SASIE Ltd, Hexgreave Estate and the Civil Engineering Department 423 of DTU, for sponsoring and providing all the support necessary to complete this research 424 project.
425
426 Reference
427 [1] DECC, “The Future of Heating : Meeting the challenge,” 2013. 428 [2] DECC, “Heat Pumps in District Heating: Final report,” 2016.
429 [3] Commitee on Climate Change, “The Fourth Carbon Budget: Reducing Emissions Through the
430 1990s,” 2010.
431 [4] DECC, “The Future of Heating: A strategic framework for low carbon heat in the UK,”
432 DECC, 2012.
433 [5] S. Frederiksen and S. Werner, District Heating and Cooling. Sweden: Studentlitteratur, pag.
434 408, 2013.
23 436 future sustainable energy systems.,”Energy, vol. 68, pp. 1–11, 2014.
437 [7] A. Dalla Rosaet al., “Toward 4 th Generation District Heating : Experience and Potential of 438 Low-Temperature District Heating,” 2014.
439 [8] P. K. Olsen, C. H. Christiansen, M. Hofmeister, S. Svendsen, and J.-E. Thorsen, “Guidelines 440 for Low-Temperature District Heating,” 2014.
441 [9] M. Brand and S. Svendsen, “Renewable-based low-temperature district heating for existing 442 buildings in various stages of refurbishment,”Energy, vol. 62, pp. 311–319, 2013.
443 [10] M. Kofinger, D. Basciotti, R. R. Schmidt, E. Meissner, C. Doczekal, and A. Giovannini, “Low 444 temperature district heating in Austria: Energetic, ecologic and economic comparison of four 445 case studies,”Energy, vol. 110, pp. 95–104, 2016.
446 [11] M. Brand, P. Lauenburg, J. Wollerstrand, and V. Zboril, “Optimal Space Heating System for 447 Low Energy Single-Family House Supplied by Low-Temperature District Heating,” in 448 Passivhusnorden, 2012.
449 [12] A. Dalla Rosa and J. E. Christensen, “Low-energy district heating in energy efficienty building 450 areas,”Energy, vol. 36, 2011.
451 [13] P. Ovchinnikov, A. and K. Strelets, “Utilization potential of low temperature 452 hydronic space heating systems: A comparative review,”Build. Environ., vol. 112, pp. 88–98,
453 2016.
454 [14] P. Weitzmann, “Modelling building integated heating and cooling systems,” 2004.
455 [15] B. Young, A. Shiret, J. Hayton, and W. Griffiths, “Design of low-temperature domestic 456 heating systems,” BRE, 2013.
457 [16] D. S. Østergaard and S. Svendsen, “Theoretical overview of heating power and necessary 458 heating supply temperatures in typical Danish single-family houses from the 1900s,” Energy 459 Build., vol. 126, pp. 375–383, 2016.
460 [17] B. S. Institution, BS 8558: Guide to the design, installation, testing and maintenance of 461 services supplying water for domestic use within buildings and their curtilages – 462 Complementary guidance to BS EN 806, Second. BSI, 2015.
463 [18] HSE, Legionnaires ’ disease. The control of legionella bacteria in water systems, Fourth edi. 464 Health and Safety Executive, 2013.
465 [19] HSE,Legionnaires ’ disease. Part 2: The control of legionella bacteria in hot and cold water 466 systems. Health and Safety Executive, 2014.
467 [20] “Danish Standard, DS 469 - Heating and cooling systems in buildings.” 2013.
468 [21] X. Yang, H. Li, and S. Svendsen, “Decentralized substations for low-temperature district 469 heating with no Legionella risk, and low return temperatures,” Energy, vol. 110, pp. 65–74,
470 2016.
471 [22] X. Yang, H. Li, and S. Svendsen, “Evaluations of different domestic hot water preparing 472 methods with ultra-low-temperature district heating,”Energy, vol. 109, pp. 248–259, 2016. 473 [23] X. Yang, H. Li, and S. Svendsen, “Energy, economy and exergy evaluations of the solutions 474 for supplying domestic hot water from low-temperature district heating in Denmark,” Energy 475 Convers. Manag., vol. 122, pp. 142–152, 2016.
476 [24] P. Lauenburg, “Temperature optimization in district heating systems,” in Advanced District 477 Heating and Cooling (DHC) Systems, Elsevier Ltd., 2016, pp. 223–240.
478 [25] S. Paiho and F. Reda, “Towards next generation district heating in Finland,” Renew. Sustain. 479 Energy Rev., vol. 65, pp. 915–924, 2016.
480 [26] Q. Wang, Low-temperature Heating in Existing Swedish Residential Buildings - Toward 481 Sustainable Retrofitting, no. October. 2016.
482 [27] B. Skagestad and P. Mildenstein,District Heating and Cooling Connection Handbook. 2002. 483 [28] R. Wiltshire, J. Williams, and A. Rajan, “The importance of energy quality in matching supply 484 and demand,” BRE press, 2012.
485 [29] CIBSE and ADE, Heat networks : Code of Practice for the UK Raising standards for heat 486 supply. CIBSE, 2015.
487 [30] M. Tunzi, D. S. Østergaard, S. Svendsen, R. Boukhanouf, and E. Cooper, “Method to 488 investigate and plan the application of low temperature district heating to existing hydraulic 489 radiator systems in existing buildings,”Energy, vol. 113, pp. 413–421, 2016.
24 491 fuel and power in new dwellings,”Off. Deputy Prime Minist., no. April, 2006.
492 [32] Office of the Deputy Prime Minister, “The Building Regualtions 2006: L2A- Conservation of 493 fuel and power in new dwellings,” no. April, pp. 1–39, 2006.
494 [33] English Heritage, “Energy Efficiency and Historic Buildings,” no. April, pp. 1–61, 2012. 495 [34] CIBSE,CIBSE Guide A - Environmental Design. 2006.
496 [35] Ofgem, “Ofgem non-domestic RHI for Great Britain.” [Online]. Available: 497
https://www.ofgem.gov.uk/environmental-programmes/non-domestic-renewable-heat-498 incentive-rhi/tariffs-apply-non-domestic-rhi-great-britain.
499 [36] CIBSE, “CIBSE Guide B: Heating , ventilating , air conditioning and refrigeration,” 2006. 500 [37] A. Dalla Rosa, R. Boulter, K. Church, and S. Svendsen, “District heating (DH) network design 501 and operation toward a system-wide methodology for optimizing renewable energy solutions 502 (SMORES) in Canada: A case study,”Energy, vol. 45, no. 1, pp. 960–974, 2012.
503 [38] Schneider Electric, “TERMIS software.” [Online]. Available: http://www.schneider-504 electric.com/en/product-range/61418-termis-software/.
505 [39] B. Elmegaard, T. S. Ommen, M. Markussen, and J. Iversen, “Integration of space heating and 506 hot water supply in low temperature district heating,”Energy Build., 2015.
507 [40] J. Danielewicz, B. M. A. Sayegh, N. Fidorów, and H. Jouhara, “Three-508 dimensional numerical model of heat losses from district heating network pre-insulated pipes 509 buried in the ground,”Energy, vol. 108, pp. 172–184, 2016.
510 [41] M. Maivel and J. Kurnitski, “Low temperature radiator heating distribution and emission 511 efficiency in residential buildings,”Energy Build., vol. 69, pp. 224–236, 2014.
512 [42] M. Maivel and J. Kurnitski, “Radiator and floor heating operative temperature and temperature 513 variation corrections for EN 15316-2 heat emission standard,”Energy Build., vol. 99, pp. 204–
514 213, 2015.
515 [43] D. S. Østergaard and S. Svendsen, “Replacing critical radiators to increase the potential to use 516 low-temperature district heating – A case study of 4 Danish single-family houses from the 517 1930s,”Energy, 2016.
518 [44] “European Standard - EN 442 -1 - Radiators and Convectors Part 1: Technical specifications 519 and requirements.” 2015.
520 [45] “European Standard - EN 442-2 - Radiators and Convectors Part 2: Test methods and rating.”
521 2015.
522 [46] R. Petitjean,Balancing radiator systems, vol. 3, no. 3. TA & Andersson AB, 2003.
523 [47] B. Xu, A. Huang, L. Fu, and H. Di, “Simulation and analysis on control effectiveness of TRVs 524 in district heating systems,”Energy Build., vol. 43, no. 5, pp. 1169–1174, 2011.
525 [48] D. Østergaard and S. Svendsen, “Space heating with ultra-low-temperature district heating – a 526 case study of four single-family houses from the 1980s,”Energy Procedia, vol. 116, pp. 226–
527 235, 2017.
528 [49] “Middelfart Fjernvarme [info and data in Danish],” 2015. [Online]. Available: 529 http://www.middelfartfjernvarme.dk/wp-content/uploads/2015/09/Middelfart-Fjernvarme-530 Indførelse-af-motivationstarif-PIXI-udgave.pdf. [Accessed: 01-Oct-2015].
531 [50] Z. Liao, M. Swainson, and a. L. Dexter, “On the control of heating systems in the UK,”Build. 532 Environ., vol. 40, no. 3, pp. 343–351, 2005.
533 [51] D. Schmidt et al., “Low Temperature District Heating for Future Energy Systems,” Energy 534 Procedia, vol. 116, pp. 26–38, 2017.
535 [52] CIBSE, “Energy efficiency in buildings - CIBSE Guide F,” CIBSE, 2016.
536 [53] Biomass energy centre, “Typical calorific values of fuels.” [Online]. Available: 537 http://www.biomassenergycentre.org.uk/portal/page?_pageid=75,20041&_dad=portal.
538 [54] D. S. Østergaard and S. Svendsen, “Replacing critical radiators to increase the potential to use 539 low-temperature district heating - A case study of 4 Danish single-family houses from the 540 1930s,”Energy, vol. 110, pp. 75–84, 2016.
25 546
List of symbols and acronyms
DH District heating
LTDH Low-temperature district heating
LMTD Logarithmic mean temperature difference (°C)
LMTD0 Logarithmic mean temperature difference at design condition (°C)
T Temperature difference between supply and return temperature (°C)
TRV Thermostatic radiator valve
SH Space heating
DHW Domestic hot water
Heating power at operating temperatures (W)
0 Nominal heating power at design conditions (W)
n Radiator exponent
Mass flow rate (kg/h)
0 Max mass flow rate at design conditions(kg/h)
cp Specific heat capacity of water (J/kg °C)
Ts Supply temperature (°C)
TR Return temperature (°C)
Ti Indoor temperature (°C)