Abnormal Task Driven Neural Oscillations in
Multiple Sclerosis: A Visuomotor MEG Study
Eleanor L. Barratt,
1Prejaas K. Tewarie,
1Margareta A. Clarke,
2Emma L. Hall,
1Penny A. Gowland,
1Peter G. Morris,
1Susan T. Francis,
1Nikos Evangelou,
2and Matthew J. Brookes
1*
1
Sir Peter Mansfield Imaging Centre, School of Physics and Astronomy, University of
Nottingham, Nottingham NG7 2RD, United Kingdom
2
Division of Clinical Neurology, Queen’s Medical Centre, University of Nottingham,
Nottingham NG7 2UH, United Kingdom
r r
Abstract:Multiple sclerosis (MS) is a debilitating disease commonly attributed to degradation of white matter myelin. Symptoms include fatigue, as well as problems associated with vision and movement. Although areas of demyelination in white matter are observed routinely in patients undergoing MRI scans, such measures are often a poor predictor of disease severity. For this reason, it is instructive to measure associated changes in brain function. Widespread white-matter demyelination may lead to delays of propagation of neuronal activity, and with its excellent temporal resolution, magnetoenceph-alography can be used to probe such delays in controlled conditions (e.g., during a task). In healthy subjects, responses to visuomotor tasks are well documented: in motor cortex, movement elicits a local-ised decrease in the power of beta band oscillations (event-related beta desynchronisation) followed by an increase above baseline on movement cessation (post-movement beta rebound (PMBR)). In visual cortex, visual stimulation generates increased gamma oscillations. In this study, we use a visuomotor paradigm to measure these responses in MS patients and compare them to age- and gender-matched healthy controls. We show a significant increase in the time-to-peak of the PMBR in patients which correlates significantly with the symbol digit modalities test: a measure of information processing speed. A significant decrease in the amplitude of visual gamma oscillations in patients is also seen. These findings highlight the potential value of electrophysiological imaging in generating a new under-standing of visual disturbances and abnormal motor control in MS patients.Hum Brain Mapp 00:000– 000, 2017. VC2017TheAuthorsHumanBrainMappingPublished byWileyPeriodicals,Inc.
Key words:multiple sclerosis; post-movement beta rebound; visual gamma; MEG; visuomotor abnor-malities; neuronal oscillations
r r
Contract grant sponsor: Multiple Sclerosis Society; Contract grant sponsor: UoN Studentship is the PhD funding from the Universi-ty of Nottingham; Contract grant sponsor: MRC New Investigator Research Grant; Contract grant number: MR/M006301/1; Con-tract grant sponsor: MRC funded MEGUK Partnership; ConCon-tract grant number: MR/K005464/1
*Correspondence to: M. J. Brookes; Sir Peter Mansfield Imaging Centre, School of Physics and Astronomy, University of
Nottingham, University Park, Nottingham NG7 2RD, United Kingdom. E-mail: [email protected]
Received for publication 30 August 2016; Revised 20 December 2016; Accepted 17 January 2017.
DOI: 10.1002/hbm.23531
Published online 00 Month 2017 in Wiley Online Library (wileyonlinelibrary.com).
rHumanBrainMapping 00:00–00 (2017) r
VC 2017TheAuthorsHumanBrainMappingPublished byWileyPeriodicals,Inc.
INTRODUCTION
Multiple sclerosis (MS) is an inflammatory, demyelinat-ing and neurodegenerative disease of the central nervous system, affecting around 1 in 500 people (Mackenzie et al., 2014). Patients have a wide range of symptoms such as fatigue, problems with vision, limb movement, sensation and balance. Cognitive symptoms are common, with infor-mation processing speed being one of the first affected domains (Strober et al., 2009). Magnetic resonance imaging (MRI) is commonly used for diagnosis, and shows white matter lesions which are thought to affect around 60% of patients (Ormerod et al., 1986). However, white matter lesion load does not necessarily correlate with physical disability or cognitive impairment (Barkhof, 2002). This clinicoradiological paradox has led to the search for alter-native verifiable markers of clinical status. Recent findings suggest that structural pathology goes well beyond classi-cal white matter lesions, ranging from diffuse white matter damage (Kutzelnigg et al., 2005), to atrophy of the white and grey matter (Sanfilipo et al., 2006), including deep grey matter structures such as the thalamus (Houtchens et al., 2007) and cortical lesions (Sethi et al., 2013; Tallan-tyre et al., 2010). This suggests that disease status in MS is not the result of one structural deficit (i.e., white matter lesions), but rather results from a weighted combination of several types of structural pathology. It has been hypoth-esised that any type, or combination of structural damage will lead to disrupted brain function (Schoonheim et al., 2015). This implies that the characterisation of brain func-tion and its disturbance in MS may prove key to determin-ing the neural underpinndetermin-ings of cognitive disturbances and physical disabilities. Neuroimaging investigations using techniques such as functional MRI (fMRI) and mag-netoencephalography (MEG) are therefore of growing importance.
Previous fMRI studies have used a variety of tasks to determine the impact of demyelination on function, assess-ing visual, memory, and motor processes (Mainero et al., 2004; Reddy et al., 2000; Rocca et al., 2002), as well as cog-nitive function (Schoonheim et al., 2013a; Staffen et al., 2002). General findings suggest altered patterns of activa-tion during attenactiva-tion and memory tasks (Mainero et al., 2004), a change in resting-state activity (Liu et al., 2011), and disrupted connectivity (Dineen et al., 2009; Filippi and Rocca, 2013; Tewarie et al., 2015). However, findings from both task-based and resting-state studies have been some-what contradictory (Schoonheim et al., 2015). In addition, a recent multimodal fMRI/MEG study has shown that MEG measures are more sensitive for detecting disease-induced effects in cortical functional networks than fMRI (Tewarie et al., 2015), suggesting that MEG provides a good candidate to study perturbed brain function in MS patients.
MEG is a noninvasive method of assessing electrophysi-ological activity, via the measurement of extracranial mag-netic fields generated by synchronised current flow in
neuronal cell assemblies. Signals are dominated by oscilla-tions resulting from the rhythmic activity of large clusters of neurons. Such neuronal oscillatory activity has been a topic of significant research in recent years, and many studies now show robust and focal changes in oscillations in response to simple tasks. For example, oscillatory changes during visuomotor tasks (visual and motor stimu-li) have been well documented: in visual cortex, an increase in gamma (30–70 Hz) oscillations is observed in response to a visual stimulus (Adjamian et al., 2004; Brookes et al., 2005). Such gamma oscillations have been linked to a variety of behaviours such as visual perception (Melloni et al., 2007), attention (Fries et al., 2001), memory (Jensen et al., 2007), and motor control (Cheyne et al., 2008). Local field potential (LFP) recordings in animals support these findings, revealing stimulus induced gamma oscillations with varying amplitude and/or frequency depending on contrast (Henrie and Shapley, 2005), orienta-tion Hill et al., 2000), and velocity (Friedman-Hill et al., 2000). In motor cortex, stimulus-induced oscilla-tory changes are dominated by the beta band (13–30 Hz) which exhibits decreased power during movement (Jasper and Penfield, 1949) followed by a power increase (above baseline) on movement cessation (Neuper and Pfurtschel-ler, 2001). These phenomena are known as the event-related beta desynchronisation (ERBD), and the post-movement beta rebound (PMBR), respectively. Their origin is not understood fully; however, large beta amplitudes are believed to reflect inhibition (Cassim et al., 2001; Gaetz et al., 2011) and thus the ERBD might reflect an increase in local processing during motor activity, while the PMBR implies the inhibition of neuronal networks following activity (Alegre et al., 2008; Solis-Escalante et al., 2012). Oscillations have also been closely associated with com-munication in the brain (Fries, 2005). Beta oscillations have been linked to resting-state networks (Brookes et al., 2011a; Hipp et al., 2012; Siegel et al., 2012) and the PMBR in particular has been associated with long-range connec-tivity in the sensorimotor system (Donner and Siegel, 2011; Liddle et al., 2016; Vidaurre et al., 2016). Similarly gamma oscillations have, for example, been related to feature binding in the visual system (Tallon-Baudry and Bertrand, 1999). Such links between oscillations and connectivity suggest that oscillations themselves must depend heavily on the underlying (grey and white matter) myeloarchitec-ture (Hunt et al., 2016). It follows that such oscillations would likely be perturbed by the distributed myelin dam-age associated with MS.
undertake a visuomotor task. We test the hypothesis that the robust and well-characterised neural oscillatory pro-cesses induced by this task will be perturbed significantly in patients compared to age- and gender-matched healthy controls.
METHODS
Participants
The study was approved by the National Research Ethics Service and all participants gave written informed consent. MS patients (diagnosed with clinically definite MS (Polman et al., 2011) and no other known neurological conditions) were recruited from the Queen’s Medical Cen-tre in Nottingham, with healthy control subjects recruited to match the MS patient group based on age and gender. A total of 21 patients (12 females, age 42611 years (mean 6 SD)) and 22 healthy controls (12 females, age 42 6 12 years (mean6SD)) were recruited (see Table I for further details).
Severity and Cognitive Scores
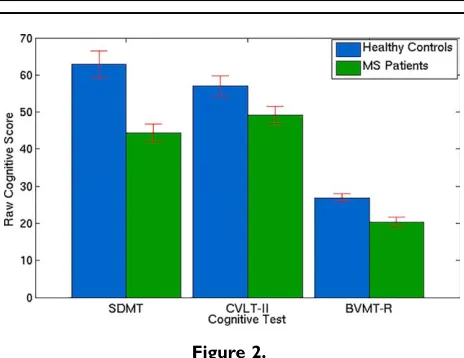
Disease severity was assessed by the Multiple Sclerosis Severity Score (MSSS) (Roxburgh et al., 2005) which deter-mines disability progression in patients and is calculated based on disease duration and the expanded disability sta-tus scale (EDSS). All participants also undertook cognitive tests using the Brief International Cognitive Assessment for Multiple Sclerosis (BICAMS) (Langdon et al., 2012). This comprised the Symbol Digit Modalities Test (SDMT) (Smith, 2013), the California Verbal Learning Test (CVLT-II) (Delis et al., 2000), and the Brief Visualspatial Memory Test – Revised (BVMT-R) (Benedict et al., 1996). SDMT is a measure of information processing speed and involves participants pairing single digits with abstract symbols. The CVLT-II provides a measure of verbal memory and requires participants to recall lists, while the BVMT-R pro-vides a measure of visual memory and requires partici-pants to draw abstract shapes from memory. Patient cognitive scores were normalised using a z-score taking age, gender, and education into consideration. Subjects also completed a Hospital Anxiety and Depression Scale (HADS) questionnaire.
Task Paradigms
The visuomotor task comprised a centrally presented vertical square grating (angular field of view78both hor-izontally and vertically, spatial frequency53 cycles per degree, contrast5100%) shown for 2 s followed by a 7 s fixation period during which participants viewed a cen-trally presented fixation cross. Participants were asked to press a button once, with their right index finger, in response to the appearance of the grating on the screen.
The task consisted of 45 trials, lasting just under 7 min in total. In a separate experiment, resting-state data were also acquired in the same subjects. Subjects were asked to lie still and ‘think of nothing’ while MEG data were recorded continuously for 10 min. Patients were shown a fixation cross throughout the resting-state scan. All MEG data were acquired with participants in a supine position.
Data Acquisition
MEG data were acquired using a 275-channel whole-head CTF system (MISL, Coquitlam, Canada) operating in third-order synthetic gradiometer configuration, at a sam-pling frequency of 600 Hz. Prior to acquisition, three local-isation fiducial coils were placed on the head (at the nasion, and left and right preauricular points). These coils were energised periodically to continuously localise the position of the subject’s head in the scanner. A 3D digitisa-tion of the subject’s head shape and fiducial locadigitisa-tions were obtained using a 3D digitiser (polhemus Inc., Ver-mont) system. Subsequent co-registration of the MEG data to an anatomical MRI (acquired using a 7 T Philips Achieva MRI scanner, or 3 T Philips Achieva for one par-ticipant, at 1 mm3isotropic voxel resolution) was achieved
via matching the digitised head surface to the equivalent surface extracted from the anatomical MRI.
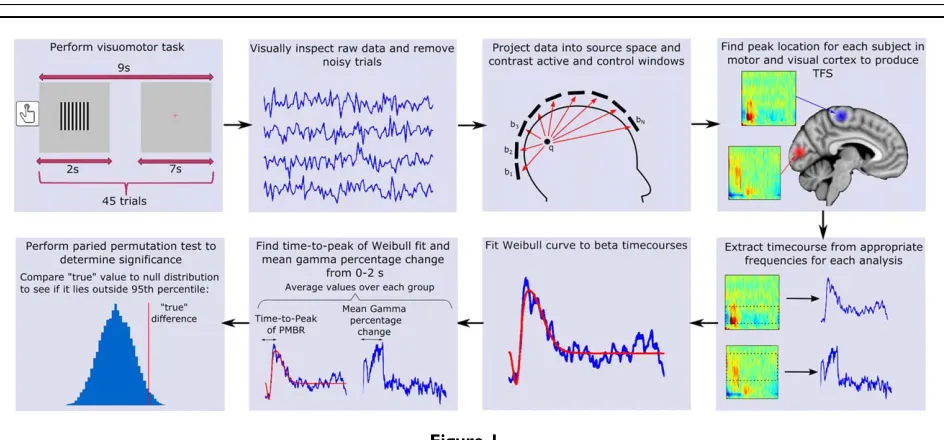
Data Analysis: Visuomotor Data
An overview of our data processing methodology is shown in Figure 1. MEG data were inspected visually and noisy trials were removed. Trials with head movement
[image:3.612.313.553.101.224.2]>7 mm (Euclidean distance) from the starting position were also removed, leaving 4362 (mean6SD) trials for healthy controls, and 4262 (mean6SD) for MS patients (there was no significant difference between patient and control groups in the number of trials remaining). Lead fields were computed using a dipole approximation (Sar-vas, 1987) and a multiple-local-spheres head model
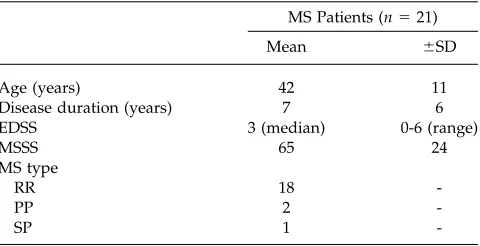
TABLE I. Descriptive variables for MS patients
MS Patients (n521)
Mean 6SD
Age (years) 42 11
Disease duration (years) 7 6
EDSS 3 (median) 0-6 (range)
MSSS 65 24
MS type
RR 18
-PP 2
-SP 1
-EDSS5expanded disability status scale; MSSS5multiple sclerosis severity score; RR5relapsing–remitting; PP5primary progres-sive; SP5secondary progressive.
rNeuralOscillations inMultipleSclerosisr
(Huang et al., 1999). A scalar beamformer (synthetic aper-ture magnetometry; Robinson and Vrba, 1998) was used to project MEG data into source space. Images showing gam-ma band power change were generated by contrasting 30–70 Hz power in an active window of 0–2 s, and a con-trol window of 5–7 s, relative to stimulus onset. Images showing the spatial signature of task-induced beta band power change were generated by contrasting oscillatory power in the 13–30 Hz band, using an ‘active’ window of 0–1 s and a ‘control’ window of 1–2 s relative to the button press. These windows were chosen to obtain the largest response by contrasting the ERBD to the PMBR. In a post-hoc analysis, we also aimed to separate the ERBD and PMBR spatially; to this end, we contrasted a 0–0.5 s active window to a 6–6.5 s control window to assess the spatial location of ERBD. We further contrasted a 0.5–3 s active window to a 4–6.5 s control window to assess the spatial location of PMBR (all times relative to button press). In generating all the above images, to optimise spatial specif-icity, data covariance matrices used for beamformer weights calculation were generated using band-limited data, averaged across active and control windows. Both our beta and gamma analysis produced pseudo-t-statistical images for each participant which were used to determine the peak location (location of the strongest response) of beta band power change in motor cortex during move-ment, and the peak increase in gamma oscillations in visu-al cortex during presentation of the grating. These locations, derived individually for each subject, were then used in subsequent analysis.
Timecourses measuring the evolution of electrical activi-ty at each peak location (known as virtual sensor time-courses) were extracted, again using a scalar beamformer.
Here, beamformer weights were calculated using a covari-ance matrix generated from the entire dataset, and fre-quency filtered in 1–150 Hz; this enabled derivation of time–frequency measurements spanning the whole trial length and showing task-induced change in oscillatory amplitude in all frequency bands. Virtual sensor time-courses were filtered into 23 overlapping frequency bands in the range of 1–100 Hz. For each frequency band, a Hil-bert transform was used to compute the amplitude enve-lope of oscillations, which was averaged across trials. Via concatenation of these envelope timecourses in the fre-quency dimension, a time–frefre-quency spectrogram (TFS) was derived showing the percentage change in the Hilbert envelope of the oscillations in all frequency bands relative to a baseline; baseline was defined in the 5.8–6.9 s window relative to the button press for the motor response, and the 5–7 s window with respect to stimulus onset for the visual response. TFSs were averaged across participants in both groups.
[image:4.612.71.543.68.288.2]TFSs were further analysed to test for differences between patients and controls in both the temporal signa-ture of the movement induced beta band response and the magnitude of the visual gamma response. For visual gam-ma, the mean amplitude (in the 0–2 s time window and 30–70 Hz frequency range) was calculated for each group and the difference between groups was assessed. To test for differences in the timing of the beta rebound, the 13–30 Hz band was extracted from the TFS and modelled using a two-parameter Weibull probability density distribution. This function has been shown previously to be highly suitable for modelling beta band timecourses (Liddle et al., 2016). The Weibull probability density distribution is given by
Figure 1.
f tð Þ5b a
t a
b21
e2 t a
ð Þb
; (1)
whereais the scale parameter determining the width of the peak andbis the shape parameter that determines symme-try. Beta envelope modulation was modelled using two sep-arate Weibull curves, one representing the ERBD and the other the PMBR. The ERBD was modelled using a Weibull function with a scale parameter (a) ranging from 280 to 690 ms and a shape parameter (b) of 3 (roughly symmetrical). The PMBR was modelled with a scale parameter (a) of 500–2500 ms and a shape parameter (b) ranging from 1 (neg-ative skew) to 6 (positive skew). These parameters were cho-sen to provide a good fit to all subjects. These curves were entered as predictors into a series of general linear models for each participant’s beta timecourse. The model with the best fit was chosen, and the time-to-peak of the rebound found. Fitting was applied to individual subjects and results averaged. Note that computing time-to-peak using the fit (rather than the data) reduces the effect of noise.
To determine statistical significance of the difference between healthy controls and MS patients, a paired permuta-tion test was used: MS patients were matched with their healthy controls and the mean difference in the parameter of interest (gamma amplitude or beta time-to-peak), between all matched pairs was found. This was then repeated 20,000 times to generate a null distribution; on each iteration, the healthy control and patient in each pair were swapped ran-domly before recalculating the mean difference. In this way, we reasoned that if no genuine difference between groups was apparent, the labelling of the patient/control pairs would be meaningless and hence the genuine difference (with patients and controls labelled correctly) would fall inside the null distribution. ThePvalue was determined by comparing the genuine value to the null distribution, assum-ing a two-tailed test (i.e., time-to-peak of the beta response could be faster or slower in patients relative to healthy con-trols; similarly gamma amplitude in patients could be greater or less than matched healthy controls).
Data Analysis: Resting-State Data
The resting-state data were used to test for differences in the resting amplitude of visual gamma and motor beta oscillations between groups. MEG data were inspected visual-ly; noisy data segments and data segments with head move-ment>7 mm (Euclidean distance) from the starting position were removed. Segments were defined as contiguous 10 s windows; following visual inspection, 5863 (mean6SD) segments remained for healthy controls and 5568 segments remained for MS patients (no significant difference). Regions of interest (ROIs) were generated in the left motor cortex and visual cortex for each subject. As above, a scalar beamformer was used to project data to these regions (using a covariance window spanning 1–150 Hz and a time window spanning the entire experiment). Following this, a Hilbert envelope was
used to generate the mean (over all time) oscillatory ampli-tude across a range of frequencies between 1 and 100 Hz. These amplitude spectra were averaged over participants, and between group differences assessed.
RESULTS
The task was well performed by all participants. Two MS patients had unusable MEG datasets caused by dental work and so these subjects and their paired healthy control sub-jects were removed from all analyses. Two patients were removed from the beta band analysis since no beta band response could be robustly identified, leaving a total of 17 MS patients (of which 2 were left-handed, 2 were ambidex-trous, and the remainder right-handed) and 17 matched healthy control pairs (of which 1 was left-handed, 1 was ambidextrous, 14 were right-handed, and data were unavailable for 1) for the motor beta analysis. A single MS patient, whose gamma response lay more than 3 absolute deviations from the median of the MS group, was removed from the visual gamma analysis, leaving 18 MS patients and healthy controls. The raw cognitive tests compared matched pairs of 18 MS patients and healthy controls.
Cognitive Tests
Figure 2 shows that the healthy control subjects per-formed significantly better than MS patients in 2 out of the 3 cognitive tests (SDMT: P<0.0001, BVMT-R: P<0.0001), with a trend (CVLT-II:P50.06) observed in the third. The SDMT score (healthy control score56364 (mean6SE), MS patient score54462) is out of 102, the CVLT-II score (healthy control score55763, MS patient score54962) is out of 80, and the BVMT-R score (healthy control score52761, MS patient score52061) is out of 36. MS Patients were also found to be significantly more anxious and depressed on average compared to healthy controls (HADS: MS patient score51662, healthy control score5961,P50.009, maximum score possible is 42).
Motor Response
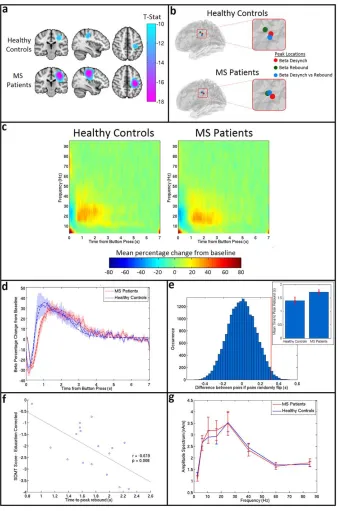
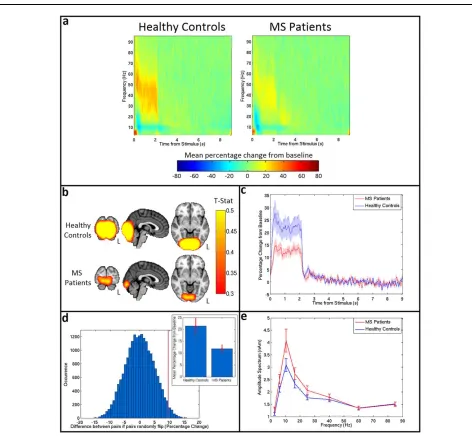
Results of the beta band analysis in sensorimotor cortex are shown in Figure 3. Figure 3a shows the beamformer images depicting the spatial location of maximum beta change (i.e. contrasting windows encapsulating ERBD and PMBR). Images are averaged over subjects within each group. Importantly, there is no significant difference in the spatial location of the peaks between groups (MNI co-ordinates for healthy controls: [23766, 22868, 41612] (mean6SD), MNI co-ordinates for MS patients [23665, 22669, 4767]). Figure 3b shows the results of a post-hoc analysis in which the peak location representing maximum beta change (shown here in blue) is contrasted with the peak location of ERBD and PMBR. In both groups, as would be expected from previous work (Fry et al., 2016; rNeuralOscillations inMultipleSclerosisr
Jurkiewicz et al., 2006), a significant anterior shift in the location of PMBR relative to ERBD was observed. Howev-er, there was no significant difference in peak locations for either metric between groups. Figure 3c shows the TFSs, extracted from locations of interest (based on maximum beta change; i.e., the blue markers in Fig. 3b) in primary sensorimotor cortex. The TFS for MS patients is shown on the right and the TFS for healthy controls on the left. Note that, for both groups, the expected decrease in oscillatory power in the beta band immediately after the button press is apparent, and is followed by an increase above baseline on movement cessation. Further visual inspection suggests a lag in beta response time for MS patients compared to healthy controls. The mean beta responses and associated Weibull fits are shown in Figure 3d. The red curve shows the case for patients and the blue curve shows the case for controls. Note again the apparent PMBR delay in patients. Figure 3e shows the measured time difference alongside an empirically derived null distribution, with results indi-cating that the delay in time-to-peak of the PMBR is signif-icant (P50.03; two-tailed test). The measured time-to-peak of the beta response in both groups is shown in the inset image. It is noteworthy that the significant difference in time to peak of the PMBR occurs despite no measurable difference (P50.2) in the mean reaction time (RT) between controls (0.4260.03 s) and patients (0.4660.02 s). There was also no significant correlation in MS patients between reaction time and the time-to-peak of the PMBR (P50.3). Further post-hoc analysis revealed that the significant dif-ference in PMBR time-to-peak was also measurable at the peak location of ERBD (P50.04; two-tailed test). The peak location of PMBR revealed the same pattern, but the effect failed to reach significance using a two-tailed test. Figure 3f shows that, in MS patients, a significant negative corre-lation (r5 20.62, P50.008) exists between the time-to-peak of the PMBR and SDMT score, suggesting that
patients who performed worse on the test had a longer delay in their peak rebound time. This relationship was not seen in healthy controls (r5 20.18, P50.48). (Note however that in controls, correlation was measured between time-to-peak and raw cognitive score, as a cor-rected score does not exist). No correlations were found between time-to-peak and any other MS severity or cogni-tive score. Finally, Figure 2g shows the amplitude spec-trum of oscillations in sensorimotor cortex for resting-state data acquired in the same subjects. There was no signifi-cant difference in the amplitude at any frequency.
Visual Response
Figure 4 shows the results of the gamma band analysis in visual cortex. Figure 4a shows the TFS plots for healthy controls (left) and MS patients (right), extracted from regions of interest in visual cortex. As expected, a strong increase in the gamma band activity is seen during stimu-lation for both groups. However, this response is dimin-ished in MS patients. This finding is echoed in the t-stat images in Figure 4b, which show a weaker response in MS patients. Plotting the timecourse of the mean gamma per-centage change from baseline for patients (red) and con-trols (blue) (Fig. 4c) shows this clear reduction in the patient response. The increase in gamma power is signifi-cantly lower (P50.04) in patients than healthy controls, dropping from 2164% (mean6SE) for healthy controls to 1262% (mean6SE) for MS patients (see inset of Fig. 4d). This was demonstrated by a paired permutation test shown in Figure 4d; here the genuine difference between groups is shown by the red line, and the empirical null distribution is shown in blue. There were no measurable correlations between visual gamma power and cognitive, or illness severity scores. Finally, Figure 4e shows the amplitude spectrum for an ROI in visual cortex (MS patients in red, healthy controls in blue) during the resting state. No significant difference was seen at any frequency (although the apparent change in alpha oscillations is in some agreement with a previous finding (Van der Meer et al., 2013)) meaning that the significant effect of MS on gamma oscillations induced by visual stimulation occurs despite no effect on resting state gamma amplitude.
DISCUSSION
[image:6.612.64.296.70.249.2]Changes in MEG-derived electrophysiological activity in MS patients have been documented previously (Cover et al., 2006; Hardmeier et al., 2012; Schoonheim et al., 2013b; Tewarie et al., 2013, 2014b; Van der Meer et al., 2013), but to date, relatively little work has been undertak-en to study task-induced changes. In this study, we mea-sured the neural oscillatory response, in motor and visual cortices, in MS patients and matched healthy control sub-jects. Our results show that, although the characteristic motor and visual responses were present in patients, they were perturbed significantly relative to controls.
Figure 2.
Figure 3. Beta band motor response. (a)Average t-stat images for con-trols (top) and patients (bottom) contrasting 0–1 s to 1–2 s from button press in the beta (13–30 Hz) band. Images are shown on the same scale. (b) Average peak locations for healthy controls (top) and MS patients (bottom). The peak loca-tion for beta change is shown in blue, the localoca-tion of maximum ERBD is shown in red, and the location of maximum PMBR in green.(c)TFSs for healthy controls (left) and MS patients (right) showing the mean percentage change in oscillatory power com-pared to baseline in response to a single button press.(d) The averaged beta response across all MS patients (red) and healthy controls (blue) with the SE shaded. The solid lines show the mean of the original responses, the dashed lines show the mean of the Weibull fits for each group. (e) A paired permutation
test run on the rebound time for 20,000 iterations yielded a P
Specifically, the time-to-peak of the PMBR was increased in MS patients; this was despite no measurable increase in reaction time, no correlation between reaction time and time-to-peak, and no difference in the amplitude of motor cortex beta oscillations in the resting state. Interestingly, the time-to-peak of the PMBR demonstrated a significant correlation (after multiple comparison correction) with the
[image:8.612.66.538.72.509.2]SDMT score (a measure of information processing speed), potentially suggesting a link to measurable behaviour. A significantly decreased gamma band response to visual stimulation was also observed and again this occurred despite a finding of no difference in resting-state gamma amplitude in visual cortex. Overall these findings suggest that significant value can be found in measuring
Figure 4. Visual gamma change. (a) TFS for controls (left) and patients (right) showing the mean percentage change in oscillatory power compared to baseline in visual cortex.(b)Averaget-stat images for controls (top) and patients (bottom) contrasting 0–2 s to 5– 7 s from stimulus onset in the gamma (30–70 Hz) band. Images are shown on same scale. (c) Mean gamma (30–70 Hz) time-courses for healthy controls (blue) and MS patients (red) with the SE shown shaded.(d) A paired permutation test, yielding a
electrophysiological responses to visuomotor stimuli in MS patients. This might prove to be a useful avenue of research to characterise visual and motor deficiencies in MS.
The increased delay in PMBR in patients suggests a gen-eral slowing of the beta response. Given that this delay was observed in the absence of any measurable change in reaction time, it is likely that it represents a genuine patho-physiological aspect of the disease. Although observed robustly, the beta response during motor activity is not fully understood. A weight of literature suggests that beta oscillations are a marker of cortical inhibition. According to this theory, desynchronisation results from the activa-tion of small patches of cortex serving some aspect of motor output, while the rebound is related to the return of those cortices to their original state (Pfurtscheller and Da Silva, 1999). This theory also emphasizes a network hypothesis, which suggests that the rebound is caused by active inhibitory input to the motor cortex (Gilbertson et al., 2005) which facilitates motor control by preventing further unwanted movements. This is supported by the fact that the PMBR does not develop until after childhood (Gaetz et al., 2010), an observation that might be related to the difficulty that young children experience in fine motor control. The inhibition theory is also supported by in vivo measurement and perturbation of neurochemistry. Neural oscillations are likely to reflect a balance between excitato-ry and inhibitoexcitato-ry neurotransmission, which is mediated, in part, by glutamate and GABA, respectively. Previous find-ings using magnetic resonance spectroscopy (MRS) sug-gest a correlation between GABA and beta dynamics (Gaetz et al., 2011). Further, pharmacological manipulation of GABAergic inhibition also generates measurable changes in the beta envelope (Hall et al., 2010, 2011; Muthukumaraswamy et al., 2013). In this context, the per-turbed PMBR in patients could relate to altered levels of GABAergic inhibition and this is supported by a finding of significantly lower GABA levels in sensorimotor cortex in MS patients (Cawley et al., 2015). A competing, but not mutually exclusive, hypothesis regarding PMBR is that it relates to long range communication between distal brain areas. Evidence for this has come largely from connectivity studies which show significant temporal correlation in the resting and task positive beta envelopes in left and right primary motor cortices (Brookes et al., 2011, 2011b; Hall et al., 2013), and also increased coherence during the PMBR following a self-paced motor task (O’Neill et al., 2015; Vidaurre et al., 2016). Given this link to long-range connectivity, coupled with (A) the well characterised demyelination in MS (Calabrese et al., 2010; Steenwijk et al., 2015), (B) the known role of myelin in neuronal con-duction velocity (Goldman and Albus, 1968; Smith and Koles, 1970), and (C) the strong links between myeloarchi-tecture and neural dynamics and connectivity (Helbling et al., 2015; Hunt et al., 2016), it is unsurprising that the timing of the PMBR is delayed. Indeed we speculate that
the reduction in white matter integrity, inherent to MS, could relate to a decreased ability to inhibit motor activity quickly, and hence explain why this process is slowed.
One of the main goals of functional imaging in MS is to generate biomarkers that relate significantly to cognitive decline in patients. Our demonstration that the time-to-peak of the PMBR in patients correlates negatively with the patient’s corrected SDMT score is therefore of signifi-cant interest, particularly given that reduction in informa-tion processing speed has been shown to be the most affected cognitive domain in MS (Kail, 1998; Litvan et al., 1988; Strober et al., 2009). While the reason for this correla-tion is unclear, it could relate to the putative role of beta oscillations as a mechanism by which the brain facilitates a forward internal model of desired movement. For exam-ple, Tan et al. (2016) show that the amplitude of the PMBR correlates negatively with uncertainty in feedforward esti-mations. More generally, Cao and Hu (2016) suggest that the beta rebound might not only correlate with estimation uncertainty but also reflect an updating process of the for-ward model. Reduced information processing speed in MS patients, as indicated by the lower SDMT scores, would likely lead to increased uncertainty and error on the for-ward model; such effects may well drive the correlation between SDMT scores and the time to PMBR peak observed here. However, we should also point out that correlative findings in such small sample sizes should be interpreted cautiously; further verification of this relation-ship in a larger sample size is therefore critical before such links can be made. We also show that no relationship was found between the time-to-peak and physical disability. However, patients had a median EDSS score of 3, sugges-ting moderate disability of one “functional system,” for example, bladder, vision, and sensations (or multiple mild disabilities in a few systems), but no mobility issues. It could be for this reason that there is no correlation between the motor response and disability.
Gamma oscillations have been observed consistently using intracranial and noninvasive electrophysiological recordings. These oscillations are likely generated in pyra-midal cell populations synchronized by GABAergic inter-neurons (Gonzalez-Burgos and Lewis, 2012), and previous work (Buzsaki and Wang, 2012; Fries, 2009) suggests that such oscillations might offer a potential mechanism for information coding in the brain, particularly since gamma amplitudes have been consistently linked to task perfor-mance (Dickinson et al., 2015; Edden et al., 2009). In this study, MS patients were found to have a significant reduc-tion in the amplitude of visual gamma oscillareduc-tions in response to a black and white grating, compared with healthy controls. Vision problems are often experienced by MS patients. In fact, a study examining 2265 patients reported that 82% experience vision problems, with 41% reporting the impact of the problem as ‘moderate’ or ‘high’ (Hemmett et al., 2004). The most common problem with vision is optic neuritis where the optic nerve becomes rNeuralOscillations inMultipleSclerosisr
inflamed. Visual evoked potentials have been found to be abnormal in individuals suffering from optic neuritis (Tobimatsu and Kato, 1998); however, to our knowledge, this is the first study to show the perturbed visual gamma oscillations in MS. The neurophysiological mechanism underlying this finding remains unclear, but could again relate to neurochemistry. Visual gamma oscillations have been related to GABA concentration (Muthukumaraswamy et al., 2009); for example, administration of the GABA uptake inhibitor Tiagabine has been shown to affect signif-icantly the frequency of induced gamma oscillations (Mag-azzini et al., 2016). It follows that the present finding of decreased gamma amplitude in patients might relate to GABA abnormalities which have been previously shown in MS patients, albeit not directly in visual cortex (Cawley et al., 2015). Demyelination may also play a role in the perturbation of gamma oscillations; while beta band effects are thought to relate to long-range communication, gamma oscillations have been suggested to be a more local phe-nomenon, generated in relatively small cortical neural net-works (Donner and Siegel, 2011; Hall et al., 2014; Pfurtscheller and Da Silva, 1999; Zumer et al., 2010). This potentially suggests that demyelination of white matter tracts may play a lesser role in our gamma findings than beta findings. However, it is tempting to speculate that cortical demyelination in MS (Kutzelnigg et al., 2005; Tal-lantyre et al., 2010), coupled with a demonstrable link between cortical myelination and MEG networks (Hunt et al., 2016) might offer an explanation regarding the reduced gamma amplitude observed here. However, fur-ther work, potentially involving MRS, myelin mapping (Geades et al., 2016), and MEG is required to further eluci-date this relationship.
Finally, there are a number of limitations of this study, primarily sample size; 18 patients were included in our visual gamma analysis and 17 in the beta band analysis. These sample sizes are small, as are the effect sizes that we describe, both the reduction in gamma amplitude and increased time-to-peak of the PMBR. It therefore follows that definitive conclusions regarding the effects that we observe can only be drawn following a repeated demon-stration of the same effect in an independent cohort of MS patients. It is also important to be aware that the beta band response can be modulated by other factors. For example, Fry et al. (2016) show that PMBR is altered by force output. Similarly, the duration of movement may have an effect (Feingold et al., 2015). Unfortunately, in this study, we had no way of controlling for such effects; future studies of this nature should therefore employ para-digms with controlled isometric force outputs. Similarly our illness severity scores in patients did not relate directly to visual acuity and this may explain the reason why visu-al gamma amplitude failed to correlate with any metric of behaviour. Overall, a follow-up study should aim to address more directly the relationship between patients’ motor and visual function, and the PMBR and visual gam-ma oscillations.
CONCLUSION
MS is characterised by widespread structural damage, which likely leads to numerous functional deficits. In this article, we sought to characterise those functional deficits via assessment of the electrophysiological response to a simple visuomotor task. We found a significant increase in the time-to-peak of the PMBR in MS patients compared to healthy controls, and this correlates significantly (across patients) with a measure of information processing speed. A significant decrease in the amplitude of visual gamma oscillations in MS patients relative to healthy controls was also found. These electrophysiological imaging results offer a new insight into visual disturbances and abnormal motor control suffered by MS patients.
ACKNOWLEDGMENT
The authors express their thanks to Nicolas Geades and Richard Dury for their assistance in MR scanning.
REFERENCES
Adjamian P, Holliday IE, Barnes GR, Hillebrand A, Hadjipapas A, Singh KD (2004): Induced visual illusions and gamma oscilla-tions in human primary visual cortex. Eur J Neurosci 20: 587–592.
Alegre M, Alvarez-Gerriko I, Valencia M, Iriarte J, Artieda J (2008): Oscillatory changes related to the forced termination of a movement. Clin Neurophysiol 119:290–300.
Barkhof F (2002): The clinico-radiological paradox in multiple scle-rosis revisited. Curr Opin Neurol 15:239–245.
Benedict RH, Schretlen D, Groninger L, Dobraski M, Shpritz B (1996): Revision of the brief visuospatial memory test: Studies of normal performance, reliability, and validity. Psychol Assessment 8:145.
Brookes MJ, Gibson AM, Hall SD, Furlong PL, Barnes GR, Hillebrand A, Singh KD, Holliday IE, Francis ST, Morris PG (2005): GLM-beamformer method demonstrates stationary field, alpha ERD and gamma ERS co-localisation with fMRI BOLD response in visual cortex. Neuroimage 26:302–308. Brookes MJ, Wood JR, Stevenson CM, Zumer JM, White TP,
Liddle PF, Morris PG (2011): a). Changes in brain network activity during working memory tasks: A magnetoencephalog-raphy study. Neuroimage 55:1804–1815.
Brookes MJ, Woolrich M, Luckhoo H, Price D, Hale JR, Stephenson MC, Barnes GR, Smith SM, Morris PG (2011b): Investigating the electrophysiological basis of resting state net-works using magnetoencephalography. Proc Natl Acad Sci 108:16783–16788.
Buzsaki G, Wang XJ (2012): Mechanisms of gamma oscillations. Ann Rev Neurosci 35:203.
Calabrese M, Filippi M, Gallo P (2010): Cortical lesions in multiple sclerosis. Nat Rev Neurol 6:438–444.
Cao L, Hu YM (2016): Beta rebound in visuomotor adaptation: Still the status quo? J Neurosci 36:6365–6367.
Cawley N, Solanky BS, Muhlert N, Tur C, Edden RA, Wheeler-Kingshott CA, Miller DH, Thompson AJ, Ciccarelli O (2015): Reduced gamma-aminobutyric acid concentration is associated with physical disability in progressive multiple sclerosis. Brain 138:2584–2595.
Cheyne D, Bells S, Ferrari P, Gaetz W, Bostan AC (2008): Self-paced movements induce high-frequency gamma oscillations in primary motor cortex. Neuroimage 42:332–342.
Cover KS, Vrenken H, Geurts JJ, van Oosten BW, Jelles B, Polman CH, Stam CJ, van Dijk BW (2006): Multiple sclerosis patients show a highly significant decrease in alpha band interhemispheric syn-chronization measured using MEG. Neuroimage 29:783–788. Delis, D. C., Kramer, J., Kaplan, E. and Ober, B. A. (2000).
CVLT-II: California verbal learning test: adult version, Psychological Corporation.
Dickinson A, Bruyns-Haylett M, Jones M, Milne E (2015): Increased peak gamma frequency in individuals with higher levels of autistic traits. Eur J Neurosci 41:1095–1101.
Dineen R, Vilisaar J, Hlinka J, Bradshaw C, Morgan P, Constantinescu C, Auer D (2009): Disconnection as a mecha-nism for cognitive dysfunction in multiple sclerosis. Brain 132(1:239–249.):
Donner TH, Siegel M (2011): A framework for local cortical oscil-lation patterns. Trends Cogn Sci 15:191–199.
Edden RA, Muthukumaraswamy SD, Freeman TC, Singh KD (2009): Orientation discrimination performance is predicted by GABA concentration and gamma oscillation frequency in human primary visual cortex. J Neurosci 29:15721–15726. Feingold J, Gibson DJ, DePasquale B, Graybiel AM (2015): Bursts
of beta oscillation differentiate postperformance activity in the striatum and motor cortex of monkeys performing movement tasks. Proc Natl Acad Sci 112:13687–13692.
Filippi M, Rocca MA (2013): Present and future of fMRI in multi-ple sclerosis. Exp Rev Neurotherap 13:27–31.
Friedman-Hill S, Maldonado PE, Gray CM (2000): Dynamics of striate cortical activity in the alert macaque: I. Incidence and stimulus-dependence of gamma-band neuronal oscillations. Cereb Cortex 10:1105–1116.
Fries P, Reynolds JH, Rorie AE, Desimone R (2001): Modulation of oscillatory neuronal synchronization by selective visual atten-tion. Science 291:1560–1563.
Fries P (2005): A mechanism for cognitive dynamics: Neuronal communication through neuronal coherence. Trends Cogn Sci 9:474–480.
Fries P (2009): Neuronal gamma-band synchronization as a funda-mental process in cortical computation. Ann Rev Neurosci 32: 209–224.
Fry A, Mullinger KJ, O’Neill GC, Barratt EL, Morris PG, Bauer M, Folland JP, Brookes MJ (2016): Modulation of post-movement beta rebound by contraction force and rate of force develop-ment. Hum Brain Mapp.
Gaetz W, Macdonald M, Cheyne D, Snead O (2010): Neuromag-netic imaging of movement-related cortical oscillations in chil-dren and adults: Age predicts post-movement beta rebound. Neuroimage 51:792–807.
Gaetz W, Edgar JC, Wang D, Roberts TP (2011): Relating MEG measured motor cortical oscillations to restingg-aminobutyric acid (GABA) concentration. Neuroimage 55:616–621.
Geades N, Hunt BA, Shah SM, Peters A, Mougin OE, Gowland PA (2016): Quantitative analysis of the z-spectrum using a numerically simulated look-up table: Application to the healthy human brain at 7T. Magn Reson Med.
Gilbertson T, Lalo E, Doyle L, Di Lazzaro V, Cioni B, Brown P (2005): Existing motor state is favored at the expense of new movement during 13-35 Hz oscillatory synchrony in the human corticospinal system. J Neurosci 25:7771–7779.
Goldman L, Albus JS (1968): Computation of impulse conduction in myelinated fibers; theoretical basis of the velocity-diameter relation. Biophys J 8:596.
Gonzalez-Burgos G, Lewis DA (2012): NMDA receptor hypofunc-tion, parvalbumin-positive neurons and cortical gamma oscilla-tions in schizophrenia. Schizophrenia Bull sbs010.
Hall EL, Woolrich MW, Thomaz CE, Morris PG, Brookes MJ (2013): Using variance information in magnetoencephalography mea-sures of functional connectivity. Neuroimage 67:203–212. Hall EL, Robson SE, Morris PG, Brookes MJ (2014): The
relation-ship between MEG and fMRI. Neuroimage 102:80–91.
Hall SD, Barnes GR, Furlong PL, Seri S, Hillebrand A (2010): Neu-ronal network pharmacodynamics of GABAergic modulation in the human cortex determined using pharmaco-magnetoen-cephalography. Hum Brain Mapp 31:581–594.
Hall SD, Stanford IM, Yamawaki N, McAllister C, R€onnqvist K, Woodhall GL, Furlong PL (2011): The role of GABAergic mod-ulation in motor function related neuronal network activity. Neuroimage 56:1506–1510.
Hardmeier M, Schoonheim MM, Geurts JJ, Hillebrand A, Polman CH, Barkhof F, Stam CJ (2012): Cognitive dysfunction in early multiple sclerosis: Altered centrality derived from resting-state functional connectivity using magneto-encephalography. PLoS One 7:e42087.
Helbling S, Teki S, Callaghan MF, Sedley W, Mohammadi S, Griffiths TD, Weiskopf N, Barnes GR (2015): Structure predicts function: Combining non-invasive electrophysiology with in-vivo histology. Neuroimage 108:377–385.
Hemmett L, Holmes J, Barnes M, Russell N (2004): What drives quality of life in multiple sclerosis? Qjm 97:671–676.
Henrie JA, Shapley R (2005): LFP power spectra in V1 cortex: The graded effect of stimulus contrast. J Neurophysiol 94:479–490. Hipp JF, Hawellek DJ, Corbetta M, Siegel M, Engel AK (2012):
Large-scale cortical correlation structure of spontaneous oscil-latory activity. Nat Neurosci 15:884–890.
Houtchens M, Benedict R, Killiany R, Sharma J, Jaisani Z, Singh B, Weinstock-Guttman B, Guttmann C, Bakshi R (2007): Tha-lamic atrophy and cognition in multiple sclerosis. Neurology 69:1213–1223.
Huang M, Mosher J, Leahy R (1999): A sensor-weighted overlap-ping-sphere head model and exhaustive head model compari-son for MEG. Phys Med Biol 44:423.
Hunt BA, Tewarie PK, Mougin OE, Geades N, Jones DK, Singh KD, Morris PG, Gowland PA, Brookes MJ (2016): Relationships between cortical myeloarchitecture and electrophysiological networks. Proc Natl Acad Sci 113:13510–13515.
Jasper H, Penfield W (1949): Electrocorticograms in man: Effect of voluntary movement upon the electrical activity of the precen-tral gyrus. Archiv fur Psychiatrie und Nervenkrankheiten 183:€
163–174.
Jensen O, Kaiser J, Lachaux JP (2007): Human gamma-frequency oscillations associated with attention and memory. Trends Neurosci 30:317–324.
Jurkiewicz MT, Gaetz WC, Bostan AC, Cheyne D (2006): Post-move-ment beta rebound is generated in motor cortex: Evidence from neuromagnetic recordings. Neuroimage 32:1281–1289.
Kail R (1998): Speed of information processing in patients with multiple sclerosis. J Clin Exp Neuropsychol 20:98–106.
rNeuralOscillations inMultipleSclerosisr
Kutzelnigg A, Lucchinetti CF, Stadelmann C, Br€uck W, Rauschka H, Bergmann M, Schmidbauer M, Parisi JE, Lassmann H (2005): Cortical demyelination and diffuse white matter injury in multiple sclerosis. Brain 128:2705–2712.
Langdon D, Amato M, Boringa J, Brochet B, Foley F, Fredrikson S, H€am€al€ainen P, Hartung H, Krupp L, Penner I (2012): Recom-mendations for a brief international cognitive assessment for multiple sclerosis (BICAMS). Multiple Sclerosis J 18:891–898. Liddle EB, Price D, Palaniyappan L, Brookes MJ, Robson SE, Hall
EL, Morris PG, Liddle PF (2016): Abnormal salience signaling in schizophrenia: The role of integrative beta oscillations. Hum Brain Mapp.
Litvan I, Grafman J, Vendrell P, Martinez JM (1988): Slowed infor-mation processing in multiple sclerosis. Arch Neurol 45: 281–285.
Liu Y, Liang P, Duan Y, Jia X, Yu C, Zhang M, Wang F, Zhang M, Dong H, Ye J (2011): Brain plasticity in relapsing–remitting multiple sclerosis: Evidence from resting-state fMRI. J Neurol Sci 304:127–131.
Mackenzie I, Morant S, Bloomfield G, MacDonald T, O’riordan J (2014): Incidence and prevalence of multiple sclerosis in the UK 1990–2010: A descriptive study in the General Practice Research Database. J Neurol Neurosurg Psychiatry 85:76–84. Magazzini L, Muthukumaraswamy SD, Campbell AE, Hamandi K,
Lingford-Hughes A, Myers JF, Nutt DJ, Sumner P, Wilson SJ, Singh KD (2016): Significant reductions in human visual gamma frequency by the GABA reuptake inhibitor tiagabine revealed by robust peak frequency estimation. Hum Brain Mapp.
Mainero C, Caramia F, Pozzilli C, Pisani A, Pestalozza I, Borriello G, Bozzao L, Pantano P (2004): fMRI evidence of brain reorga-nization during attention and memory tasks in multiple sclero-sis. Neuroimage 21:858–867.
Melloni L, Molina C, Pena M, Torres D, Singer W, Rodriguez E (2007): Synchronization of neural activity across cortical areas correlates with conscious perception. J Neurosci 27:2858–2865. Muthukumaraswamy SD, Edden RA, Jones DK, Swettenham JB,
Singh KD (2009): Resting GABA concentration predicts peak gamma frequency and fMRI amplitude in response to visual stimulation in humans. Proc Natl Acad Sci 106:8356–8361. Muthukumaraswamy SD, Myers JF, Wilson SJ, Nutt DJ,
Lingford-Hughes A, Singh KD, Hamandi K (2013): The effects of elevat-ed endogenous GABA levels on movement-relatelevat-ed network oscillations. Neuroimage 66:36–41.
Neuper C, Pfurtscheller G (2001): Event-related dynamics of corti-cal rhythms: Frequency-specific features and functional corre-lates. Int J Psychophysiol 43:41–58.
O’Neill GC, Bauer M, Woolrich MW, Morris PG, Barnes GR, Brookes MJ (2015): Dynamic recruitment of resting state sub-networks. Neuroimage 115:85–95.
Ormerod I, McDonald W, Du Boulay G, Kendall B, Moseley I, Halliday A, Kakigi R, Kriss A, Peringer E (1986): Disseminated lesions at presentation in patients with optic neuritis. J Neurol Neurosurg Psychiatry 49:124–127.
Pfurtscheller G, Da Silva FL (1999): Event-related EEG/MEG syn-chronization and desynsyn-chronization: Basic principles. Clin Neurophysiol 110:1842–1857.
Polman CH, Reingold SC, Banwell B, Clanet M, Cohen JA, Filippi M, Fujihara K, Havrdova E, Hutchinson M, Kappos L (2011): Diagnostic criteria for multiple sclerosis: 2010 revisions to the McDonald criteria. Ann Neurol 69:292–302.
Reddy H, Narayanan S, Arnoutelis R, Jenkinson M, Antel J, Matthews P, Arnold D (2000): Evidence for adaptive functional
changes in the cerebral cortex with axonal injury from multiple sclerosis. Brain 123:2314–2320.
Robinson S, Vrba J (1998): Functional neuroimaging by synthetic aperture magnetometry (SAM). 302–305. Recent advances in biomagnetism:
Rocca MA, Falini A, Colombo B, Scotti G, Comi G, Filippi M (2002): Adaptive functional changes in the cerebral cortex of patients with nondisabling multiple sclerosis correlate with the extent of brain structural damage. Ann Neurol 51:330–339. Roxburgh R, Seaman S, Masterman T, Hensiek A, Sawcer S,
Vukusic S, Achiti I, Confavreux C, Coustans M, Le Page E (2005): Multiple sclerosis severity score using disability and dis-ease duration to rate disdis-ease severity. Neurology 64:1144–1151. Sanfilipo MP, Benedict RH, Weinstock-Guttman B, Bakshi R
(2006): Gray and white matter brain atrophy and neuropsycho-logical impairment in multiple sclerosis. Neurology 66:685–692. Sarvas J (1987): Basic mathematical and electromagnetic concepts
of the biomagnetic inverse problem. Phys Med Biol 32:11. Schoonheim MM, Geurts J, Wiebenga O, D, Munck J, Polman C,
Stam C, Barkhof F, Wink A (2013a): Changes in functional net-work centrality underlie cognitive dysfunction and physical disability in multiple sclerosis. Multiple Sclerosis Journal: 1352458513516892.
Schoonheim MM, Geurts JJ, Landi D, Douw L, van der Meer ML, Vrenken H, Polman CH, Barkhof F, Stam CJ (2013b): Function-al connectivity changes in multiple sclerosis patients: A graph analytical study of MEG resting state data. Hum Brain Mapp 34:52–61.
Schoonheim MM, Meijer KA, Geurts JJ (2015): Network collapse and cognitive impairment in multiple sclerosis. Front Neurol 6.
Sethi V, Muhlert N, Ron M, Golay X, Wheeler-Kingshott CA, Miller DH, Chard DT, Yousry TA (2013): MS cortical lesions on DIR: Not quite what they seem? PLoS One 8:e78879. Siegel M, Donner TH, Engel AK (2012): Spectral fingerprints of
large-scale neuronal interactions. Nat Rev Neurosci 13:121–134. Smith, A. (2013). Symbol digit modalities test: Manual.
Smith RS, Koles ZJ (1970): Myelinated nerve fibers: Computed effect of myelin thickness on conduction velocity. Am J Physiol 219:1256–1258.
Solis-Escalante T, M€uller-Putz GR, Pfurtscheller G, Neuper C (2012): Cue-induced beta rebound during withholding of overt and covert foot movement. Clin Neurophysiol 123:1182–1190. Staffen W, Mair A, Zauner H, Unterrainer J, Niederhofer H,
Kutzelnigg A, Ritter S, Golaszewski S, Iglseder B, Ladurner G (2002): Cognitive function and fMRI in patients with multiple sclerosis: Evidence for compensatory cortical activation during an attention task. Brain 125:1275–1282.
Steenwijk MD, Daams M, Pouwels PJ, J Balk L, Tewarie PK, Geurts JJ, Barkhof F, Vrenken H (2015): Unraveling the rela-tionship between regional gray matter atrophy and pathology in connected white matter tracts in long-standing multiple sclerosis. Hum Brain Mapp 36:1796–1807.
Strober L, Englert J, Munschauer F, Weinstock-Guttman B, Rao S, Benedict R (2009): Sensitivity of conventional memory tests in multiple sclerosis: Comparing the Rao Brief Repeatable Neuro-psychological Battery and the Minimal Assessment of Cogni-tive Function in MS. Multiple Sclerosis 15:1077–1084.
Tallon-Baudry C, Bertrand O (1999): Oscillatory gamma activity in humans and its role in object representation. Trends Cogn Sci 3:151–162.
Tan H, Wade C, Brown P (2016): Post-movement beta activity in sensorimotor cortex indexes confidence in the estimations from internal models. J Neurosci 36:1516–1528.
Tewarie P, Schoonheim MM, Stam CJ, van der Meer ML, van Dijk BW, Barkhof F, Polman CH, Hillebrand A (2013): Cogni-tive and clinical dysfunction, altered MEG resting-state net-works and thalamic atrophy in multiple sclerosis. PLoS One 8:e69318.
Tewarie P, Steenwijk MD, Tijms BM, Daams M, Balk LJ, Stam CJ, Uitdehaag BM, Polman CH, Geurts JJ, Barkhof F (2014a): Dis-ruption of structural and functional networks in long-standing multiple sclerosis. Hum Brain Mapp 35:5946–5961.
Tewarie P, Hillebrand A, Schoonheim MM, Van Dijk B, Geurts J, Barkhof F, Polman C, Stam CJ (2014b): Functional brain network analysis using minimum spanning trees in Multiple Sclerosis: An MEG source-space study. Neuroimage 88: 308–318.
Tewarie P, Schoonheim MM, Schouten DI, Polman CH, Balk LJ, Uitdehaag BM, Geurts JJ, Hillebrand A, Barkhof F, Stam CJ (2015): Functional brain networks: Linking thalamic atrophy to clinical disability in multiple sclerosis, a multimodal fMRI and MEG study. Hum Brain Mapp 36:603–618.
Tobimatsu S, Kato M (1998): Multimodality visual evoked poten-tials in evaluating visual dysfunction in optic neuritis. Neurol-ogy 50:715–718.
Van der Meer M, Tewarie P, Schoonheim M, Douw L, Barkhof F, Polman C, Stam C, Hillebrand A (2013): Cognition in MS correlates with resting-state oscillatory brain activity: An explorative MEG source-space study. NeuroImage Clin 2: 727–734.
Vidaurre D, Quinn AJ, Baker AP, Dupret D, Tejero-Cantero A, Woolrich MW (2016): Spectrally resolved fast transient brain states in electrophysiological data. Neuroimage 126:81–95. Zumer JM, Brookes MJ, Stevenson CM, Francis ST, Morris PG
(2010): Relating BOLD fMRI and neural oscillations through convolution and optimal linear weighting. Neuroimage 49: 1479–1489.
rNeuralOscillations inMultipleSclerosisr