1441
Dynamic CT Perfusion Imaging of
Acute Stroke
Thomas E. Mayer, Gerhard F. Hamann, Jan Baranczyk, Bernhard Rosengarten, Erich Klotz, Martin Wiesmann, Ulrich Missler, Gernot Schulte-Altedorneburg, and Hartmuth J. Brueckmann
BACKGROUND AND PURPOSE: Because cerebral perfusion imaging for acute stroke is
unavailable in most hospitals, we investigated the feasibility of a method of perfusion scanning that can be performed rapidly during standard cranial CT. Our aim was to identify the scan-ning parameters best suited to indicate tissue at risk and to measure a perfusion limit to predict infarction.
METHODS: Seventy patients who had suffered stroke and had undergone cranial CT 0.5 to
12 hours (median, 3.75 hr) after the onset of symptoms participated in the study. While un-dergoing conventional CT, each patient received a bolus of iodinated contrast medium. Maps of time to peak (TTP), cerebral blood volume (CBV), and CBF were calculated from the resulting dynamically enhanced scans. These perfusion images were compared with follow-up CT scans or MR images showing the final infarctions.
RESULTS: CBF maps predicted the extent of cerebral infarction with a sensitivity of 93%
and a specificity of 98%. In contrast, CBV maps were less sensitive and TTP maps were less specific and also showed areas of collateral flow. Infarction occurred in all of the patients with CBF reduction of more than 70% and in half of the patients with CBF reduction of 40% to 70%.
CONCLUSION: Dynamic CT perfusion imaging safely detects tissue at risk in cases of acute
stroke and is a feasible method for any clinic with a third-generation CT scanner.
Although studies show that the IV administration of a fibrinolytic drug improves the outcome of acute stroke (1–3), the therapy itself can cause se-rious intracerebral hemorrhage. Both the diagnosis and treatment of acute stroke might be improved if cerebral perfusion could be measured to identify the tissue at risk. The extent of ischemia cannot be assessed by neurologic examination alone. Trans-cranial duplex sonography (4), digital subtraction angiography (5), CT angiography (5), xenon-en-hanced CT (6), positron emission tomography (7, 8), single-photon emission CT (SPECT) (9, 10), and various MR imaging techniques (11–17) are useful methods for evaluating acute stroke. How-ever, these methods have disadvantages and are not
Received November 29, 1999; accepted after revision February 28, 2000.
From the Departments of Neuroradiology (T.E.M., H.J.B.) and Neurology (G.F.H.), Ludwig-Maximilians University, Mu-nich; the Neuroradiology Section (J.B., M.W., U.M., G.S.-A.) and Clinic of Neurology (B.R.), Medical University, Lu¨beck; and the Medical Engineering Group (E.K.), Siemens, Erlangen, Germany.
Address reprint requests to OA Dr. med. Thomas E. Mayer, Abteilung Neuroradiologie, Klinikum Grosshadern, Ludwig Maximilians Universita¨t, 81377 Mu¨nchen, Germany.
qAmerican Society of Neuroradiology
available in all hospitals. Because almost all pa-tients with suspected acute stroke should undergo CT, which is also widely available, to exclude he-matoma and existing infarcts, essential time can be gained by also measuring cerebral perfusion during the initial CT. The aim of our study was threefold: to investigate whether the use of dynamic CT with conventional iodinated contrast medium augmented by software that rapidly provides maps of CBF is feasible in cases of acute stroke, to determine which imaging parameters best detect tissue at risk, and to identify perfusion thresholds for predicting the development of infarction.
Methods
We conducted a prospective study to determine the value of CT for measuring cerebral perfusion by use of a bolus of io-dinated contrast medium in patients with acute stroke. The ini-tial plain CT and the perfusion maps were compared with the follow-up CT scans or MR images. Patients were grouped post hoc according to their National Institutes of Health Stroke Scores (NIHSS) at admission.
Patients
admitted to our institutions between 1996 and 1998, and whose plain cerebral CT scans showed no signs of hematoma. Pa-tients with brain stem symptoms were excluded. The study design conformed to the Declaration of Helsinki and all sub-sequent versions on the participation of humans in studies. Informed consent was obtained from each patient, if possible. If the patient was aphasic, he or she was examined according to the hospital guidelines for emergency treatment and the next of kin was asked for consent and was asked whether the patient would be likely to agree to undergoing the procedure.
Perfusion Imaging Methodology
The main principle of our method of perfusion imaging is based on the analysis of plain and contrast-enhanced CT scans obtained at different times. Most important is a sharp bolus of contrast medium resulting from rapid injection (10–20 mL/s). The software used the maximal slope of the time-density curve (Perfusion CT software; Siemens, Erlangen, Germany) to mea-sure cerebral blood perfusion from dynamically enhanced ce-rebral CT scans, as described previously (18). See appendix for relevant formulae to calculate the parameters. The param-eters chosen for evaluating cerebral perfusion were CBF, ce-rebral blood volume (CBV), and time to peak (TTP).
Our method of calculating CBF is biased by the use of a contrast bolus that is not compact enough to prevent venous outflow before the peak of the arterial inflow is reached (it is not biased by recirculation). This results in a diminution of the calculated flow. Partial volume effect of the blood reference cannot be completely excluded. Therefore, our perfusion maps were used as non-absolute values relative to the unaffected regions of the brain within the same section in patients with focal pathologic abnormalities.
Perfusion Imaging Procedure and Follow-up Examinations
Conventional plain CT of 3- or 4-mm-thick basal sections and 5- or 8-mm-thick supratentorial sections were obtained. Dynamic contrast-enhanced CT scans were acquired by in-jecting 50 mL of iodinated contrast medium (300 mg/mL) into a peripheral vein through a 16-gauge catheter, either manually or with an angiographic power injector (injection velocity5 10 mL/s).
Then 10-mm-thick scans with rotation times of 0.75 to 1 seconds were reconstructed every 0.75 to 1.5 seconds by a 30- to 40-second-long scan on a continuously rotating CT scanner (Somatom Plus S or Somatom Plus 4; Siemens). The CT scans were transferred via DICOM net (every series, 1–2 min) to a personal computer (Intel Pentium Pro 200 MHz, 128 MB) and perfusion images were calculated in approximately 1 minute.
Because this method allowed only a single section to be calculated with each contrast bolus, one to three levels were examined per patient. The first dynamic CT scan for each pa-tient was obtained at the level of the basal ganglia. If no per-fusion abnormality was evident on the first perper-fusion section or if an estimation of the lesion volume was desired, a second or even a third scan was obtained rostral or, in patients with motoric aphasia, caudal to the basal ganglia.
The involved subterritories were determined by native fol-low-up CT or MR imaging (with T2- and proton density– weighted turbo spin-echo and diffusion-weighted (b 51000) echo-planar imaging sequences) performed within the 1st week after stroke onset.
Image Interpretation
Because we used a single-section perfusion technique (one to three sections), it was not possible to calculate the volume of the tissue at risk. Therefore, we defined its extent semi-quantitatively by determining whether early signs of infarction,
perfusion deficits, and definitive infarction occurred in any of 12 arterial subterritories.
Two neuroradiologists evaluated the conventional CT scans while blind to the parameter images and to the results of the follow-up examination and evaluated the parameter images while blind to the follow-up scans. The plain CT scan (baseline scan) was examined for early CT signs (ECTS) of infarction (ie, swelling or hypodensity of the gray matter equivalent to a decrease of 4 to 10 HU) and for hyperdense vessel signs of thromboembolism of the internal carotid artery (ICA) and of the middle cerebral artery (MCA) and its branches, which were visible as dense vessels with approximately 60 HU (19–21). The perfusion maps were analyzed for decrease in CBF, de-crease in CBV, and delay in TTP. When the evaluations dif-fered, the evaluators agreed on a common decision. The CT scans were analyzed for evidence of cerebral infarct or perfu-sion changes in six arterial subterritories on both hemispheres of the brain, according to Ringelstein et al (22), as follows: the anterior cerebral artery; the deep (lenticulostriatal) territory of the MCA; the ventral (frontal) territory of the MCA; the middle (temporal, insular, and central) territory of the MCA; the posterior (parietal and temporo-occipital) territory of the MCA; and the posterior cerebral artery.
On the basis of preliminary examinations by this method, 10 patients with subacute stroke and 30 patients with symp-tomatic carotid stenosis (unpublished data) were classified to have moderate (CBF in the affected territories between 30% and 60% of CBF in the normal territories) or severe (CBF less than 30% of normal CBF) changes in CBF. Changes in CBV were also classified as moderate (CBV in the affected territo-ries between 50% and 80% of normal) or severe (CBV less than 50% of normal CBV). The TTP on the affected side was considered moderately delayed if it lagged by 3 to 6 seconds and severe if it lagged more than 6 seconds behind the TTP on the normal side. ECTS and perfusion lesions in each sub-territory of the initial scans were correlated with definite in-farcts shown in the first follow-up CT scans or MR images.
Statistical Analysis
Sensitivity, specificity, and positive and negative predictive values of hyperdense vessel signs, ECTS, a CBF map, a CBV map, and a TTP map for the prediction of infarcts were cal-culated with 95% confidence intervals. We hypothesized first that CT-based CBF maps would predict infarction better than conventional CT scans, second that CBV maps would be less sensitive, and third that TTP maps would be less specific. True-and false-positive findings on the conventional True-and parameter scans regarding definite infarct in the follow-up study were explored byx2tests. To maintain a globala-level of P,.05 for these three hypotheses, multiple testing was adjusted ac-cording to Bonferoni-Holm. In addition to the hypotheses, ex-plorative tests were conducted usingx2tests.
Results
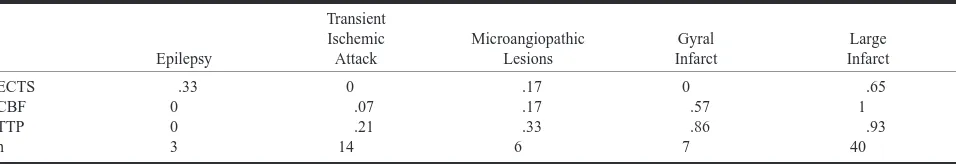
rela-TABLE 1: An overview of the different diseases in 70 patients with stroke symptoms
Epilepsy
Transient Ischemic Attack
Microangiopathic Lesions
Gyral Infarct
Large Infarct
ECTS CBF TTP n
.33 0 0 3
0 .07 .21 14
.17 .17 .33 6
0 .57 .86 7
.65 1
.93 40
[image:3.612.62.540.77.159.2]Note.—The relative number of findings is indicated together with ECTS in conventional CT, CBF, and TTP maps. Findings in the categories of epilepsy (of various origin) and transitory ischemic attack were considered false-positive results.
TABLE 2: Sensitivity for predicting infarction in the subterritories of all patients disregarding microangiopathy
Territory
ACA MCA-v MCA-d MCA-m MCA-p PCA
ECTS CBF(,60%) CBV(,80%) TTP(.3s)
0 .5 .5 .5
.44 .94 .72 .89
.77 .94 .89 .78
.43 .91 .63 .94
.39 .94 .67 .83
.8 1 1 .8
n 2 18 18 35 18 5
Abbreviations.—ACA: anterior cerebral artery; MCA-d: deep (len-ticulo-striatal) territory of the middle cerebral artery; MCA-v: ventral (frontal) territory of the MCA; MCA-m: middle (temporal, insular, and parietal) territory of the MCA; MCA-p: posterior (temporo-occipital) territory of the MCA; PCA: posterior cerebral artery.
tively poor but was sufficient for evaluation of seven patients who had decreased heart function, causing a delayed arrival of the contrast bolus, and for two patients in whom the CT injector delivered insuffi-cient contrast bolus. Larger areas of decreased per-fusion in the brain often appeared on the source CT scans with the arrival of the contrast medium bolus as areas of reduced and delayed enhancement. Scan acquisition, data transmission, and generation of CBF, CBV, and TTP maps required approximately 5 minutes for each series of scans.
Follow-up examinations were performed within the 1st week, with a median of 2 days, for 61 pa-tients and after several weeks for two papa-tients, re-spectively. Six of the patients with transient ische-mic attack and one of the patients diagnosed to have epilepsy did not undergo scanning after the initial procedure because of complete resolution of symptoms on the same day. Sixty-one follow-up CT examinations and 31 MR imaging examinations were done.
Four patients underwent fibrinolysis with tissue plasminogen activator within 3 hours. Two patients with no visible perfusion deficit developed micro-angiopathic lesions, and two patients with large perfusion deficits developed infarction within these areas.
Patients without Ischemia
The results of perfusion CT for three patients with acute stroke symptoms (NIHSS$ 3) showed no evidence of cerebral ischemia. Further evalua-tion led to diagnosis of seizures secondary to gli-osis in one patient, astrocytoma in one, and radia-tion injury in one. The results of convenradia-tional CT were abnormal for all three patients; an ECTS of infarction was suspected in one case. Specificity and positive predictive values of the conventional and perfusion CT were determined for all 70 pa-tients. Table 1 provides an overview of the findings for the different pathologic abnormalities.
Transient Ischemic Attack and Migraine
The clinical symptoms resolved within 24 hours in 14 of the 67 patients with cerebral ischemia. In 13 of these 14 patients, the symptoms were because of a transient ischemic attack (initial NIHSS , 3
for two patients). The 14th patient had amnestic aphasia and showed mild hypoperfusion (CBF in the left temporo-occipital MCA territory was 60% of that on the normal side). Clinically diagnosed to have migraine, this patient did not develop an in-farct (initial NIHSS , 3). Eleven of the patients with transient ischemic attacks had no abnormali-ties revealed by perfusion images, two patients showed moderate TTP delay (in one subterritory and in the whole carotid territory, respectively), and none developed an infarct.
Microangiopathy and Lacunar Infarcts
Among the 53 patients for whom cerebral in-farction was confirmed by follow-up studies, six had microangiopathic or lacunar infarcts (,1.5 cm in diameter). It was difficult to differentiate these small ischemias from artifacts in the white matter by perfusion scanning, and a lesion in the internal capsule was suspected based on only two of the six patients’ TTP maps, one of the six patients’ CBV maps, and one of the six patients’ CBF maps.
Infarctions Greater than 1.5 cm
[image:3.612.313.541.229.317.2]FIG1. Two perfusion sections in a case
of left MCA occlusion. Three hours before undergoing the ex-amination, this 61-year-old woman experienced acute right hemiplegia and global aphasia during coronary angiography.
A, Early conventional CT scans appear normal, with no signs of swelling or discrete cortical hypodensity.
B, CBF maps show flow reduction in nearly the whole cortical territory of the left MCA. Temporal (B2), severe; parietal (B1), moderate to severe. Note that there is a mismatch with the ECTS (color code: red, blood vessels; green, normal cortex; blue, normal white matter; violet, low flow area).
C, CBV maps also show ischemia, although less clearly in the central parietal region because of decreased contrast (color code: red, blood vessels; green, normal cortex; blue, normal white matter;violet, low flow area).
D, TTP concentration of contrast enhancement maps show time delay in the cortical territory of the left MCA and artifact in areas where no peak is discernible (color code: blue, seg-mented blood vessels, normal cortex;dark green, normal white matter;light green, yellow, and red, low flow area).
FIG2. Three perfusion sec-tions. Occlusion of a left MCA branch and of the ipsilateral ICA. This 62-year-old man was admitted with right hemi-paresis and aphasia 8 hours after the onset of symptoms. The color-coding is similar to that used in Figure 1.
A, Early conventional CT scans appear normal, al-though retrospectively, a dis-crete hypodense area can be seen in the cortex (A2).
B, CBF maps show severe flow reduction in the fronto-opercular territory of the left MCA.
C, CBV maps show the is-chemic region to be less pro-nounced and indicate a 10% increase in blood volume in the surrounding cortex, which compensated for the reduced flow velocity in the territory of the left carotid artery.
D, TTP concentration of contrast enhancement maps show time delay not only in the ischemic zone but also in the territories of the entire left MCA and anterior cerebral ar-tery due to occlusion of the ICA, as revealed by sonog-raphy. Acute left carotid artery occlusion might have led to embolization in a frontal branch of the MCA.
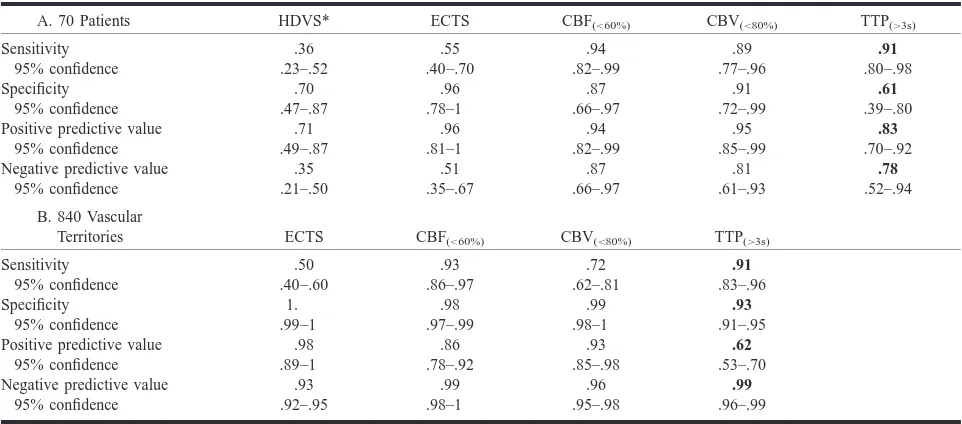
TABLE 3: Results of conventional and perfusion imaging in cases of subsequently confirmed infarction.1.5 cm in maximum diameter
A. 70 Patients HDVS* ECTS CBF(,60%) CBV(,80%) TTP(.3s)
Sensitivity 95% confidence .36 .23–.52 .55 .40–.70 .94 .82–.99 .89 .77–.96 .91 .80–.98 Specificity 95% confidence .70 .47–.87 .96 .78–1 .87 .66–.97 .91 .72–.99 .61 .39–.80 Positive predictive value
95% confidence .71 .49–.87 .96 .81–1 .94 .82–.99 .95 .85–.99 .83 .70–.92 Negative predictive value
95% confidence .35 .21–.50 .51 .35–.67 .87 .66–.97 .81 .61–.93 .78 .52–.94
B. 840 Vascular
Territories ECTS CBF(,60%) CBV(,80%) TTP(.3s)
Sensitivity 95% confidence .50 .40–.60 .93 .86–.97 .72 .62–.81 .91 .83–.96 Specificity 95% confidence 1. .99–1 .98 .97–.99 .99 .98–1 .93 .91–.95 Positive predictive value
95% confidence .98 .89–1 .86 .78–.92 .93 .85–.98 .62 .53–.70 Negative predictive value
95% confidence .93 .92–.95 .99 .98–1 .96 .95–.98 .99 .96–.99
* HDVS, hyperdense vessel sign.
often (35 times) the middle cortical area of the MCA (Table 2).
Of the seven gyral infarcts, six were detected on TTP maps, four on CBF maps, and three on CBV maps. The 40 large territorial and hemodynamic infarcts (.10 mL) were all diagnosed based on pa-tients’ CBF maps (sensitivity of 100%).
Tables 2 and 3 show the relationships between moderately pronounced perfusion parameters and cerebral infarction greater than 1.5 cm in diameter. If only severe perfusion changes were considered, sensitivity decreased while specificity became 100% for the CBF and CBV maps.
Hyperdense vessel signs were visible in only one third of the patients with cerebral infarction greater than 1.5 cm. Thus, the sensitivity of hyperdense vessel signs was substantially lower than that of the CBF map (P,1E–8) and was also lower (but not significantly) than the sensitivity of ECTS. Hyper-dense vessel signs could not be evaluated for 15 patients because of general sclerosis of the cerebral arteries. The specificity of hyperdense vessel signs was lower than that of ECTS (P , .02).
ECTS of infarction revealed true-positive find-ings for infarcts greater than 1.5 cm in approxi-mately half of the brain territories and patients (Ta-ble 2). Figures 1 and 2 provide examples of false-negative ECTS. The specificity of ECTS was very high; only one territory in one patient was falsely positive for infarction. The negative predic-tive value of ECTS for infarction was only 26% among patients examined within 3 hours after the development of symptoms; 3 hours after the ap-pearance of symptoms, the negative predictive val-ue of ECTS increased to 71% (P , .005). Con-ventional CT findings were more sensitive for detecting infarction in the deep territory of the MCA than in other territories (Table 2). In contrast, the perfusion maps did not show significantly
dif-ferent sensitivities (and only slight differences in the specificities) for different territories of the brain.
CBF maps indicating moderate or severe deficits showed true-positive results for infarcts in more than 90% of the brain territories and patients (Figs 1 and 2). These results included three patients and 17 brain territories with only a moderate decrease of perfusion. Decrease in CBF was significantly more sensitive for infarction than ECTS (P ,5E– 5 for patients and P,1E–10 for territories). CBF was especially more sensitive than ECTS for in-farction in the anterior (P , .002), middle (P , 2E–5), and posterior (P , 5E–4) territories of the MCA. Only moderate decreases in CBF maps gave false-positive indications; specificity was lower than that of ECTS (P , .001). However, if the NIHSS was equal to or greater than 3, a moderate CBF decrease was falsely positive in only one pa-tient (specificity, 95%).
CBV maps showed fewer definite regions of low perfusion than did CBF maps. In areas with almost no perfusion, CBV was also measured as zero. CBV maps gave true-positive indications of infarc-tion in higher proporinfarc-tion than did ECTS (P,5E– 4 for patients and P , .002 for brain territories), including 25 patients and 36 brain territories with only moderate decrease of blood volume. However, CBV showed a significantly lower proportion of true-positive territories than did CBF (P ,2E–4). CBV maps gave fewer false-positive results (all for moderate decrease) than did CBF maps (P ,.05). CBV was slightly increased in territories of stenotic vessels if CBF was compensated.
ranged between approximately 1 and 15 seconds. Longer delays resulted in artifacts, because the bo-lus peak disappeared in the background noise. However, TTP map delay also occurred in nine pa-tients without infarction and was falsely positive in more than one third of the territories; thus, the specificity of TTP regarding patients and territories was significantly lower than that of CBF (P,.05 and P,1E–6) and ECTS (P,.005 and P,5E– 13). The high rate of false-positive findings re-vealed by the TTP map despite normal CBF was most probably due to carotid stenosis compensated via collaterals (Fig 2). TTP maps that indicated a delay of more than 6 seconds or an artifact showed only one region in one patient as falsely positive; however, if these criteria had been used to identify infarction, they would have led to false-negative results for an additional six patients and 13 regions compared with the criteria of TTP delay greater than 3 seconds. CBF and TTP together are 100% sensitive for cerebral infarction relative to the pa-tients as well as to the territories.
Discussion
A fast algorithm enabled us to calculate CBF maps almost without any time delay. This method requires only a personal computer with appropriate evaluation software and a DICOM connection to the CT scanner. After performing conventional CT to exclude hematoma and to determine definitive infarct in patients with acute stroke, it takes only a few minutes to acquire and evaluate perfusion scans. The major drawback of dynamic CT is that only a single or a few sections of perfusion scans can be acquired (a whole-brain CBF map can be obtained only by electron-beam CT [23]). Never-theless, dynamic CT CBF maps of one to three (median 1.8) perfusion sections had a sensitivity of 94% when predicting infarction. In a similar study including 28 infarcts in 32 patients, Koenig et al (24) used a single perfusion section and found a sensitivity of 89% using the CBF map. Their find-ing that only three smaller infarcts were not pre-dicted by the single-section technique corresponds to our experience.
Because of the above-mentioned influences that prevent precise calculation, the CBF image from bolus-tracking CT can be used only as a relative CBF map, except for the use of a 14-gauge central-vein catheter. Therefore, some uncertainty remains in low-flow areas regarding whether flow is less than15 mL/100 g/min and whether infarction oc-curs. Our findings of patients with acute stroke show that loss of only approximately 50% to 60% (in our group of moderate flow reduction) of CBF leads to infarcts in more than half of the cases and loss of more than 70% leads to infarctions in all cases. This is consistent with SPECT data (25). Therefore, the exact and absolute values of CBF seemed of minor relevance in our study. The CBF map represents only a measurement at one point in
time and does not reveal changes before and after perfusion imaging. Accordingly, Heiss et al (8), who conducted a positron emission tomographic study, reported that final infarct size depends more on spatial extension than on severity of hypoper-fusion but also on recanalization (by systemic fi-brinolysis). Flow rates of less than approximately 5 mL/100 g/min might not be differentiated from zero flow in CT-CBF maps, because such low flow would be covered by the noise of the time-density curve.
Acute stroke is usually diagnosed by neurologic examination only. Although clinical symptoms are very sensitive to cerebral ischemia, they are non-specific. The results of dynamic CT perfusion im-aging were negative in cases of seizures, transient ischemic attacks, migraine, and also lacunar infarc-tion; the latter was caused by poor signal-to-noise ratio and therefore low spatial resolution in the white matter. However, microangiopathic lesions may not require instantaneous and invasive therapy. Small gyral infarctions were detected by the CBF maps in more than half the cases. Large territorial infarcts, which are of main therapeutic relevance, were predicted by the CBF maps with a sensitivity of 100%. The specificity for predicting infarction can be raised to 100% (this specificity is reported by Koenig et al [24]), but only when severe CBF reduction is considered; the sensitivity then decreases.
Even on our baseline dynamic contrast-enhanced CT scans, larger areas of impaired brain circulation were visible. The CBF maps predicted the extent of infarction better than ECTS. In studies using MR per-fusion and difper-fusion-weighted imaging (12–16), the definite infarct volume ranged between the lesion volumes of diffusion-weighted (smaller) and perfu-sion-weighted (larger) maps. This finding could be due to a higher sensitivity of diffusion images to ear-ly infarction (compared with ECTS) or to less spec-ificity of the kind of MR perfusion imaging used. The CBF maps are very reliable for perfusion deficits, if a good contrast bolus can be obtained and if patient movement within the 20 seconds of bolus passage is limited. Image quality can be impaired in patients with cardiac failure. Koenig et al (24) reported that perfusion CT provided almost the same results as did SPECT for 18 patients with acute stroke. The CBV maps in acute thrombosis or embolism of brain ar-teries are much less sensitive, because the lower rel-ative loss of CBV (to approximately half of normal) compared with CBF (down to zero) provides less im-age contrast. Calculated CBV also falls to zero only in regions of very low perfusion. This is not because of a real decrease in blood-containing vessel volume but because of a failure of contrast enhancement of the blood in the case of no flow. Nevertheless, there were slightly fewer false-positive findings in the CBV map. The CBV map is also least sensitive to motion artifacts. CBV mapping can be performed not only of a single section but also of the whole brain, if a prolonged contrast bolus is used during helical brain scanning (30). Peak time images reveal highly sensitive time delays or intrinsic artifacts (the contrast peak disappears in the noise of the time-density curve) in cases of acute cerebral low perfusion. It is more difficult to interpret findings in the white matter, because perfusion is less than half that of the gray matter and is normally delayed. Consequently, it con-tains more artifacts. Peak times are delayed in chronic high-grade stenosis of the common or internal carot-id, subclavian, or vertebral artery or the brachioce-phalic trunk (31); CBF is normal or slightly reduced, and CBV is mildly elevated. Delayed TTP but nor-mal perfusion could also be a remaining sign of re-canalized embolization or collateralization.
Dynamic CT caused a radiation skin dosage of 0.6 Gy, as measured by a phantom from the Sie-mens research group. The lens of the eye was al-ways outside the dynamic CT section in our study. The exposure dosage of the lens was calculated to be 30 mGy, which is 3% of the threshold for cat-aract development (32). Each perfusion section re-quires its own contrast bolus. Unlike ionic iodin-ated contrast medium, non-ionic contrast media do not increase infarction size in rats (33). Neverthe-less, even with our regimen of one to three sec-tions, we used less contrast medium on average (90 mL) than would be necessary for CT angiog-raphy. Assessment of the whole brain for perfusion imaging by IV injection of a single bolus of con-trast medium seems to be a promising new
devel-opment with CT scanners equipped with multiple detector rings.
Mismatch of regions with ECTS (ie, definitive infarction and regions with CBF decrease) could help in the selection of suitable patients for therapy. For example, dynamic CT perfusion imaging could help to determine whether IV fibrinolysis, angiog-raphy and intraarterial recanalization, hepariniza-tion, neuroprotective medicahepariniza-tion, hypothermia, or early decompression craniotomy is indicated. Ber-rouschot et al (34) determined that SPECT could predict infarction on a more accurate basis than could neurologic scores and that SPECT had great-er sensitivity than did conventional CT. SPECT could also predict malignant infarction and fatal outcome. For these reasons, SPECT perfusion scanning was suggested for selecting patients for early decompressive hemicraniotomy and hypo-thermia (34). Jansen et al (35) showed that tissue at risk, defined by MR perfusion-weighted imaging that exceeded tissue with diffusion disturbance, could be salvaged by recanalization. Ueda et al (25) reported that ischemic tissue with CBF greater than 55% of cerebellar flow can be salvaged with re-canalization (by intraarterial thrombolysis) even af-ter 6 hours, brain tissue with CBF greaaf-ter than 35% of cerebellar flow may be saved within less than 5 hours, and tissue with CBF less than 35% of cer-ebellar flow is at risk for hemorrhage. Accordingly, normal conventional CT and relevant decreased CBF with dynamic CT could provide for a more flexible therapeutic time window for stroke treatment.
Conclusion
Dynamic CT perfusion imaging is feasible in any clinic with a third-generation CT scanner (even without spiral CT capability). Single-section CBF maps predicted all territorial infarcts of volumes larger than 10 mL. CBF images were superior to CBV images in sensitivity and superior to TTP im-ages in specificity. This method showed that in-farction will occur in all vascular territories where loss of perfusion is more than 70% and in more than half of the cases when perfusion losses are between 40% and 70%.
Acknowledgments
We thank Prof. K. Tatsch, Clinic of Nuclear Medicine, for reading the manuscript, J. Benson, Department of Neurology, for copyediting, A. Crispin, Institute of Medical Informatics, for statistical counseling, and D. Lauffer, Media Department, for arranging the image tables.
References
2. The National Institute of Neurological Disorders and Stroke r-TTPA Stroke Study Group. Tissue plasminogen activator for acute ischemic stroke. N Engl J Med 1995;333:1581–1587 3. Hacke W, Kaste M, Fieschi C, et al. Intravenous thrombolysis
with recombinant tissue plasminogen activator for acute hemi-spheric stroke. The European Cooperative Acute Stroke Study. JAMA 1995;274:1017–1025
4. Kaps M, Link A. Transcranial sonographic monitoring during thrombolytic therapy. AJNR Am J Neuroradiol 1998;19:758–760 5. Wildermuth S, Knauth M, Brandt T, Winter R, Sartor K, Hacke W. Role of CT angiography in patient selection for throm-bolytic therapy in acute hemispheric stroke. Stroke 1998;29: 935–938
6. Levy EI, Scarrow AM, Kanal E, Rubin G, Yonas H, Kirby L. Reversible ischemia determined by xenon-enhanced CT after 90 minutes of complete basilar artery occlusion. AJNR Am J Neuroradiol 1998;19:1943–1946
7. Marchal G, Beaudouin V, Rioux P, et al. Prolonged persistence of substantial volumes of potentially viable brain tissue after stroke: a correlative PET-CT study with voxel-based data analysis. Stroke 1996;27:599–606
8. Heiss WD, Grond M, Thiel A, et al. Tissue at risk of infarction rescued by early reperfusion: a positron emission tomography study in systemic recombinant tissue plasminogen activator thrombolysis of acute stroke. J Cereb Blood Flow Metab 1998; 18:1298–1307
9. Alexandrov AV, Black SE, Ehrlich LE, et al. Simple visual anal-ysis of brain perfusion on HMPAO SPECT predicts early out-come in acute stroke. Stroke 1996;27:1537–1542
10. Alexandrov AV, Black SE, Ehrlich LE, Caldwell CB, Norris JW. Predictors of hemorrhagic transformation occurring sponta-neously and on anticoagulants in patients with acute ischemic stroke. Stroke 1997;28:1198–1202
11. Guckel F, Brix G, Rempp K, Deimling M, Rother J, Georgi M. Assessment of cerebral blood volume with dynamic suscepti-bility contrast enhanced gradient-echo imaging. J Comput As-sist Tomogr 1994;18:344–351
12. Tong DC, Yenari MA, Albers GW, O’Brien M, Marks MP, Mose-ley ME. Correlation of perfusion- and diffusion-weighted MRI with NIHSS score in acute (,6.5 hour) ischemic stroke. Neu-rology 1998;50:864–870
13. Barber PA, Darby DG, Desmond PM, et al. Prediction of stroke outcome with echoplanar perfusion- and diffusion-weighted MRI. Neurology 1998;51:418–426
14. Rordorf G, Koroshetz WJ, Copen WA, et al. Regional ischemia and ischemic injury in patients with acute middle cerebral ar-tery stroke as defined by early diffusion-weighted and perfu-sion-weighted MRI. Stroke 1998;29:939–943
15. Lovblad KO, Baird AE, Schlaug G, et al. Ischemic lesion vol-umes in acute stroke by diffusion-weighted magnetic reso-nance imaging correlate with clinical outcome. Ann Neurol 1997;42:164–170
16. Warach S, Dashe JF, Edelman R. Clinical outcome in ischemic stroke predicted by early diffusion-weighted and perfusion magnetic resonance imaging: a preliminary analysis. J Cereb Blood Flow Metab 1996;16:53–59
17. Siewert B, Schlaug G, Edelman RR, Warach S. Comparison of EPISTAR and T2*-weighted gadolinium-enhanced perfusion imaging in patients with acute cerebral ischemia. Neurology 1997;48:673–679
18. Koenig M, Heuser L, Klotz E. Determination of regional brain perfusion by functional CT. In, Krestin GP, Glazer GM (eds): Advances in CT IV. 4th International Scientific User Conference SOMATOM PLUS CT. Berlin: Springer;1998;49–58
19. Von Kummer R, Nolte PN, Schnittger H, Thron A, Ringelstein EB. Detectability of cerebral hemisphere ischemic infarcts by CT within 6 h of stroke. Neuroradiology 1996;38:31–33 20. von Kummer R, Bozzao L, Manelfe C. Early CT Diagnosis of
Hemispheric Brain Infarction. Berlin: Springer,1995
21. Leys D, Pruvo JP, Godefroy O, Rondepierre P, Leclerc X. Prev-alence and significance of hyperdense middle cerebral artery in acute stroke. Stroke 1992;23:317–324
22. Ringelstein EB, Biniek R, Weiller C, Ammeling B, Nolte PN, Thron A. Type and extent of hemispheric brain infarctions and clinical outcome in early and delayed middle cerebral artery recanalization. Neurology 1992;42:289–298
23. Bruning R, Penzkofer H, Schopf U, et al. Calculation of absolute cerebral blood volume and cerebral blood flow by means of electron-beam computed tomography (EBT) in acute ischemia [in German]. Radiologe 1998;38:1054–1059
24. Koenig M, Klotz E, Luka B, Venderink DJ, Spittler JF, Heuser L. Perfusion CT of the brain: diagnostic approach for early de-tection of ischemic stroke. Radiology 1998;209:85–93 25. Ueda T, Sakaki S, Yuh WT, Nochide I, Ohta S. Outcome in acute
stroke with successful intra-arterial thrombolysis and predic-tive value of initial single-photon emission-computed tomog-raphy. J Cereb Blood Flow Metab 1999;19:99–108
26. The RANTTAS Investigators. A randomized trial of tirilazad mesylate in patients with acute stroke (RANTTAS). Stroke 1996;27:1453–1458
27. Muir KW, Lees KR. A randomized, double-blind, placebo-con-trolled pilot trial of intravenous magnesium sulfate in acute stroke. Stroke 1995;26:1183–1188
28. Grotta J. Lubeluzole treatment of acute ischemic stroke: The US and Canadian Lubeluzole Ischemic Stroke Study Group. Stroke 1997;28:2338–2346
29. Diener HC. Multinational randomised controlled trial of lu-beluzole in acute ischaemic stroke: European and Australian Lubeluzole Ischaemic Stroke Study Group. Cerebrovasc Dis 1998;8:172–181
30. Hunter GJ, Hamberg LM, Ponzo JA, et al. Assessment of cere-bral perfusion and arterial anatomy in hyperacute stroke with three-dimensional functional CT: early clinical results. AJNR Am J Neuroradiol 1998;19:29–37
31. Araki Y, Mori S, Kanoh M, Kawai R, Mitomo M. Cerebral peak time mapping uniformity of the value of peak time. Neurora-diology 1987;29:160–162
32. Wilde G, Sjostrand J. A clinical study of radiation cataract for-mation in adult life following gamma irradiation of the lens in early childhood. Br J Ophthalmol 1997;81:261–266
33. Doerfler A, Engelhorn T, von Kummer R, et al. Are iodinated contrast agents detrimental in acute cerebral ischemia? an ex-perimental study in rats. Radiology 1998;206:211–217 34. Berrouschot J, Barthel H, von Kummer R, Knapp WH, Hesse S,
Schneider D. 99m technetium-ethyl-cysteinate-dimer single-photon emission CT can predict fatal ischemic brain edema. Stroke 1998;29:2556–2562
35. Jansen O, Schellinger P, Fiebach J, Hacke W, Sartor K. Early recanalisation in acute ischaemic stroke saves tissue at risk defined by MRI. Lancet 1999;353:2036–2037
Appendix
Calculation of CBF, CBV, and TTP
dHUbrain/dt
CBF5 max.
HUblood peak 2HUblood native
HUbrain peak 2HUbrain native CBV5
HUblood peak 2HUblood native
TTP 5tpeak 2tarrival slice
where brain 5 cerebral tissue parameter, max 5 maximum of the slope, blood 5 intravasal refer-ence, peak5peak of the time-density curve, native