That honeybees recruit nestmates to a food source has been known since Aristotle’s time. von Frisch (1946) discovered that parameters of the so-called waggle dance (performed inside the nest by successful foragers) correlate well with the distance and direction of a food source provided that this is located far enough away. Later, Lindauer (1955) showed that new nest sites are also indicated by dancing behaviour. These discoveries led to two lines of research, one dealing with the efficiency of this kind of recruitment (e.g. Haldane and Spurway, 1954; Seeley, 1986; Towne and Gould, 1988) and the other with the mechanisms involved in this unique communication.
The key question in dealing with the communication mechanisms focuses on the nature of the signals that are transmitted from dancer to follower bees. Optical signals can be ruled out because the dances take place in the darkness of the hive. Mechanical and chemical signals remain as the most likely modalities. von Frisch proposed a multichannel system in which mechanical signals are used to code the locality of the food source and chemical cues to indicate the kind of flower to look for (summary in von Frisch, 1965). The olfactory aspect has been intensely studied by Wenner and his coworkers (e.g. Wenner et al. 1969), and many details of the search strategy of honeybees and the importance of olfaction in the localization of the food source in the field have been described. The dance movements themselves are considered by some to be mainly attention-getting signals and to contain little information about the location of the food source (Friesen, 1973; Wenner et al. 1991). The experiments of Gould (1975), however, support von Frisch and the concept that the dance in
the hive provides the follower bees with information that directs them to the food source. To achieve this, the dancing bee must produce signals and cues detectable by the follower bees. von Frisch proposed a tactile pathway, but this suggestion was not investigated further following the discovery that sound was produced by the wings during the waggle run (Esch, 1961; Wenner, 1962). Michelsen et al. (1987) focused their attention on this phenomenon and measured the acoustic near-field produced by the vibrating wings. To test the importance of this signal as a possible communication pathway, a mechanical model was used to produce a 280 Hz acoustic near-field and a 13 Hz air-flow above the comb (Michelsen et al. 1992). Recruitment success (defined in their work as approaches of bees at or near to the feeder) with this mechanical model was low. Therefore, it is assumed that other stimuli, such as comb vibrations, could be important. Such vibrations were excluded in a prior study (Michelsen et al. 1986) as laser-Doppler vibrometry gave no dance-correlated vibration signals. The failure to detect comb vibrations may indicate not that such vibrations are absent but that they lie in a different plane from that measured, i.e. horizontal instead of vertical relative to the comb.
Given the difficulty of measuring vibrations of the cell walls close to dancing bees (bees avoid the bright laser vibrometer light), a behavioural approach was chosen here to explore the possibility that comb vibration constitutes an important communication channel for dancing bees. Two natural, but significantly different, dance surface conditions were compared: bees were provided with either open empty combs or capped brood combs as their dance floor. Empty,
non-JEB0298
The waggle dance of the honeybee Apis mellifera, used to recruit nestmates to a food source, takes place on the surface of the combs in the dark hive. The mechanism of information transfer between dancer and follower bees is not entirely understood.
The results presented here reveal a novel factor that must be brought into any consideration of this mechanism, namely that the nature of the floor on which the bees dance
has a considerable influence on the recruitment of nestmates to a food source. Dancers on combs with open empty cells recruit three times as many nestmates to a food source as dancers on capped brood cells.
Key words: honeybee, Apis mellifera, waggle dance, dance floor, recruitment.
Summary
HONEYBEE WAGGLE DANCE: RECRUITMENT SUCCESS DEPENDS ON THE
DANCE FLOOR
JUERGEN TAUTZ
T. Boveri-Institut, Universität Würzburg, Am Hubland, D-97074 Würzburg, Germany
Accepted 19 February 1996
capped cells are mechanically unstable in comparison with cells sealed by a cap (Nachtigall and Kresling, 1992) so that vibration transmission should be enhanced in open empty cells compared with that in capped brood cells. If substratum-borne vibrations are important in the transfer of information between the dancing and the following bees, then one would expect recruitment success (defined in this investigation as the ratio between the number of recruits that landed and were caught and killed at the feeder and the number of waggle runs performed by the foragers) on open empty combs to be significantly better than that on capped brood cells. The results of the following investigation show this to be the case.
Materials and methods
Two queenright colonies of Apis mellifera carnica (Pollm.) were taken from ten-frame hives and established in double-frame observation hives (internal dimensions 52 cm352 cm34.5 cm; von Frisch, 1965) at the bee research station of the Universität Würzburg, Germany, and used for these experiments. The population densities (counted from photographs) of the colonies ranged between 3900 and 4700 bees. The experiments were performed in June and July 1995. The two observation hives (hive 1 = colony 1; hive 2 = colony 2) were placed approximately 1 m apart in a wooden hut and mounted such that the entrances were through the walls on opposite sides of the hut. The entrances to the hives were at the bottom and were connected to the outside by a 7 cm long tunnel. A wedge at the entrance channelled all incoming bees to one side of the hive, where they could be watched through a glass plate. All larger holes in empty combs along the wooden frames were lightly stuffed with plastic foam. The door of the hut was left open during the experiments, exposing the bees to daylight but not to direct sunlight.
The colonies were allowed 1 week to settle before the experiments commenced. At the end of this period, 20 individually marked foragers from each hive were trained to two different feeding sites (from colony 1 to a feeding site 150 m west of the hut and from colony 2 to a second site 150 m east of the hut). Each feeding station stood in the middle of freshly harvested meadow. The feeding sites consisted of a 120 cm high table with a 20 cm320 cm top. A feeder containing sugar solution was placed on the table-top. The table-tops were scented (except in one experiment, see Table 1) to facilitate localization of the food source (von Frisch, 1965) by placing a drop of lavender extract (west site) or orange extract (east site) onto a circle of filter paper beneath the feeders. The scent was not renewed throughout each 2 h experiment.
Observers in the hut and those at the feeding tables maintained contact by two-way radios.
The bees were trained to the feeding sites with 1 mol l21 sugar solution, a concentration that does not result in dances by the foraging bees (Lindauer, 1948). All unmarked bees arriving at the feeder were captured to prevent uncontrolled recruitment. Of the 20 trained bees, five were selected for the experiment. The other 15 were caged for later release, in case
one of the selected bees strayed during the experiment. In fact, this did not occur. The five bees were allowed 30 min of foraging on 1 mol l21 sugar solution before beginning the experiment with an abrupt increase of the sugar solution concentration to 2 mol l21(except in one experiment where it was raised to only 1.5 mol l21; see Table 1). The marked foragers then performed waggle dances on returning to the hive. At the feeding stations, each arrival of a marked bee was registered and every recruited (unmarked) bee was captured and removed from the experiment by placing it in a bottle of 70 % ethanol. Within the hut, the arrival of the marked foragers and the number of returns to the hive associated with dances was recorded. The number of waggle runs (i.e. straight runs while waggling the body) was registered for each bee.
Each experiment ran for 2 h and data from consecutive 15 min intervals were pooled. At the end of the data collection period, the concentration of the sugar solution in the feeders was lowered to 1 mol l21and the next 5–10 recruits arriving at the sites (i.e. those alerted during the last 15 min experimental period) were marked individually for the next experiment and released. Five bees were selected arbitrarily from this group (including the old marked foragers) as the foragers for the next day’s experiment.
The feeding stations were left in place for a further 30 min, during which time all non-marked arrivals were caught and killed. The behaviour in the hive of the marked foragers was observed to verify that no dances took place. In each experiment (except one, see Table 1), the foragers from one colony danced on open empty cell combs (here termed open empty combs) while those from the other colony danced on capped brood cell combs (here termed capped brood combs).
Exchanging the dance combs between the hives (leaving all the bees in their old hives), exchanging the lower and upper combs within the individual hives, or installing new combs was carried out on the same day, 3 h after the completion of the experiment (Table 1).
Weather conditions were recorded throughout the experiments.
Statistics
Raw data were tested for normal distribution using the x2 -test. For comparison of means, the two-tailed t-test was used. The error levels for all tests were: Pù0.01, not significant; 0.01>Pù0.001, significant; P<0.001, highly significant.
Correlation coefficients (r) were calculated according to Pearson and Bravis (Sokal and Rohlf, 1981). These r-values were z-transformed to allow employment of the t-test (r-values tested against zero and against each other). Regressions were tested for linearity using the F-test, and slopes of regression lines were tested against each other using the t-test (independent or dependent tests accordingly).
In addition to mean and standard deviations, the standard errors of the means were calculated to give the range within the population mean found with a certainty of 68 %.
Results
Bees distributed themselves more or less equally throughout each observation hive with a slight preference for the capped brood comb. This distribution was rapidly re-established after comb changes in the hives and long before a new experiment was begun. Between 15 and 25 unmarked bees, dancing for other food sources, appeared in both hives during the experiments. The five marked bees foraged actively and as many as three of them were seen to dance simultaneously. All danced on the lower comb in the area next to the entrance, a region identified as preferred for dancing (Lindauer, 1952,
1954; Seeley, 1994). All the data, summarized in Table 1, fit a normal distribution curve.
[image:3.595.56.562.266.763.2]Recruitment on open empty combs and capped brood combs A direct comparison between the recruitment success of dancers on open empty cells with those on capped brood cells revealed that 87 bees were recruited from the hive with the open empty cell dance floor and only 24 from the hive with the capped brood cell dance floor during the first 2 h observation period (Table 1, experiment 1). To eliminate the possibility that these differences stemmed from activity differences
Table 1. Summary of all experimental data
Number of Number Number of Number Scent visits of of returns waggle runs of bees Wind
Number of Experimental marked bees with by marked recruited Date Maximum Manipulation after experiment details at feeder dances bees to feeder Time of day temperature the experiment
1 Hive 1, capped 152 112 2743 24 27.6.95 L
brood comb 11:00–13:00 h
Hive 2, open 146 122 4287 87 O Exchange low frames
empty comb Slight between hives
NE 23 °C
2 Hive 1, open 144 102 2628 47 29.6.95 L
empty comb 11:15–13:15 h
Hive 2, capped 165 108 1392 18 O Exchange low frames
brood comb Slight between hives
N 24 °C
3 Hive 1, capped 138 62 517 3 30.6.95 L New low frame in
brood comb 11:15–13:15 h hive 1
Hive 2, open 172 94 1878 34 O
empty comb Slight
SE 27 °C
4 Hive 1, open 133 97 2544 90 5.7.95 L Exchange frames
empty comb 11:45–13:45 h within hive 1
Hive 2, open 151 124 3177 86 O
empty comb Slight NW
23 °C
5 Hive 1, capped 161 107 2146 39 6.7.95 L Exchange frames
brood comb 10:45–12:45 h within hive 1
Hive 2, open 147 134 4116 121 O Exchange frames
empty comb Slight N within hive 2
24 °C
6 Hive 1, open 149 105 3747 102 11.7.95 L Exchange frames
empty comb 11:30–13:30 h within hive 1
Hive 2, capped 161 138 4249 43 O Exchange frames
brood comb Slight E within hive 2
34 °C
7 Hive 1, capped 173 120 2808 23 12.7.95 None
brood comb 10:30–12:30 h
2.0 mol l−1
Hive 2, open 186 116 1880 41 None
empty comb Slight
1.5 mol l−1 NW 31 °C
inherent in the two colonies, the dance floors were twice exchanged between the hives (Table 1, experiments 2 and 3). The recruitment success of the five foragers in each hive changed with the nature of the dance floor with which they were provided: recruitment rate was always higher on the open empty cells than on the capped brood cells. The same result was obtained if capped brood combs were exchanged for open empty combs within the same hive or replaced by a new open empty comb that had not previously been in either hive (Table 1, experiments 4–7).
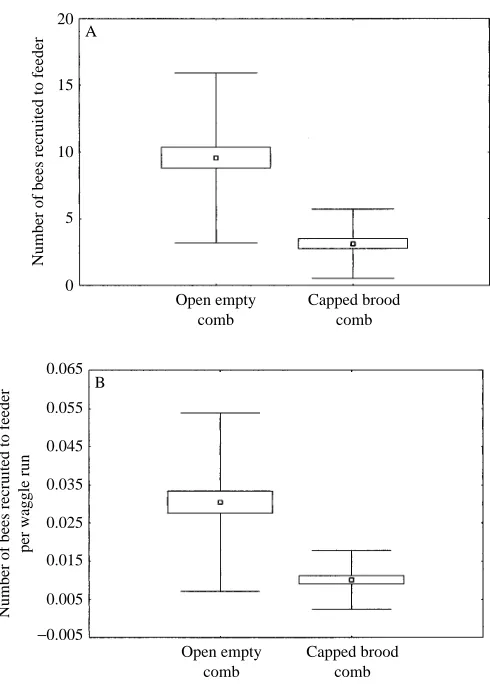
Calculating means for the 15 min intervals over all seven experiments (open empty combs, N=64; capped brood combs, N=48) showed that recruitment success was three times higher on the open empty combs than on the capped brood combs (Fig. 1A). The difference is highly significant (t-test, P<0.001).
Dance duration on open empty combs and capped brood combs
Dance duration was measured by summing the number of
straight runs performed by each bee. Dance duration was found to be slightly longer for bees dancing on the open empty cells than for those on the capped brood cells, but this difference was not statistically significant at the 1 % level (see Table 2). Nevertheless, to exclude the possibility that longer dances were the dominant factor leading to better recruitment on the open empty cells, the recruitment results from both groups were normalized by relating them to their respective dance length. This manipulation did slightly reduce the recruitment success of the bees dancing on the open empty combs but did not alter the highly significant difference between the recruitment success on the open empty combs and that on the capped brood combs (Fig. 1B).
The numbers of recruits and the dance durations co-vary. A statistical analysis of the corresponding data pairs was performed to investigate the strength of the correlation between these two parameters and to determine any differences in the regression lines using data for open empty and capped brood comb dance floors.
Dividing the data into open empty and capped brood comb data sets shows that dance duration is correlated with the number of recruits (P<0.01) for both data sets. The correlation coefficients are r=0.66 for open empty and r=0.69 for capped brood combs. As both r-values are significantly different from zero, it is permissible to calculate linear regressions (Fig. 2), giving a slope of 0.024 for open empty and 0.011 for capped brood combs. The difference between these two slopes is statistically highly significant (P<0.001, Fig. 2).
Dynamics of the recruitment
Recruitment of nestmates to a feeding site is a process with
Fig. 1. (A) The number of bees recruited to each feeder over 2 h by five foragers dancing on open empty (N=64) and capped brood (N=48) dance floors. Means (small squares), S.E.M. (large box) and S.D. (error bars) are of pooled data from all 15 min intervals. (B) The same data normalized to the number of waggle runs to eliminate any possible effect of the longer dances on the empty combs. Foragers dancing on the open empty combs recruit more nestmates than those dancing on the capped brood combs.
B A 20
15
10
5
0
Number of bees recruited to feeder
Open empty comb
Capped brood comb
Number of bees recruited to feeder
per waggle run
Open empty comb
Capped brood comb 0.065
0.055
0.045
0.035
0.025
0.015
0.005
[image:4.595.46.291.332.674.2]−0.005
Fig. 2. The number of bees recruited by foragers dancing on open empty comb (open circles, N=64) and capped brood comb (filled circles, N=48) plotted against the number of waggle runs for each 15 min period. The data for the two colonies are not separated here, but are divided into foragers dancing on open empty or capped brood combs. The straight lines show the linear regressions for the two groups of bees and the broken lines bordering them indicate the threefold S.D. confidence range. The foragers dancing on the open
empty combs recruit more followers than those dancing on the capped brood combs, irrespective of the colony to which they belong.
35
30
25
20
15
10
5
0
Number of bees recruited to feeder
0 200 400 600 800
Number of waggle runs by five foragers in 15 min Open empty comb
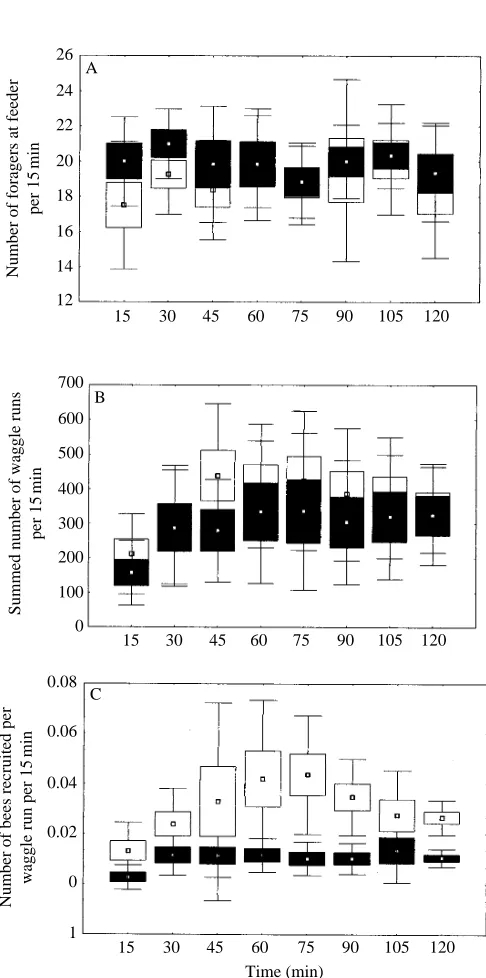
[image:4.595.314.557.488.643.2]its own dynamics. The development over time of the number of visits of foragers to the feeder, the dance durations and the recruitment success can be revealed if the data are analyzed in the consecutive 15 min intervals in which they were collected. The number of visits of the marked foragers to the feeder remained constant throughout the experimental period and there was no difference between those from the hives with open empty cells or capped brood cell dance floors (Fig. 3A). Summed dance duration increased marginally but not statistically significantly, after the first 15 min. The slightly longer dance duration on the open empty cells compared with that on the capped brood cells proved not to be significant (P>0.01) (Fig. 3B).
Recruitment success increased significantly over the first two consecutive 15 min intervals for dances on capped brood cells and over the first three 15 min intervals for dances on the open empty cells. The number of recruits from both hives then remained relatively constant, showing only small, statistically insignificant variations (Fig. 3C).
Reactions of the individual colonies
[image:5.595.44.568.111.187.2]The experiments were designed so that the recruitment successes of the two colonies could be directly compared with one another. In addition, the data allowed us to test the individual reactions of the two colonies to the experimental manipulation and to test whether these reactions were similar. This can be assessed by calculating the correlation coefficients (and plotting the regression lines) between the dance duration and recruitment success for recruitment from dances on open empty and capped brood cells for each colony separately and then comparing these between colonies.
Table 2. Effect of dance-floor properties on foragers and recruits
Number of visits Number of returns Summed number of waggle Number of bees recruited N of marked bees at feeder followed by dances runs by marked bees to feeder per waggle run
Open empty comb 48 19.0±3.3 14.2±3.2 367±196.5 0.0321±0.0259
Capped brood comb 48 19.9±2.4 13.7±4.2 292.7±168.2 0.0101±0.0077
t-test two-tailed P=0.107 P=0.446 P=0.05 P<0.0001
Significance NS NS NS Highly significant
Data are from Table 1 and are pooled from 15 min periods (N=number of 15 min periods) (mean ±S.D.).
The data from experiment 4 (see Table 1) were excluded to obtain only paired data for comparisons between open empty and capped brood combs.
Statistical significance of differences using the t-test is indicated. NS, not significant.
Fig. 3. Dynamics of the recruitment process over a 2 h period. (A) Visits by five foragers to the feeders over successive 15 min intervals. (B) Waggle runs of the five marked foragers summed for each 15 min period. (C) Recruitment success (number of recruits per waggle run) over the 120 min experiment during each 15 min period. Open rectangles represent the data from foragers dancing on open empty combs, filled rectangles represent data from foragers dancing on capped brood combs. Means (small squares), S.E.M. (large box) and
S.D. (error bars) are given for the pooled data from both colonies.
B
C A 26
24
22
20
18
16
14
12
Number of foragers at feeder
per 15
min
15 30 45 60 75 90 105 120
Time (min) 700
600
500
400
300
200
100
0
Summed number of waggle runs
per 15
min
15 30 45 60 75 90 105 120
0.08
0.06
0.04
0.02
0
1
Number of bees recruited per
waggle run per 15
min
[image:5.595.322.565.274.763.2]The slope of the regression line for dances on open empty cells was 0.022 for colony 1 and 0.031 for colony 2. For dances on capped brood cells the slopes were 0.01 for colony 1 and 0.011 for colony 2. There is no significant difference between these slopes from the two colonies.
Discussion
The results presented here show how the recruitment success (as defined in this study) of nestmates to a food source is affected by the nature of the surface on which a forager performs her dance. It is proposed here that an important component of the waggle dance is a signal that is transmitted through the comb and that this signal is influenced by the different physical properties of open empty cell combs and capped brood cell combs.
A variety of gustatory and olfactory signals and cues have been proposed to be important in the context of recruitment of nestmates to a food site; however, many of these are excluded in the experiments reported here because the only difference between the two hives was the nature of the dance floor. Thus, it is more likely that the difference in recruitment success reported here was caused by a mechanical or auditory signal. Aspects of such signals have been analyzed previously in great detail. Vibration of the thorax flight muscles during the waggle run causes an audible sound (Esch, 1961; Wenner, 1962) and this muscle activity also results in wing vibration. The acoustic near-field around the vibrating wings of dancing bees (Michelsen et al. 1987) and the air-stream produced by their oscillating abdomens (Michelsen, 1992) have been measured. The functional significance of the acoustic near-field and abdominally produced air-stream as signals for recruitment was tested using a mechanical model (Michelsen et al. 1992). Oscillation of the model over the surface of a comb (but not in contact with it) resulted in the appearance of bees at the appropriate feeder; however, the model was only about one-tenth as effective as a real bee in directing bees to a feeding site. It is therefore unlikely that either of these two stimuli plays a major role in the production of the threefold difference in recruitment success reported here.
Substratum-borne signals, in contrast, offer a more plausible explanation for the results obtained here, although direct evidence is still lacking. Vibrations from the combs of bees have been recorded in a number of contexts (Fuchs and Königer, 1974; Michelsen et al. 1986; Kirchner, 1993) but have not been detected during dancing (Michelsen et al. 1986). In contrast to the lack of a direct demonstration of surface vibrations associated with the dance, there are a number of behavioural observations that support the hypothesis that substratum-borne vibration is an important channel for communication of signals between dancing and follower bees. Lindauer and Kerr (1958) demonstrated that successful Melipona scutellaris foragers received less attention if the different sections of the nest were separated by plastic foam, which presumably considerably damped vibration of the combs.
Seeley (1989) and Seeley and Towne (1992) have described precisely the nature of the dance floors (capped brood cell combs) in their observation hives, which allows a direct comparison of their data with that presented here for capped brood cell combs. Their quantitative data on dancing and recruitment match very well with those reported here. To draw just one example from their data: Seeley (1989) found that 30 foragers recruited about 20 followers within 15 min to a 2 mol l21sugar solution, which is about the same ratio as in the present study, where three followers were recruited by five foragers. Further support for the proposal that open empty cell combs make better dance floors comes from the unpublished observation that, in wild honeybee colonies, foragers prefer to dance on the open empty cells along the lower edge of a centrally located comb (T. D. Seeley, personal communication). We have also noted that most dancers in our own colonies are concentrated on the centrally located combs in the hives and that these combs contain large areas of empty cells (J. Tautz and M. Lindauer, unpublished observations).
If the nature of the dance floor is important for the communication of signals between the dancer and the recruits, it is to be expected that the foragers or recruits would behave differently on different substrata. However, the interaction between dancers and followers during the dance and while exchanging food appears to be the same on both dance-floor types. The marked foragers showed no differences in the frequency of their visits to the feeders, nor was the percentage of marked foragers that returned to the hives and danced altered. The only difference noted was the tendency for dance duration on the open empty cells to be slightly greater. An analysis of recruitment on open empty and capped brood combs shows that, for a given dance length, the number of recruits is twice as large on open empty combs as on capped brood combs. This could be interpreted to mean either that recruits are motivated more strongly or that they understand the signals better from dances on open empty cells.
The motivation to produce dances is determined mainly by the overall nutritional status of the nest (Lindauer, 1952, 1954; Seeley, 1989). The two observation hives that were used in the experiments reported here were virtually identical in terms of the proportion of different cell types and the amount of honey stored, so that the motivational state of bees in both would have been very similar. However, in addition to differences in communication efficiency, the motivation to follow dances or to go on a search flight might also be influenced by the type of dance floor. However, a comparison of the entry/exit activity between the two hives did not reveal any differences correlated with the nature of the dance floor.
recruitment to date, a result that indicates the importance of the floor as a channel for communication between dancer and recruits.
I thank D. C. Sandeman for his help with a first version of the manuscript, M. Lindauer, F. Roces and B. Hölldobler for fruitful discussions, H. Demmel for his great support with the colonies and M. Bürger, S. Hebele, M. Goßner, S. Güllük, S. Hegele and M. Steigerwald for their careful support with the field work.
References
ARISTOTLE(approximately 300 BC). Historia Animalium, Book IX.40 (vol. III, vol. IV). London: Oxford University Press.
ESCH, H. (1961). Über die Schallerzeugung beim Werbetanz der Honigbiene. Z. vergl. Physiol. 45, 1–11.
FRIESEN, L. J. (1973). The search dynamics of recruited honey bees, Apis mellifera ligustica Spinola. Biol. Bull. mar. biol. Lab., Woods Hole 144, 107–131.
FUCHS, S ANDKÖNIGER, N. (1974). Schallerzeugung im Dienste der
Verteidigung des Bienenvolkes (Apis cerana Fabr.). Apidologie 5, 271–287.
GOULD, J. L. (1975). Honey bee recruitment: the dance-language controversy. Science 189, 685–693.
HALDANE, J. B. S. ANDSPURWAY, H. (1954). A statistical analysis of communication in Apis mellifera and a comparison with communication in other animals. Insectes Sociaux 1, 247–283. KIRCHNER, W. H. (1993). Vibrational signals in the tremble dance of
the honeybee, Apis mellifera. Behav. Ecol. Sociobiol. 33, 169–172. LINDAUER, M. (1948). Über die Einwirkung von Duft- und
Geschmackstoffen sowie anderer Faktoren auf die Tänze der Bienen. Z. vergl. Physiol. 31, 348–412.
LINDAUER, M. (1952). Ein Beitrag zur Frage der Arbeitsteilung im Bienenstaat. Z. vergl. Physiol. 36, 299–345.
LINDAUER, M. (1954). Temperaturregulierung und Wasserhaushalt im Bienenstaat. Z. vergl. Physiol. 36, 391–432.
LINDAUER, M. (1955). Schwarmbienen auf Wohnungssuche. Z. vergl. Physiol. 37, 263–324.
LINDAUER, M. ANDKERR, W. (1958). Die gegenseitige Verständigung bei den stachellosen Bienen. Z. vergl. Physiol. 41, 405–434. MICHELSEN, A. (1992). Honningbiens Dansesprog. Signaler og
Samfundsliv. Munksgaard: Nysyn.
MICHELSEN, A., ANDERSEN, B. B., STORM, J., KIRCHNER, W. H. AND
LINDAUER, M. (1992). How honeybees perceive communication
dances, studied by means of a mechanical model. Behav. Ecol. Sociobiol. 30, 143–150.
MICHELSEN, A., KIRCHNER, W. H. ANDLINDAUER, M. (1986). Sound and vibrational signals in the dance language of the honey bee, Apis mellifera. Behav. Ecol. Sociobiol. 18, 207–212.
MICHELSEN, A., TOWNE, W. F., KIRCHNER, W. H. AND KRYGER, P.
(1987). The acoustic near-field of a dancing honeybee. J. comp. Physiol. 161, 633–643.
NACHTIGALL, W. ANDKRESLING, B. (1992). Bauformen der Natur. Teil II. Technische Biologie und Bionik von Platten- und Faltkonstruktionen. Naturwissenschaften 79, 251–259.
SEELEY, T. D. (1986). Social foraging by honeybees: How colonies
allocate foragers among patches of flowers. Behav. Ecol. Sociobiol.
19, 343–354.
SEELEY, T. D. (1989). Social foraging in honey bees: How nectar foragers assess their colony’s nutritional status. Behav. Ecol. Sociobiol. 24, 181–199.
SEELEY, T. D. (1994). Honey bee foragers as sensory units of their
colonies. Behav. Ecol. Sociobiol. 34, 51–62.
SEELEY, T. D. ANDTOWNE, W. F. (1992). Tactics of dance choice in
honey bees: do foragers compare dances? Behav. Ecol. Sociobiol.
30, 59–69.
SOKAL, R. R. ANDROHLF, F. J. (1981). Biometry. New York: W. H. Freeman and Company.
STECHE, W. (1957). Gelenkter Bienenflug durch ‘Attrappentänze’. Naturwissenschaften 44, 598.
TOWNE, W. F. ANDGOULD, J. L. (1988). The spatial precision of the honey bees’ dance communication. J. Insect Behav. 1, 129–155.
VONFRISCH, K. (1923). Über die ‘Sprache’ der Bienen. Zool. Jb. Abt. Allg. Zool. Physiol. Tiere 40, 1–186.
VON FRISCH, K. (1946). Die Tänze der Bienen. Österr. Zoolog. Zeitschr. 1, 1–48.
VONFRISCH, K. (1965). Tanzsprache und Orientierung der Bienen. Berlin, Heidelberg, New York: Springer.
WENNER, A. M. (1962). Sound production during the waggle dance of the honey bee. Anim. Behav. 10, 79–95.
WENNER, A. M., MEADE, D. E. ANDWELLS, L. J. (1991). Recruitment, search behavior and flight ranges of honey bees. Am. Zool. 31, 768–782.
WENNER, A. M., WELLS, P. H. ANDJOHNSON, D. L. (1969). Honeybee