T2 Relaxation Values in the Developing
Preterm Brain
Serena J. Counsell, Nigel L. Kennea, Amy H. Herlihy, Joanna M. Allsop, Michael C. Harrison, Frances M. Cowan, Joseph V. Hajnal, Bridget Edwards, A. David Edwards, and Mary A. Rutherford
BACKGROUND AND PURPOSE:MR imaging is increasingly used to assess maturation and disease in the preterm brain. Knowledge of the changes in T2 values with increasing postmen-strual age (PMA) will aid image interpretation and help in the objective assessment of maturation and disease of the brain in infants. The aim of this study was to obtain T2 values in the preterm brain from 25 weeks’ gestational age (GA) until term-equivalent age in infants who had normal neurodevelopmental findings at a minimum corrected age of 1 year.
METHODS:The study group consisted of 18 preterm infants, born at 33 weeks’ GA or sooner. The median GA of the infants at birth was 27 weeks (range, 23–33 weeks), and the median PMA at imaging was 31 weeks (range, 25– 41 weeks). T2 measurements were obtained using a 1.0-T MR system and a four-echo pulse sequence (TR/TE, 2500/ 30, 60, 110, and 600). T2 values were measured in the thalami, lentiform nuclei, frontal white matter, occipital white matter, and central white matter at the level of the centrum semiovale.
RESULTS: A significant negative linear correlation between T2 values and PMA was dem-onstrated in the lentiform nuclei (Pⴝ.003), frontal white matter (P< .0001), occipital white matter (P< .0001), and central white matter at the level of the centrum semiovale (P< .0001). T2 values were not significantly reduced with increasing PMA in the thalami (Pⴝ.06).
CONCLUSION:T2 values decrease with increasing PMA in the preterm brain.
MR imaging has proved to be a useful tool for inves-tigating the developing preterm brain (1–5), and an increasing number of centers are using MR imaging to assess cerebral disease in preterm infants. In addi-tion to the qualitative assessment of MR images, quantitative MR techniques are available, including the measurement of T2 values. T2 values are related to the tissue water content and higher in free water than in water bound to macromolecules, such as my-elin lipids and proteins. While cerebral T2 values have been investigated in neonates born at term (6) and in preterm infants at term (7), little is known
about T2 values in the developing preterm brain. Knowledge of the changes in T2 values with increas-ing postmenstrual age (PMA) in the preterm period will aid the evaluation of MR images in this group of patients, and T2 measurements may provide a quan-titative method of assessing maturation and disease in the preterm brain.
The aim of this study was to obtain T2 values in the preterm brain from 25 weeks’ gestational age (GA) until term-equivalent age to establish the relationship between PMA and T2 values in preterm infants with no evidence of disease in the cerebral white matter on MR images and with normal neurologic findings at a minimum corrected age of 1 year.
Methods
Approval of this study was granted by the local research ethics committee, and written informed parental consent was obtained for each infant.
Pulse Sequence Verification
Verification tests were performed on a gel phantom. The phantom was imaged by using nine separate conventional spin-echo (CSE) pulse sequences with a TR/TE of 2500/10, 20, 50, 100, 200, 300, 400, 500, and 600. Measurements were taken from a 865-mm2circular region of interest (ROI) positioned in the center of the phantom images. T2 values were calculated by fitting the data with the following equation:y⫽M0⫻exp(⫺x/ Received December 17, 2002; accepted after revision April 28,
2003.
From the Robert Steiner MR Unit, Imaging Sciences Depart-ment, MRC Clinical Sciences Centre (S.J.C., A.H.H., J.M.A., J.V.H., A.D.E., M.A.R.) and the Department of Paediatrics (N.L.K., M.C.H., F.M.C., B.E., A.D.E., M.A.R.), Hammersmith Campus, Imperial College, DuCane Road, London, England.
Funding from the Medical Research Council, Philips Medical Systems, and the Garfield Weston Foundation.
This work was presented at the Annual Meeting of the Interna-tional Society of Magnetic Resonance in Medicine, Glasgow, Scot-land, 2001.
Address reprint request to Dr Mary A Rutherford, Robert Steiner MR Unit, Imaging Sciences Department, MRC Clinical Sciences Centre, Imperial College, Hammersmith Campus, Du-Cane Road, London, W12 0HS, England.
©American Society of Neuroradiology
T2), whereyis the signal intensity,M0is the proton density, and xis the TE.
Additionally, the phantom was imaged by using a purposely designed four-echo CSE pulse sequence (2500/30, 60, 110, and 600), and T2 was calculated by using the same method. In both cases, four transverse sections were obtained with a field of view of 20 cm, a section thickness of 4 mm, and a section gap of 4 mm to reduce interference between sections. The T2 values obtained by using these two sequences were compared.
Subjects
The study group consisted of 18 preterm infants, nine male and nine female, born at 33 weeks’ GA or sooner. None of the infants had evidence of a genetic, metabolic, or viral infective disorder. No infant had neurologic complications in the neo-natal period. The median GA of the infants was 27 weeks (range, 25–33 weeks) at birth, and the median birth weight of the infants was 986 g (range, 696–2040 g). The median PMA of the infants at imaging was 31 weeks (range, 25–41 weeks), and the median postpartum age at imaging was 1 week (range, 0–15 weeks). Four infants were imaged twice between birth and term-equivalent age. GA was calculated from the date of the mother’s last menstrual period and confirmed with early ante-natal sonograms.
Outcome Assessments
Two experienced neurodevelopmental pediatricians who were unaware of the imaging findings (F.M.C., B.E.) assessed all of the children. All had a developmental quotient ofⱖ85 (median, 98.5; range, 85–114), which was obtained by using the revised Griffiths scales (8) at a corrected age of between 1 and 2 years. They all achieved an optimality score ofⱖ64 (median, 74; range, 65–78) on a standardized infant neurologic exami-nation (9); this score was compatible with independent walking by 2 years of age (10). None had cerebral palsy. All showed head growth within 1 SD of their birth measurements.
MR Imaging
MR imaging was performed using a 1.0-T MR system (Phil-ips Medical Systems, Best, the Netherlands) situated in the neonatal intensive care unit, which allowed very preterm in-fants to be imaged without compromising their intensive care (11). This system had a short bore that allowed access to the infants at all times during imaging with a relatively small area of homogeneous field (central volume of 120-mm diameter and 50-mm thickness at⫾2.9 ppm) (12). The patients’ pulse oxim-etry readings, electrocardiographic findings, and temperature were monitored, and an experienced neonatologist (N.L.K., M.C.H.) remained in the imaging room throughout the proce-dure. In the early neonatal period, seven infants were venti-lated or received continuous positive airways pressure at the time of their MR examination. When possible, infants were imaged during postprandial sleep; however, oral chloral hy-drate (20–30 mg/kg) was usually required to successfully image the infants at term-equivalent age.
Transverse T1-weighted CSE (600/20) and T2-weighted fast spin-echo (TR/TEeff, 3500/208) images were obtained in each case. To obtain MR images of the whole head within the constraints of the homogeneous field, infants were initially positioned so that the level of the basal ganglia was at the isocenter, and images were obtained at this level. The bed of the imager was then moved out of the bore of the magnet so that the central white matter region was at the isocenter, and images were acquired at this level. Finally, the bed was moved toward the bore so that the cerebellum was at the isocenter (infantsⱕ30 weeks’ GA were imaged in two sections).
T2 measurements were obtained by using the purposely designed four-echo CSE pulse sequence described before (2500/30, 60, 110, and 600). As in the pulse sequence
verifica-tion tests, four transverse secverifica-tions were obtained with a field of view of 20 cm, a section thickness of 4 mm, and a section gap of 4 mm. To ensure that the central white matter and basal ganglia regions were within the area of the homogeneous field, the infants were positioned so that the midventricular region was at the isocenter for the T2 measurement sequence. The acquisition time for this sequence was 5 minutes 35 seconds.
Region of Interest Analysis
ROIs were placed in the thalami, lentiform nuclei, frontal white matter, occipital white matter, and central white matter at the level of the centrum semiovale, bilaterally (Figs 1–3). ROI measurements were not obtained from the cortical gray matter, as it was not possible to avoid partial volume averaging from adjacent CSF or subcortical white matter. Because of section positioning error, T2 measurements were not obtained at the level of the centrum semiovale in two subjects. The ROIs (area, 10.09–23.97 mm2) were initially positioned on the im-ages obtained with a TE of 30 ms, as this provided the best image contrast, and then copied onto the other three images. Consistency of positioning was ensured by having a single investigator (S.J.C) place all ROIs. This investigator was un-aware of the infant’s PMA. ROIs were positioned to prevent partial volume averaging from cortical gray matter or CSF. T2 values were calculated by using the fitting equation described earlier.
The analysis was repeated, including the placement of the ROIs, and test-retest consistency was evaluated by means of the coefficient of reliability (13). Statistical analysis of the data were performed by using STATA version 7 (STATA Corpora-tion, College StaCorpora-tion, TX). Unpairedttests showed no signif-icant difference between the right and left hemispheres (P⬎
.05). Therefore, a mean figure was calculated from the bilateral measurements to provide T2 values for each region. Linear regression analysis was performed to test the relationship be-tween PMA and T2. Because four infants were imaged twice, robust variance estimates were used to account for the re-peated measures. (Robustspecifies that the Huber/white/sand-wich estimator of variance is used in place of the conventional estimator of variance and adjusts the significance values ob-tained to take multiple measurements in individual infants into account [14]). Additionally, the data were divided into three groups on the basis of patient age: ⱕ30 weeks’ PMA, 31–36 weeks’ PMA, and term-equivalent age 37–41 weeks’ PMA. Regional variation within each age group was assessed by using a one-way analysis of variance with a Bonferroni test for mul-tiple comparisons.
Results
Phantom Tests
The T2 value of the gel phantom obtained by using nine separate CSE sequences was 315 ms ⫾11, and the T2 value obtained by using the four-echo CSE sequence was 311 ms⫾18. The measured variability of the four-echo CSE sequence was⬍3%.
MR Images
T2 Values
The mean T2 values at ⱕ30 weeks’ PMA, 31–36 weeks’ PMA, and at term-equivalent age are shown in Table 1.
Relationship between T2 Values and PMA
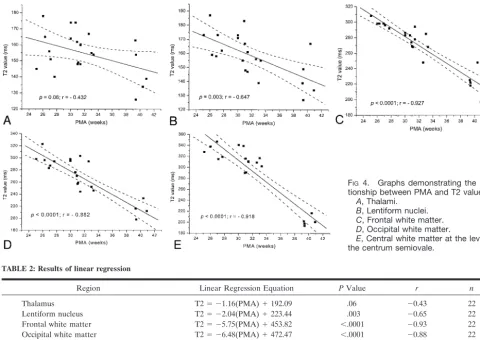
A significant negative linear correlation between T2 values and PMA was demonstrated in the lentiform nuclei (P⫽ .003;r⫽ ⫺0.65), the frontal white matter (P⬍.0001;r⫽ ⫺0.93), the occipital white matter (P⬍
.0001;r⫽ ⫺0.88), and the central white matter at the level of the centrum semiovale (P ⬍ .0001; r ⫽ ⫺0.92). The reduction in T2 values with increasing PMA in the thalami was not significant (P⫽.06;r⫽ ⫺0.43). Figure 4 shows the relationship between T2 and PMA for each region examined. Table 2 demon-strates the results of linear regression for each region.
Regional Variation
There was no significant difference in T2 values between the thalamus and lentiform nuclei for any of the three age groups (P⬎.999). However, T2 values in both the thalami and the lentiform nuclei were significantly lower than those in all white matter re-gions for all three age groups (P ⬍ .001 for all re-gions). Within the white matter regions, there was no significant difference between T2 values in the frontal and those in the occipital white matter (P.999 for all age groups). Before term-equivalent age, T2 values in
the central white matter of the centrum semiovale were significantly higher than those in both the fron-tal white matter (P⬍.001 forⱕ30 weeks’ and 31–36 weeks’ PMA) and the occipital white matter (P⬍.001 for ⱕ30 weeks’ and 31–36 weeks’ PMA). At term-equivalent age, however, there was no significant dif-ference in T2 values between the central white matter of the centrum semiovale and those of either the frontal white matter (P⫽ .49) or the occipital white matter (P.999).
Test-retest variability was low for each region. Val-ues were as follows: thalami, 2.8%; lentiform nuclei, 3.4%; frontal white matter, 3.2%; occipital white mat-ter, 3.9%; and the central white matter at the level of the centrum semiovale, 2.7%.
Discussion
The results of this study demonstrated that T2 values in the developing cerebral white matter and central gray matter structures decrease with increas-ing PMA in preterm infants. T2 relaxation times are time constants governing the decay of transverse mag-netization after the application of a radio-frequency pulse, due to spin-spin interactions and local mag-netic field inhomogeneities. Additionally, the diffu-sion of water molecules reduces T2 relaxation times. T2 values are related to the water content and whether the water is free or bound to macromole-cules. The values are longer in free water, in which
FIG 1. MR images in an infant at 30
weeks’ PMA demonstrate positioning of the ROIs in the thalami (T), lentiform nuclei (L), and occipital white matter (W) on the left side.
A, TE of 30 ms.
B, TE of 60 ms.
C, TE of 110 ms.
[image:3.603.215.534.59.375.2]interactions between protons are weaker, than in bound water.
The four-echo CSE pulse sequence used in this study did not have built-in crusher gradients. Al-though this lack is potentially a source of error, the results obtained by using the gel phantom showed that this sequence was accurate when compared with several single-echo sequences. Additionally, insuffi-cient TEs were acquired to examine multiexponential components of the T2 decay curves. The main advan-tage of this four-echo sequence was that T2 values of the preterm brain could be determined in a clinically acceptable time, which is extremely important in im-aging this vulnerable patient group. The pulse se-quence used in this study allowed only four sections; therefore, we positioned the sections to cover most of the cerebral white matter, as preterm birth is fre-quently associated with white matter disease (15, 16). The T2 values obtained in the preterm brain in this study were higher than those reported in adults (17– 22), and T2 values in the unmyelinated white matter were higher than those in central gray matter struc-tures, which is the reverse of the values in the adult brain. Maturational decreases in T2 have been ob-served in other studies (6, 7, 23–27). The findings cannot be directly compared because different field strengths were used. However, the results of this study were similar to those of preterm infants at 37 weeks’ PMA who underwent imaging at 2.35 T (thal-amus, 151 ms⫾ 11; frontal white matter, 266 ms ⫾
35; occipital white matter, 213 ms ⫾ 28) (7) and to
those in term-born neonates in the early neonatal period who underwent imaging at 2.4 T (thalamus, 135.5 ms ⫾ 12.9; frontal white matter, 228.1 ms ⫾
32.3) (6). Additionally, in their MR spectroscopic study, Cady et al (28) reported T2 values of 165 ms⫾
18 in the thalamus and 223 ms ⫾ 32 in the parieto-occipital white matter in infants imaged at 32–42 weeks’ PMA at 2.4 T.
In this study, the reduction in T2 values in the cerebral white matter over time in the very preterm brain is unlikely to be due to myelination, because myelination is not evident in the white matter of the cerebral hemispheres before 34 weeks’ GA, as as-sessed at histologic examination (29). In addition, this finding is not demonstrated on MR images obtained before 36 weeks’ PMA (30). Glycolipid, cholesterol, and protein in the brain increases as the neonatal brain matures, and the water decreases (31). The reduction in T2 with increasing PMA in the very preterm brain most likely reflects a reduction in the free water content. Additionally, premyelination changes, including the development of myelin precur-sors, may also contribute to the decrease in T2 values (32). Perinatal factors such as the time from delivery, the method of delivery, and the intravenous adminis-tration of fluid may exert an acute effect on the water content of the brain and, therefore, on the T2 value. However, too few patients were assessed in this study to allow us to address this issue.
Although Thornton et al (6) observed a significant negative linear correlation between T2 and PMA in
FIG 2. MR images in an infant at 27
weeks’ PMA with minimal ventricular dila-tation demonstrate positioning of the ROI in the frontal white matter on the left side.
A, TE of 30 ms.
B, TE of 60 ms.
C, TE of 110 ms.
the thalamus in term infants, the decrease in T2 with increasing PMA in this study just failed to reach significance. In addition, the rate of decrease in T2 values with increasing age in the lentiform nuclei was less than that of the cerebral white matter. This ob-servation probably reflects the earlier commence-ment of myelination in central gray matter structures and that myelination is still underway at the PMAs studied here. Indeed, microscopy shows myelination in the globus pallidus, the pallidothalamic fibers of the posterior limb of the internal capsule, and the ventrolateral nuclei of the thalamus at 25 weeks’ GA (33). Other fibers and nuclei become myelinated later. For example, ascending thalamocortical fibers do not demonstrate histologic evidence of myelina-tion before 32 weeks’ GA (33), and the cycle of myelination of the fibers of the outer segment of the
globus pallidum continues beyond 1 year post term (34). In this study, we did not attempt to differentiate separate nuclei and fiber bundles of the thalamus and lentiform nuclei, as these structures are too small in the preterm brain for us to confidently avoid position-ing error and partial volume averagposition-ing. In addition to myelination, the maturation of astrocytes and neu-rons within the thalami may also contribute to a reduction in T2 values. As neurons enlarge, the ex-tracellular space—and therefore the free water con-tent—decreases. Increasing neuronal complexity re-sults in more bound molecules, which may also contribute to a reduction in T2 values.
Before term-equivalent age, T2 values in the white matter of the centrum semiovale were higher than those in the frontal or occipital white matter. How-ever, at term-equivalent age, we did not find a
re-FIG 3. Images in an infant at 27 weeks’
PMA demonstrate positioning of the ROI in the central white matter of the centrum semiovale on the left side.
A, TE of 30 ms.
B, TE of 60 ms.
C, TE of 110 ms.
[image:5.603.91.531.49.507.2]D, TE of 600 ms.
TABLE 1: Mean T2 values
Region T2 Values, msec*
ⱕ30 weeks’ GA (n⫽8)
31–36 weeks’ GA (n⫽9)
37–41 weeks’ GA† (n⫽5) Thalamus 159.1⫾13.5 157.4⫾9.1 143.2⫾15.1 Lentiform 169.5⫾9.6 156.8⫾12.8 143.2⫾15.5 Frontal white matter 294.9⫾7.9 274.1⫾13.2 222.0⫾18.2 Occipital white matter 296.8⫾11.9 266.8⫾20.8 211.4⫾14.6 Central white matter at the level of the centrum semiovale 331.2⫾12.8‡ 309.4⫾14.8 202.4⫾8.7
[image:5.603.215.534.58.377.2]gional variation in T2 values in the white matter. A regional variation in T2 values in the white matter at this age has been reported previously and attributed to regional variations in myelination and premyelina-tion events (7). In most term neonates, myelin is evident in the corticospinal tracts at the level of the centrum semiovale on MR images; myelin is rarely evident in the optic radiations, and it is not evident in the frontal white matter (35). Furthermore, myelina-tion is evident in the corona radiata and corticospinal tracts at the level of the centrum semiovale in preterm infants at term-equivalent age, but it is not demon-strated in the optic radiations or frontal white matter (30). Therefore, one would expect T2 values to be lower in the central white matter of the centrum semiovale than in the frontal or occipital white mat-ter. While the mean T2 values in the central white matter of the centrum semiovale at term-equivalent age were slightly lower than those in the other white matter regions, these values were not significantly different. This finding may have been due to the small number of infants studied at this age (n⫽5).
In this study, we included only apparently healthy but extremely preterm infants who had brain MR images without any focal changes of known pathologic impor-tance. We also included only infants whose outcome was considered normal in terms of their developmental quo-tient, neurologic status, and head growth between 1 and 2 years. Therefore, we consider these infants optimal
within the limits of our ability to assess them at this young age. We accept the fact that the concept of nor-mality in this extremely preterm population is relative and that they may have some neurodevelopmental problems that become apparent only at an older age (36, 37). Within these caveats, our T2 data may be representative of normal findings. Knowledge of the changes in T2 values with development in such preterm infants is essential to the assessment of MR images in this group of infants.
Conclusion
T2 values in the cerebral white matter and central gray matter structures decrease from 25 weeks’ GA to term. This rate of decrease is greatest in the central white matter at the level of the centrum semiovale and least in the thalamus. In the cerebral white mat-ter, these reductions in T2 commence before myeli-nogenesis and probably reflect a reduction in the cerebral water content.
References
1. Battin MR, Maalouf EF, Counsell SJ, et al.Magnetic resonance imaging of the brain in very preterm infants: visualization of the germinal matrix, early myelination, and cortical folding.Pediatrics
1998;101:957–962
2. Huppi PS, Warfield S, Kikinis R, et al. Quantitative magnetic resonance imaging of brain development in premature and mature newborns.Ann Neurol1998;43:224–235
FIG 4. Graphs demonstrating the rela-tionship between PMA and T2 values.
A, Thalami.
B, Lentiform nuclei.
C, Frontal white matter.
D, Occipital white matter.
[image:6.603.54.534.57.397.2]E, Central white matter at the level of the centrum semiovale.
TABLE 2: Results of linear regression
Region Linear Regression Equation PValue r n
[image:6.603.56.533.327.399.2]3. Sie LT, van der Knaap MS, Wezel-Meijler G, Valk J.MRI assess-ment of myelination of motor and sensory pathways in the brain of preterm and term-born infants.Neuropediatrics1997;28:97–105 4. van der Knaap MS, Wezel-Meijler G, Barth PG, Barkhof F, Ader
HJ, Valk J.Normal gyration and sulcation in preterm and term neonates: appearance on MR images.Radiology1996;200:389–396 5. Childs AM, Ramenghi LA, Evans DJ, et al.MR features of devel-oping periventricular white matter in preterm infants: evidence of glial cell migration.AJNR Am J Neuroradiol1998;19:971–976 6. Thornton JS, Amess PN, Penrice J, Chong WK, Wyatt JS, Ordidge
RJ. Cerebral tissue water spin-spin relaxation times in human neonates at 2.4 tesla: methodology and the effects of maturation.
Magn Reson Imaging1999;17:1289–1295
7. Ferrie JC, Barantin L, Saliba E, et al.MR assessment of the brain maturation during the perinatal period: quantitative T2 MR study in premature newborns.Magn Reson Imaging1999;17:1275–1288 8. The Griffiths Mental Development Scales 1996 Revision.Oxon: The
Test Agency; 1996.
9. Haataja L, Mercuri E, Regev R, et al.Optimality score for the neurological examination of the infant at 12 and 18 months of age.
J Pediatr1999;135:153–161
10. Frisone MF, Mercuri E, Laroche S, et al.Prognostic value of the neurological optimality score in preterm infants born under 31 weeks gestation examined between 9 and 18 months. J Pediatr
2002:140;57–60
11. Battin M, Maalouf EF, Counsell S, et al.Physiological stability of preterm infants during magnetic resonance imaging.Early Hum Dev1998;52:101–110
12. Hall AS, Young IR, Davies FJ, Mohapatra SN.A dedicated mag-netic resonance system in a neonatal intensive therapy unit.In: Bradley WG, Bydder GM, eds.Advanced MR Imaging Techniques.
London: Martin Dunitz; 1997:281–290
13. Bland JM, Altman DG.Statistical methods for assessing agree-ment between two methods of clinical measureagree-ment.Lancet1986; 327:307–310
14. Huber HP. On the problem of variance - analytical reliability estimation in correlated measurement errors.Arch Gesamte Psy-chol1967;119:288–296
15. Maalouf EF, Duggan PJ, Rutherford MA, et al.Magnetic reso-nance imaging of the brain in a cohort of extremely preterm infants.J Pediatr1999;135:351–357
16. Kuban KC, Leviton A.Cerebral palsy.N Engl J Med1994;330:188–195 17. Breger RK, Yetkin FZ, Fischer ME, Papke RA, Haughton VM, Rimm AA. T1 and T2 in the cerebrum: correlation with age, gender, and demographic factors.Radiology1991;181:545–547 18. Kjos BO, Ehman RL, Brant-Zawadzki M, Kelly WM, Norman D,
Newton TH.Reproducibility of relaxation times and spin density calculated from routine MR imaging sequences: clinical study of the CNS.AJR Am J Roentgenol1985;144:1165–70
19. Vymazal J, Righini A, Brooks RA, et al.T1 and T2 in the brain of healthy subjects, patients with Parkinson disease, and patients with multiple system atrophy: relation to iron content.Radiology
1999;211:489–495
20. Whittall KP, MacKay AL, Graeb DA, Nugent RA, Li DK, Paty DW.In vivo measurement of T2 distributions and water contents
in normal human brain.Magn Reson Med1997;37:34–43 21. Agartz I, Saaf J, Wahlund LO, Wetterberg L.T1 and T2 relaxation
time estimates in the normal human brain.Radiology 1991;181: 537–543
22. Wansapura JP, Holland SK, Dunn RS, Ball WS, Jr.NMR relax-ation times in the human brain at 3.0 tesla.J Magn Reson Imaging
1999;9:531–538
23. Holland BA, Haas DK, Norman D, Brant-Zawadzki M, Newton TH.MRI of normal brain maturation.AJNR Am J Neuroradiol
1986;7:201–208
24. Ono J, Kodaka R, Imai K, et al.Evaluation of myelination by means of the T2 value on magnetic resonance imaging.Brain Dev
1993;15:433–438
25. Baierl P, Forster C, Fendel H, Naegele M, Fink U, Kenn W. Magnetic resonance imaging of normal and pathological white matter maturation.Pediatr Radiol1988;18:183–189
26. Miot E, Hoffschir D, Poncy JL, Masse R, Le Pape A, Akoka S. Magnetic resonance imaging in vivo monitoring of T2 relaxation time: quantitative assessment of primate brain maturation.J Med Primatol1995;24:87–93
27. Fulford J, Ong S, Baker PN, James D, Gowland PA.Fetal brain maturation measured using T2.In:Proceedings of the International Society for Magnetic Resonance in Medicine. Berkeley: International Society for Magnetic Resonance in Medicine; 2002:462
28. Cady EB, Penrice J, Amess PN, et al.Lactate, N-acetylaspartate, choline and creatine concentrations, and spin-spin relaxation in thalamic and occipito-parietal regions of developing human brain.
Magn Reson Med1996;36:878–886
29. Gilles FH, Shankle W, Dooling EC. Myelinated tracts: growth patterns.In: Gilles FH, Leviton A, Dooling EC, eds.The Develop-ing Human Brain: Growth and Epidemiological Neuropathology. Bos-ton: Wright; 1983:117–183
30. Counsell SJ, Maalouf EF, Fletcher AM, et al.Magnetic resonance imaging assessment of myelination in the very preterm brain.
AJNR Am J Neuroradiol2002;23:872–881
31. Dobbing J, Sands J.Quantitative growth and development of hu-man brain.Arch Dis Child1973;48:757–767
32. Miot-Noirault E, Barantin L, Akoka S, Le Pape A.T2 relaxation time as a marker of brain myelination: experimental MR study of two neonatal animal models.J Neurosci Methods1997;72:5–14 33. Hasegawa M, Houdou S, Mito T, Takashima S, Asanuma K, Ohno
T. Development of myelination in the human fetal and infant cerebrum: a myelin basic protein immunohistochemical study.
Brain Dev1992;14:1–6
34. Yakolev PI, Lecours AR.The myelogenic cycles of regional matu-ration of the brain.In Minowski A, ed.Regional Development of the Brain in Early Life.Oxford: Blackwell; 1967:3–70
35. Barkovich AJ.MR of the normal neonatal brain: assessment of deep structures.AJNR Am J Neuroradiol1998;19:1397–1403 36. Marlow N, Roberts L, Cooke R.Outcome at 8 years for children