With only a few exceptions, fish have body and muscle temperatures closely related to ambient water temperature. This affects metabolic activity (Brett, 1979), and is a major factor controlling muscle growth (Loughna and Goldspink, 1985) and in determining muscle phenotype (Johnston et al., 1975). Studies on several fish species have shown that the early stages of development are particularly sensitive to environmental temperature, which can affect muscle cellularity and the dynamics of muscle development and growth (Stickland et al., 1988; Sumpter, 1992).
Muscle in fish, which is the major edible tissue, represents about 60 % of total body mass. Skeletal muscle development in fish differs from that of mammalian muscle in that in fish muscle mass continues to increase throughout the animal’s lifetime by hyperplasia and hypertrophy (Weatherley et al., 1988). In mammals it has been shown that, after embryological
differentiation, muscle growth occurs mainly by hypertrophy of existing fibres (Stickland, 1983). However, in fish the initial developmental processes may determine the extent of both muscle hyperplasia and muscle hypertrophy post-hatching (Veggetti et al., 1990).
Myogenic regulatory factors (MRFs), such as MyoD and myogenin, play an important role in the initial formation and differentiation of skeletal muscle (Weintraub et al., 1989; Krempler and Brenig, 1999; Sabourin and Rudnicki, 2000). Fish as ectotherms offer the possibility of manipulating the levels of MRFs thus enabling the effects on development to be studied in relation to number of muscle fibres formed and the expression of structural genes. In rainbow trout, recent studies have indicated that the timing and spatial expression of myogenic regulatory factors (MRFs) are important during early development. Two MyoD genes exist in trout, TMyoD
Printed in Great Britain © The Company of Biologists Limited 2001 JEB3393
The influence of changes in environmental temperature on the mRNA levels of myogenic regulatory factors (MRFs), i.e. MyoD and myogenin, as well as myosin heavy chain (MyHC) were studied during early larval development in rainbow trout and sea bass. Phosphoimager analysis of northern blots indicated that there is an optimum temperature for the RNA transcript levels of MRF and MyHC RNA in trout and in sea bass larvae. In the trout strain studied, the highest concentration for MRF and MyHC transcripts was found at 8 °C rather than 4 °C or 20 °C. In European sea bass, the highest concentrations of MRF and MyHC mRNA were observed at 15–20 °C rather than 13 °C. Raising sea bass larvae at 15 °C was associated with higher MyHC
gene expression as well as a trend towards an increase in total muscle fibre number and higher growth rates after transfer at ambient temperature. Results suggest that mRNA levels of MRF and MyHC can be used to optimise early development. An experiment in which the temperature was changed illustrates the consequence of precise temporal expression of MRF genes in specifying muscle fibre number at critical stages during early development.
Key words: Muscle development, trout, sea bass, growth, MyoD, myogenin, myosin, MRF, rainbow trout, Oncorhynchus mykiss, sea bass, Dicentrarchus labrax.
Summary
Introduction
TEMPERATURE AND MYOGENIC FACTOR TRANSCRIPT LEVELS DURING EARLY
DEVELOPMENT DETERMINES MUSCLE GROWTH POTENTIAL IN RAINBOW
TROUT (ONCORHYNCHUS MYKISS) AND SEA BASS (DICENTRARCHUS LABRAX)
D. WILKES1, S. Q. XIE2, N. C. STICKLAND2, H. ALAMI-DURANTE3, M. KENTOURI4, A. STERIOTI5, G. KOUMOUNDOUROS5, B. FAUCONNEAU6 ANDG. GOLDSPINK1,*
1Department of Anatomy and Developmental Biology, Royal Free and University College Medical School,
University of London, Rowland Hill Street, London NW3 2PF, UK, 2Department of Veterinary Basic Sciences,
The Royal Veterinary College, University of London, Royal College Street, London NW1 0TU, UK,
3INRA-IFREMER, Station D Hydrobiologie 64310 Saint Pée Sur Nivelle, France, 4Biology Department, University
of Crete, PO Box 1470, 71110 Iraklio, Crete, Greece,5Institute of Marine Biology of Crete, PO Box 2214,
71003 Iraklio, Crete, Greece and 6INRA Fish Physiology, Campus de Beaulieu, 35042 Rennes, France *Author for correspondence (e-mail: [email protected])
and TmyoD2 (Rescan and Gauvry, 1996). TmyoD was first detected in the adaxial cells of forming somites from the mid-gastrula on either side of the elongating embryonic shield; TmyoD2 is expressed later in the posterior compartment of somites (stage 14), which have already formed. In the adult skeletal musculature, the TMyoD2 mRNA transcript is only detected in red muscle (Delalande and Rescan, 1999). The first expression of myogenin is only seen in somites formed when around 15 somites are present (Rescan et al., 1995; Rescan et al., 1999; S. Q. Xie, D. Wilkes, S. Andre, P. S. Mason, J. Bredi, G. Goldspink, B. Fauconneau and N. C. Stickland, manuscript submitted for publication).
Myosin is the most abundant protein in muscle, and in fish this is the most abundant tissue. As well as encoding proteins that have a structural function, the myosin heavy chain (MyHC) genes also encode the molecular motors that generate the contractile power for movement. Therefore the MyHC genes seem to be the appropriate choice for assessing muscle gene expression in general. One problem is that these are part of a multigene family, which is even larger in fish than it is in mammals. In some species different MyHC genes are expressed at warm temperatures than at cold temperatures during seasonal adaptation (Gerlach et al., 1990) and at different developmental stages (Ennion et al., 1999). With respect to development, it is possible that regulatory sequences ensure expression of the correct MyHC genes in the type of environment that exists in embryonic cells, and this involves the MRFs. The effect of temperature on muscle development in rainbow trout was investigated and it was found that with increased incubation temperature, from 5 °C to 10 °C, the observed fibre number decreased (Matscha et al., 1998). Another study (S. Q. Xie, D. Wilkes, S. Andre, P. S. Mason, J. Bredi, G. Goldspink, B. Fauconneau and N. C. Stickland, manuscript submitted for publication) indicated that low incubation temperature (4 °C) delays myogenin expression and muscle differentiation in rainbow trout embryos when compared with a higher temperature (12 °C). This study indicated a greater distribution of myogenin throughout the somites in fish reared at lower incubation temperatures, and this was associated with a greater number of muscle fibres at hatching.
The aim of the present study was to examine if there is a correlation between water temperature during early larvae fish muscle development and the levels of mRNA of MyoD and myogenin genes in relation to muscle development, in two species of fish that are adapted to different environmental temperatures and are also of considerable economic importance.
Materials and methods
Animals
Rainbow trout (Oncorhynchus mykiss) were incubated at the experimental facilities of the INRA Drennec fish farm (Finistère, France). Details of the circulating water system, chemical water parameters and oxygen levels are described by
Bobe et al. (Bobe et al., 2000). After fertilisation, the eggs were divided into groups and incubated at different temperatures during development. Three groups were incubated at fixed temperatures of 4, 8 or 12 °C. In order to determine if there is a time window in development when the larvae are more sensitive to altered temperatures and regulatory factor expression, two more groups had the temperature changed at specific points during development. As in other temperature studies it was necessary to equate developmental time by using degree days. The groups in which environmental temperature was altered at different points in development included: LAW4: 12 °C, fertilisation to 72 degree days then lowered to 4 °C until 192 degree days then raised to 12 °C until yolk sac resorption; LAW8: 12 °C, fertilisation to 72 degree days then lowered to 8 °C until 192 degree days then raised to 12 °C until yolk sac resorption.
Sea bass (Dicentrarchus labrax) were incubated at the experimental aquaculture facilities of the Institute of Marine Biochemistry of Crete (Heraklion Crete, Greece). After fertilisation (G epiboly), the eggs were divided into three
groups and incubated at different fixed temperatures during development: 20.0±0.2 °C, 15.0±0.1 °C and 13.0±0.2 °C (mean ± S.D.). Stages of sea bass embryonic and yolk sac larval development were defined according to Divanach (Divanach, 1985).
Species-specific gene probes by cDNA isolation and cloning cDNA synthesis
Total RNA (1µg) extracted from either trout or sea bass white muscle by the method described by Chomczynski and Sacchi (Chomczynski and Sacchi, 1987) was resuspended in 11 µl of DEPC (diethylpyrocarbonate)-treated water, heated to 70 °C for 10 min, then quickly chilled on ice. To this was added 1µl of RNAase inhibitor (40 units, Promega), 4µl first strand buffer (GibcoBRL catalogue number Y00146), 2µl 0.1 mol l−1 DTT and 500µg (1µl) of the oligonucleotide primer RoRiT17: (5′ ATCGATGGTCGACGCATGCGGATCCAAAGCTTGA-ATTCGAGCTCTTTTTTTTTTTTTTTTT 3′) (Harvey and Darlison, 1991). The mix was incubated to bring the temperature to 42 °C for 2 min, lµl (200 units) of SuperscriptII (GibcoBRL catalogue number 18064-022) was added and the incubation was continued at 42 °C for 50 min. Heating at 70 °C for 15 min inactivated the enzyme.
Polymerase chain reaction
DNA homology, thus MyoD: (5′ CCAACTGCTCAGACGG-AATGATGGA 3′), myogenin: (5′ CTGACGTCCATCGTG-GACAGCATC 3′), fast (white) MyHC: (5′ GAGAAGAT-GTGCCGTACTCTTGAG 3′).
Inserts were confirmed by sequencing with universal vector primers (T7 and SP6) and Amersham Pharmacia Biotech T7 Sequenase Kit. Subsequent sequence identification was performed using Blast search in the EMBL database. In situ hybridisation
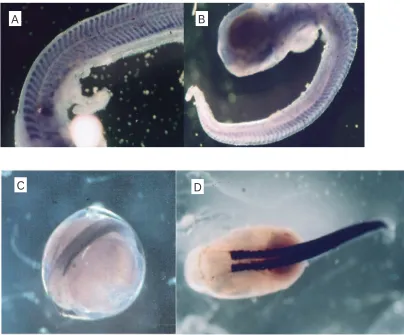
As the RNA for the northern blot was extracted from pooled samples of whole eggs or larvae, in situ hybridisation was used to determine whether the gene probes were tissue specific. The whole-mount in situ method was as described by Ennion et al. (Ennion et al., 1999) (Fig. 1).
Quantification of MRF and MyHC mRNA in larvae
The molecular biology analysis was carried out on batches of trout from embryos at hatching (yolk sacs removed) and yolk sac reabsorption, taken from each temperature regime, and 0.5 g wet mass of larvae were stored in liquid nitrogen prior to RNA extraction. Total RNA was extracted by the method of Chomczynski and Sacchi (Chomczynski and Sacchi, 1987).
After careful consideration of all genes for normalisation, it was decided that for this study normalisation by housekeeping genes was inappropriate (Suzuki et al., 2000). Electrophoresis of RNA (20µg) was performed in 1.0 % agarose gels prepared in Mops buffer (0.02 mol l−1Mops, 5 mmol l−1sodium acetate, 1 mmol l−1 EDTA, pH 7.0) with 0.66 mol l−1 formaldehyde. Following electrophoresis, RNA was transferred onto N+nylon membrane (Amersham) in 10× standard saline citrate (SSC: 10×is 1.5 mol l−1NaCl, 0.15 mol l−1sodium citrate) and fixed by baking at 80 °C for 2 h. Hybridisation and subsequent washes were carried out at 65 °C. Hybridisation was performed in Church buffer (Church and Gilbert, 1984) with the addition of sheared single-stranded calf thymus DNA at a final concentration of 0.05 mg ml−1. Trout myogenin (Rescan et al., 1995) and trout MyHC probes were radiolabelled according to the method of Feinberg and Vogelstein (Feinberg and Vogelstein, 1983).
50–100 ng of probe was made up to 34µl with dH2O and denatured by boiling for 5 min, then cooled to 37 °C. 10µl of oligo-labelling buffer (OLB), 5 U DNA PolI (Klenow fragment), 2µl BSA (10 mg ml−1) and 1.1 mBq of [α-32P]dCTP were added and incubated at 37 °C for a minimum of 3 h.
After incubation, the mixture was spun through a Sephadex
A
B
[image:3.612.107.511.368.703.2]C
D
G50 column equilibrated with TE at 700 g, to remove unincorporated nucleotides. Probes were added to a concentration of 106cts ml−1. Membranes were sequentially washed following hybridisation to remove excess probe using decreasing concentrations of SSC (2×, 1×, 0.1×) containing 0.1 % SDS for 30 min at 65 °C, or until detected radiation was 5−10 cts min−1. Membranes were then mounted and wrapped in cling film, and placed in a phosphoimaging cassette (Molecular Dynamics). The cassettes were exposed in a Storm 860 phosphoimager (Molecular Dynamics), and subsequent quantitative analysis was performed using Imagequant software (Molecular Dynamics). Normal semi-quantitative analysis by northern blotting usually involves scanning exposed autoradiograph film on a flat-bed scanner and quantifying the density of the signals on the scanned image (see Fig. 2). The phosphoimager analysis was chosen rather than conventional densitometry as the dynamic range of X-ray film is orders of magnitude less than a phosphoimaging screen. More importantly, there is no saturation effect as would be the case with densitometry using autoradiography, even if a more sensitive photographic emulsion was used. All the RNA samples from the same species and same experiment were included on the same membrane and analysed sequentially. All measurements on pooled samples were carried out in duplicate. As well as duplicate northern analyses of each RNA sample the hybridization and washing procedures were performed at the same time. It was considered important that the samples from the different temperature conditions were run simultaneously on the same gels. As the samples were pooled, the variation between individual larvae was not a problem.
Muscle fibre number and area
Fibre number and area were estimated as previously described by Alami-Durante et al., 2000 (for sea bass) and Stickland et al., 1988 (for trout).
Results
MRFs and MyHC RNA transcript levels during early development of trout
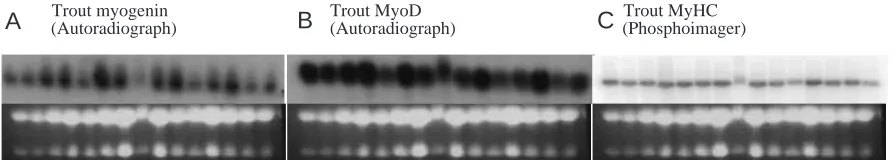
The types of northern blot using conventional autoradiography and those analysed using the phosphoimager method are shown in Fig. 2. In both cases the probe hybridisation shows as discrete bands and the intensity of the
32P signal on the phosphoimaging plates is ample for measurements using the phosphoimager for quantitation of RNA transcript levels.
MyoD expression
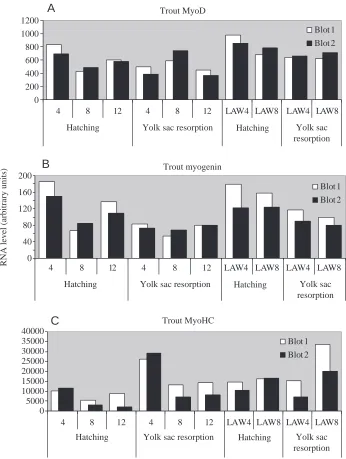
The quantified signals of MyoD expression at the different stages and at the different temperatures are shown in Fig. 3. Interestingly at hatching, trout larvae raised at 4 °C showed higher levels of MyoD RNA than those incubated at 12 °C and 8 °C. There is also a higher level of MyoD RNA at 8 °C than at 12 °C at yolk-sac absorption (Fig. 3A). As described in zebrafish (Weinberg et al., 1996) MyoD expression declined after hatching, except at 8 °C. Trout larvae in the time window experiment showed elevated levels of MyoD expression at the lower temperature as compared to the 12 °C control group (Fig. 3A). These showed that the MyoD RNA levels were considerably enhanced when the temperature was dropped to 4 °C (LAW4) or 8 °C (LAW8) after fertilization had taken place i.e. at the time the muscles were being formed.
Myogenin expression
The data obtained again showed expression levels higher in larvae incubated a 4 °C compared to 12 °C. Trout larvae that were subjected to lower temperatures during early development in the time window experiment also showed elevated levels of MyoD expression compared to the 12 °C control group (Fig. 3B). As with MyoD, myogenin mRNA levels for the 4 °C, 8 °C and 12 °C groups were seen to drop from hatching to yolk sac resorption when the muscle precursor cells are fully appear fully to enter terminal differentiation and develop into myotomes. In the time window experiment the myogenin RNA levels were enhanced when the temperature after fertilization was dropped to 4 °C (LAW4) and even 8 °C (LAW8) (Fig. 3B) compared to 12 °C.
MyHC expression
Myosin heavy chain expression (Fig. 3C) followed MyoD and myogenin expression and was apparent when muscle fibre formation commenced (Akster et al., 1995). Again larvae incubated at 4 °C show higher levels of MyHC mRNA than those incubated at 12 °C, reflecting the pattern of expression seen for MyoD and myogenin. In contrast to MyoD and myogenin the expression levels of MyHC increase continuously from hatching to yolk sac resorption. This Trout myogenin Trout MyoD Trout MyHC
(Autoradiograph) (Autoradiograph) (Phosphoimager)
[image:4.612.79.527.72.152.2]A
B
C
would be expected, as muscle formation is still proceeding during this period of growth and thereafter. In the time window experiments LAW4 and LAW8 (Fig. 3C) the enhancement in RNA levels of this structural protein were also seen.
MRFs and MyHC transcript levels during early development of sea bass
As with the trout larvae, the RNA extracted from probed samples of sea bass larvae was of good quality with no discernable degradation and northern blotting with the species-specific probes provided good hybridisation signals for quantitative phosphoimaging analysis.
MyoD expression
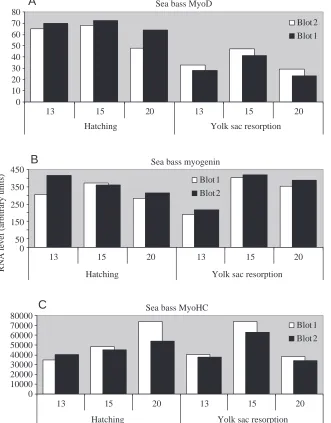
Highest levels of myoD mRNA expression (Fig. 4A) were recorded at the three-quarter embryo stage with 15 °C>13 °> 20 °C (data not shown). The levels were then seen to fall at the hatching stage and to fall further at first exogenous feeding. The optimum conditions at which there is maximum MyoD RNA appear to be at 15 °C at hatching and yolk sac resorption.
Myogenin expression
At hatching, a tendency to a higher myogenin mRNA levels was noticed in the larvae at 13 °C and 15 °C. Between hatching and the first exogenous feeding, myogenin mRNA level increased, particularly in the larvae at 15 °C (Table 3).
A
Trout MyoD4 8 12 4 8 12 LAW4 LAW8 LAW4 LAW8
Blot 1 Blot 2
B
200
160 120 80 40 0
4 8 12 4 8 12 LAW4 LAW8 LAW4 LAW8
C
0
4 8 12 4 8 12 LAW4 LAW8 LAW4 LAW8
Hatching Yolk sac resorption Hatching Yolk sac resorption
Blot 1 Blot 2
Hatching Yolk sac resorption Hatching Yolk sac resorption
Blot 1 Blot 2
Hatching Yolk sac resorption Hatching Yolk sac resorption Trout myogenin
Trout MyoHC 40000
35000 30000 25000 20000 15000 10000 5000 1200 1000 800 600 400 200 0
RN
A
l
ev
el
(
ar
b
itr
ary
u
ni
ts
[image:5.612.130.476.72.531.2])
MyHC expression
At hatching MyHC RNA expression levels were 15 °C>20 °C>13 °C (Table 3). There was then a marked increase in expression levels after hatching in the larvae at 15 °C but in comparison the larvae at 13 °C and 20 °C showed reduced levels.
Discussion
One of the main findings in this study is that the RNA concentrations for developmental factors such as MyoD and myogenin were highest at the lower temperature of the ranges used for the trout (Table 1 and Table 2) and for the sea bass (Table 3). This relates well to the morphological aspects of development in which there is a tendency for the number of muscle fibres and nuclei as well as the size attained when the
fish first reached the juvenile stage to be increased when early development was at the lower temperatures.
Different species of fish have evolved to reproduce and flourish at different environmental temperatures. The rainbow trout is a member of the salmonid family, which lay their eggs in cold mountain streams at temperatures about 4 °C to 8 °C, where larval development proceeds until the fish become large enough to migrate downstream. In contrast, the European sea bass lays its eggs in water at about 15 °C. In natural conditions, sexual maturation extends from September to March in the Mediterranean with a temperature range of 11–15 °C (Barnabe, 1976; Mananos et al., 1977; Mendez et al., 1995). In the laboratory or hatchery, embryonic development can occur at a wider range of temperatures, i.e. 8–20 °C (Marangos et al., 1986; Jennings and Pawson, 1992). The data obtained indicate that the levels
A
13 15 20 13 15 20
B
13 15 20 13 15 20
C
13 15 20 13 15 20
Blot 2 Blot 1
RNA
l
eve
l
(arbi
trary
uni
ts)
Hatching Yolk sac resorption
Hatching Yolk sac resorption
Hatching Yolk sac resorption
Blot 1 Blot 2
Blot 1 Blot 2 80
70 60 50 40 30 20 10 0
450 350 250 150 50 0
80000 70000 60000 50000 40000 30000 20000 10000 0
Sea bass MyoD
Sea bass myogenin
[image:6.612.135.466.79.502.2]Sea bass MyoHC
of regulatory factor transcripts e.g. MRF and structural gene mRNA e.g. MyHC, are the most abundant at these respective temperatures for the strains of trout and sea bass studied. This may suggest that, if the temperature is elevated, the rate of RNA degradation may exceed the rate of gene transcription, leading to decreased concentrations of regulatory and structural proteins. During the course of evolution it seems that the optimisation of development for individual species has therefore been adjusted in the thermal stability of the RNA as well as the cellular processes involved in protein synthesis. It should be mentioned that a precursory investigation of a commercial strain of trout (LA) did not show such a low optimum temperature and it is likely that
sea bass from the Atlantic will have a lower optimum than those from the Mediterranean.
[image:7.612.60.569.98.293.2]These data on MRF and structural gene expression can be related to morphological parameters of larval development of the same strain of trout and sea bass studied. Details of the morphological differences plus the methods used will be published elsewhere, but the major differences are highlighted here so the influence of the enviromental temperature on mRNA concentrations of the myogenic factors can be seen (Table 1, Table 2, Table 3). At hatching the total cross-sectional area of an apaxial quadrant of white muscle of the larvae reared at 20 °C was higher than those of 13 °C and 15 °C. At the stage of flexion the reverse is true, with a smaller total
Table 1. Comparison of molecular biology with morphological parameters in rainbow trout raised at different temperatures during early development
Rearing conditions (°C)
Parameter Larval stage 4 8 12
MyoD mRNA levels* Hatching 761 (98) 457 (38) 585 (14)
Yolk sac resorption 442 (82) 665 (105) 404 (57)
Myogenin mRNA levels* Hatching 167.5 (26) 75 (12) 122.5 (19)
Yolk sac resorption 78 (7) 61 (10) 80 (0)
MyHC mRNA levels* Hatching 10871 (864) 4169 (1564) 5303 (4733)
Yolk sac resorption 27749 (2182) 10068 (4246) 11174 (4486)
Total white muscle fibre number Hatching 1950 (80) 1900 (50) 1625 (50)
in one lateral half of fish‡ Yolk sac resorption 3000 (100) 2800 (100) 2350 (100)
Total white muscle nuclei in Hatching 980 (25) 790 (25) 525 (25)
lateral half of fish‡ Yolk sac resorption 2300 (100) 2350 (100) 2150 (100)
Mass at juvenile stage (mg) 1120 (80) 870 (120) 810 (200)
The RNA levels are in arbitrary phosphoimager units.
*Values are means ±S.D.; ‡values are means (S.E.M.). N is given in parentheses for each condition.
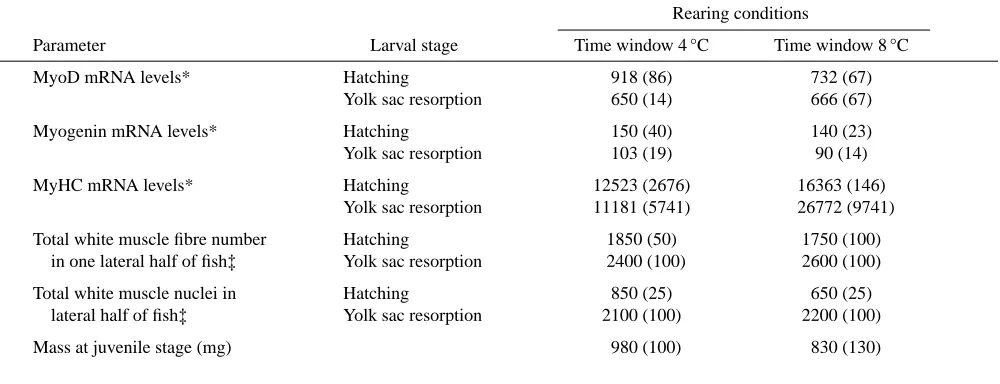
Table 2. Comparison of molecular biology with morphological parameters in rainbow trout subjected to temperature changes during early development
Rearing conditions
Parameter Larval stage Time window 4 °C Time window 8 °C
MyoD mRNA levels* Hatching 918 (86) 732 (67)
Yolk sac resorption 650 (14) 666 (67)
Myogenin mRNA levels* Hatching 150 (40) 140 (23)
Yolk sac resorption 103 (19) 90 (14)
MyHC mRNA levels* Hatching 12523 (2676) 16363 (146)
Yolk sac resorption 11181 (5741) 26772 (9741)
Total white muscle fibre number Hatching 1850 (50) 1750 (100)
in one lateral half of fish‡ Yolk sac resorption 2400 (100) 2600 (100)
Total white muscle nuclei in Hatching 850 (25) 650 (25)
lateral half of fish‡ Yolk sac resorption 2100 (100) 2200 (100)
Mass at juvenile stage (mg) 980 (100) 830 (130)
The RNA levels are in arbitrary phosphoimager units.
[image:7.612.69.569.355.547.2]white muscle cross-sectional area at a higher rearing temperature. In addition the post-larval growth, as indicated by the body mass for the trout, are given to show the marked change in growth potential of fish raised at 4 °C compared to eggs and larvae raised at higher environmental temperatures.
These data have considerable economic significance, as there has been a tendency in the aquaculture industry to raise trout and sea bass eggs and larvae at elevated temperatures to speed up development. Although it may be faster it is apparently less complete, as this results in lower levels of MRF transcripts and these are associated with a reduced fibre number and a diminished growth potential. In the case of sea bass, fish raised at 20 °C had 25 % less body mass at the end of the production period than those raised initially at 15 °C.
The fact that MyoD expression preceded myogenin expression in both sea bass and trout suggests that there are time windows of gene expression in the formation of muscle and the determination of muscle fiber number. This is in agreement with the finding that the optimum temperatures for these two species were those at which the concentrations of these MRFs were found to be maximal, i.e. the rate of RNA degradation does not exceed that of RNA transcripts for the particular genes in question. It has been shown that proteins from fish that live at different environmental temperatures have different thermal stabilities (Johnston and Goldspink, 1975; Sidell, 1977). Thus far the thermal stabilities of MRF and MyHC RNAs have not been studied. It is likely that the thermal stability and transcription levels of RNA are both important in determining the amount of message available for translation into protein. However, the relative importance of these two factors in determining the optimum RNA concentrations for early development and hence the subsequent structural changes during larval and post-larval growth have to be investigated in
more detail. As the molecular mechanisms involved in early development seem to be particularly sensitive to temperature, adaptation of these mechanisms to a given thermal niche must have been under strong selective pressure during evolution.
This work was supported by an EC grant in the FAIR Program No: PL96–1941. We wish to acknowledge the help received from Dr Steven Ennion and Dr Pierre Rescan, and thank Dr Sadasivam Kaushik for his useful comments on the manuscript. During this period Professor Goldspink also received a grant from NERC to study fish myosins.
References
Akster, H. A. and Koumans, J. T. M. (1995). Myogenic calls in development and growth of fish. Comp. Biochem. Physiol. 110A, 3–20.
Alami-Durante, H., Bergot, P., Rouel, M. and Goldspink, G. (2000). Effects of environmental temperature on the development of the myotomal white muscle in larval carp (Cyprinus carpio L.). J. Exp. Biol. 203, 3675–3688.
Barnabe, G. (1976). Contribution a la connaissance de la biologic du loup
Dicentrarchus labrax (Poisson Serranide) de la region de Sete. These d’Etat,
Universite des Sciences et Techniques de Languedoc, Montpellier. Bobe, J., Ander, S. and Fauconneau, B. (2000). Embryonic muscle
development in rainbow trout (Oncorhynchus mykiss): a scanning electron microscopy and immunohistological study. J. Exp. Zool. 286, 379–389. Brett, J. R. (1979). Environmental factors and growth. In Fish Physiology,
vol. 8 (ed. W. S. Hoar, D. J. Randall and J. R. Brett), pp. 599–675. New York: Academic Press.
Chomczynski, P. and Sacchi, N. (1987). Single-step method of RNA isolation by acid guanidinium thiocyanate–phenol–chloroform extraction.
Anal. Biochem. 162, 156–159.
Church, G. M. and Gilbert, W. (1984). Genomic sequencing. Proc. Natl.
Acad. Sci. USA 81, 1991–1995
Delalande, J. M. and Rescan, P. Y. (1999). Differential expression of two nonallelic MyoD genes in developing and adult myotomal musclature of the trout (Oncorhynchus mykiss). Dev. Genes Evol. 209, 432–437.
[image:8.612.60.563.98.297.2]Divanach, P. (1985). Contribution de la Biologic et de I’Elevage de 6 Sparides Mediterraneens: Sparus aurata, Diplodus sargus, Diplodus vulgaris,
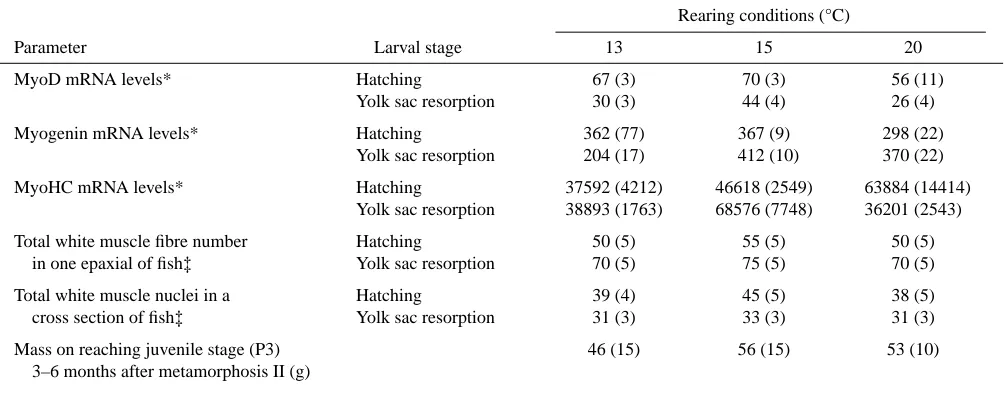
Table 3. Comparison of molecular biology with morphological parameters in Mediterranean sea bass subjected to different temperatures during early development
Rearing conditions (°C)
Parameter Larval stage 13 15 20
MyoD mRNA levels* Hatching 67 (3) 70 (3) 56 (11)
Yolk sac resorption 30 (3) 44 (4) 26 (4)
Myogenin mRNA levels* Hatching 362 (77) 367 (9) 298 (22)
Yolk sac resorption 204 (17) 412 (10) 370 (22)
MyoHC mRNA levels* Hatching 37592 (4212) 46618 (2549) 63884 (14414)
Yolk sac resorption 38893 (1763) 68576 (7748) 36201 (2543)
Total white muscle fibre number Hatching 50 (5) 55 (5) 50 (5)
in one epaxial of fish‡ Yolk sac resorption 70 (5) 75 (5) 70 (5)
Total white muscle nuclei in a Hatching 39 (4) 45 (5) 38 (5)
cross section of fish‡ Yolk sac resorption 31 (3) 33 (3) 31 (3)
Mass on reaching juvenile stage (P3) 46 (15) 56 (15) 53 (10)
3–6 months after metamorphosis II (g)
The RNA levels are in arbitrary phosphoimager units.
Diplodus annularis, Lithognathus mormyrus, Puntazzo puntazzo (Poissons
Teleosteens). These d’Etat, Universite des Sciences et Techniques de Languedoc. 479p.
Ennion, S., Wilkes, D., Gauvry, L., Alami-Durante, H. and Goldspink, G. (1999). Identification and expression analysis of two developmentally regulated myosin heavy chain gene transcripts in Carp (Cyprinus carpo). J.
Exp. Biol. 202, 1081–1090.
Feinberg, A. P. and Vogelstein, B. (1983). A technique for radiolabelling DNA restriction endonuclease fragments to high specific activity. Anal.
Biochem. 132, 6–13
Gerlach, G.-F., Turay, L., Malik, K., Lida, J., Scutt, A. and Goldspink, G. (1990). The mechanisms of seasonal temperature acclimation in the carp; a combined physiological and molecular biology approach. Am. J. Physiol. 259, R237–R244.
Harvey, R. J. and Darlison, M. G. (1991). Random-priming cDNA synthesis facilitates the isolation of multiple 5′-cDNA ends by RACE. Nucl. Acid Res. 25, 4002.
Jennings, S. and Pawson, M. G. (1992). The origin and recruitment of bass,
Dicentrarchus labrax, larvae to nursery areas. J. Mar. Biol. Ass. UK 72,
199–212.
Johnston, I. A. and Goldspink, G. (1975). Thermodynamic activation parameters of fish myofibrillar ATPase enzyme and evolutionary adaptations to temperature. Nature 257, 620–622.
Johnston, I. A. Frearson, N. and Goldspink, G. (1975). Adaptations in myofibrillar ATPase induced by temperature acclimation. FEBS Lett. 50, 293–295.
Krempler, A. and Brenig, B. (1999). Zinc finger proteins: watchdogs in muscle development. Mol. Gen. Genet. 261, 209–215.
Loughna, P. T. and Goldspink, G. (1985). Muscle protein synthesis rates during temperature acclimation in a eurythmal (Cyprinus carpio) and a stenothermal (Salmo gairdneri) species of teleost. J. Exp. Biol. 118, 267–276.
Mananos, E. L., Zanuy, S., Carrillo, M. (1997). Photoperiodic manipulations of the reproductive cycle of sea bass (Dicentrarchus labrax) and their effects on gonadal development, and plasma 17,3-estradiol and vitellogenin levels.
Fish Physiol. Biochem. 16, 211–222.
Marangos, C., Yagi, H., Ceccaldi, H. J. (1986). The role of temperature and salinity on hatching rate and morphogenesis during embryo development in
Dicentrarchus labrax (Linnaeus, 1758) (Pisces, Teleostei, Serranidae). Aquaculture 54, 287–300.
Matscha, T. W., Hopcroft, T., Mason, P. S., Crook, A. R. and Stickland, N. C. (1998). Temperature and oxygen tension influence the development of muscle cellularity in embryonic rainbow trout. J. Fish Biol. 53, 581–590.
Mendez, E., Anastasiadis, P., Kentouri, M., Pavlidis, M. and Divanach, P.
(1995). Preliminary data on spawning activity of five Mediterranean tesleost species kept in captivity, in Crete (Greece). In Proc. Fifth National Congress
on Aquaculture (ed. I. Castello, F. Orvay, I. Calderer and A. Reig), pp.
398–403. Universitat de Barcelona, Spain.
Rescan, P. Y., Gauvry, L. and Paboeuf, G. (1995). A gene with homology to myogenin is expressed in developing myotomal musculature of the rainbow trout and in vitro during the conversion of myosatellite cells to myotubes. FEBS Lett. 362, 89–92.
Rescan, P. Y. and Gauvry, L. (1996). Genome of the rainbow trout (Onchrhynchus mykiss) encodes two distinct muscle regulatory factors with homology to myoD. Comp. Biochem. Physiol. 113B, 711–715.
Rescan, P. Y., Delalande, J. M., Gauvry, L., Paboeuf, G. and Fauconneau B. (1999). Differential expression of two MyoD genes during early development of the trout: comparison with myogenin. J. Fish. Biol. 55A, 19–25.
Sabourin, L. A. and Rudnicki, M. A. (2000). The molecular regulation of myogenesis. Clin. Genet. 7, 16–25.
Sidell, B. D. (1977). Turnover of cytochrome c in skeletal muscle of green sunfish (Leopmis cyanellus, R) during thermal acclimation. J. Exp. Zool. 199, 233–250.
Stickland, N. C., White, R. N., Mescall, P. E., Crook, A. R. and Thorpe, J. E. (1988). The effect of temperature on myogenesis in embryonic development of the Atlantic Salmon (Salmo Salmar L). Anat. Embryol. 178, 253–257.
Stickland, N. C. (1983). Growth and development of muscle fibres in the rainbow trout (Salmo gairdneri). J. Anat. 137, 323–333.
Sumpter, J. P. (1992). Control of growth of rainbow trout (Oncorhynchus
mykiss). Aquaculture 100, 299–320.
Suzuki, T., Higgins, P. J., and Crawford, D. R. (2000). Control selection for RNA quantitation. Biotech. 29, 332–337.
Veggetti, A., Mascarello, F., Scapolo, P. A. and Rowlerson, A. (1990). Hyperplastic and hypertrophic growth of lateral muscle in Dicentrarchus
labrax (L.). An ultrastructural and morphometric study. Anat. Embryol. 182,
1–10.
Weatherley, A. H., Gill, H. S. and Lobo, A. F. (1988). Recruitment and maximal diameter of axial muscle fibres in teleosts and their relationship to somatic growth an ultimate size. J. Fish Biol. 33, 851–859.
Weinberg, E. S., Allende, M. L., Kelly, C. S, Abdelhamid, A., Murakami, T., Andermann. P., Doerre, O. G., Grunwald, D. J. and Riggleman, B. (1996). Developmental regulation of zebrafish MyoD in wild-type, no tail and spadetail embryos. Development 122, 271–280.