Aqueduct Syndrome
Richard T. Dahlen, H. Ric Harnsberger, Steven D. Gray, Clough Shelton, Robert Allen, James L. Parkin, and David Scalzo
PURPOSE: To evaluate a high-resolution, thin-section fast spin-echo MR imaging technique of the inner ear to identify the large vestibular aqueduct syndrome seen on temporal bone CT scans. METHODS: We retrospectively reviewed the temporal bone CT scans of 21 patients with hearing loss and enlarged bony vestibular aqueducts by CT criteria. High-resolution fast spin-echo MR imaging was then performed on these patients using dual 3-inch phased-array receiver coils fixed in a temporomandibular joint holder and centered over the temporal bones. MR imaging included axial and oblique sagittal fast spin-echo sequences. The diameter of the midvestibular aqueduct on CT scans and the signal at the level of the midaqueduct on MR images were measured on axial sequences, then compared. High-resolution MR imaging with the same protocol was performed in 44 control subjects with normal ears, and similar measurements were taken. RESULTS: The average size of the enlarged bony vestibular aqueduct on CT scans was 3.7 mm, and the average width of the signal from within the enlarged aqueduct on MR images was 3.8 mm. Statistical analysis showed excellent correlation. MR images alone displayed the enlarged extraosseous endolymphatic sac, which accompanies the enlarged aqueduct in this syndrome. Five ears in three patients with enlarged bony vestibular aqueducts on CT scans showed no evidence of an enlarged endolymphatic duct or sac on MR images. An enlarged endolymphatic sac was seen on MR images in one patient with a bony vestibular aqueduct, which had normal measurements on CT scans. MR imaging alone identified a single case of mild cochlear dysplasia (Mondini malformation). In the 88 normal ears studied, the average size of the endolymphatic sac at its midpoint between the common crus and the external aperture measured on MR images was 0.8 mm (range, 0.5 to 1.4 mm). In 25% of the normal ears, no signal was seen from within the vestibular aqueduct. CON-CLUSION: Thin-section, high-resolution fast spin-echo MR imaging of the inner ear is comple-mentary to CT in studying patients with the large vestibular aqueduct syndrome, as MR imaging better displays the soft tissues and fluid of the membranous labyrinth.
Index terms: Ear, abnormalities and anomalies; Ear, magnetic resonance
AJNR Am J Neuroradiol18:67–75, January 1997
High-resolution thin-section computed to-mography (CT) has been the mainstay of inner ear imaging because of its high spatial
resolu-tion and contrast (1–3). In the past, magnetic resonance (MR) imaging of the inner ear has had a limited role owing to problems with signal loss from local field inhomogeneities produced from the juxtaposition of dense temporal bone, otic capsule, and pneumatized air cells. Initial attempts to obtain high-resolution images of the temporal bone relied on gradient-echo tech-niques (4 –9). Gradient-echo sequences are in-herently sensitive to the magnetic susceptibility artifacts produced by the air-bone interfaces found within the temporal bone. As a result, early attempts to produce consistently diagnos-tic images of the temporal bone with MR imag-ing were variably successful, and CT has re-Received December 6, 1995; accepted after revision June 13, 1996.
Dr Dahlen was the recipient of the Head and Neck Radiologist in Training Award at the 1995 meeting of the American Society of Head and Neck Radiology in Pittsburgh, Pa.
From the Departments of Radiology (R.T.D., H.R.H., R.W.A., D.S., K.T.) and Surgery, Division of Otolaryngology-Head and Neck Surgery (S.D.G., C.S., J.L.P.), University of Utah Health Sciences Center, Salt Lake City.
Address reprint requests to H. Ric Harnsberger, MD, Department of Radiology, University of Utah Health Sciences Center, 50 N Medical Dr, Salt Lake City, UT 84132.
AJNR 18:67–75, Jan 1997 0195-6108/97/1801–0067 ©American Society of Neuroradiology
mained the technique of choice in the radiologic evaluation of congenital inner ear anomalies (10). Fast spin-echo pulse sequences are inher-ently less sensitive to magnetic susceptibility signal loss while being capable of producing high-resolution T2-weighted images (7, 8). Consequently, fast spin-echo techniques are ideally suited for temporal bone imaging. The time savings gained through the use of a greater echo train length with fast spin-echo can be translated into increased spatial resolution by increasing the matrix and/or the number of av-erages (10).
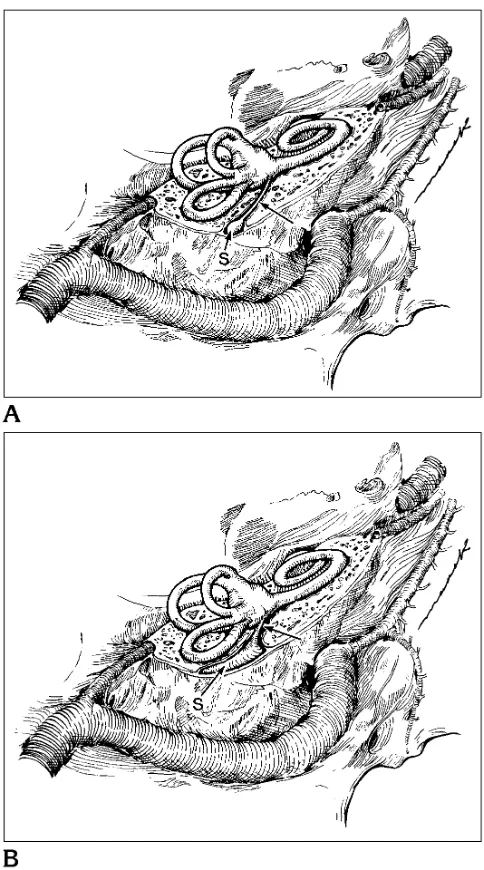
The normal endolymphatic duct originates in the anteromedial wall of the vestibule, coursing posterolaterally in the bony vestibular aqueduct to merge with the endolymphatic sac while re-maining within the bony canal. The endolym-phatic sac then emerges from the bony vestib-ular aqueduct in a shallow impression on the posterior face of the petrous temporal bone (11–14) (Fig 1A). The function of the endolym-phatic duct and sac is not well understood. En-dolymph produced in the cochlea travels from the inner ear to the endolymphatic sac. The endolymphatic sac functions as a metabolically active filter to regulate the volume and compo-sition of the endolymphatic fluid. Loss of func-tion of the endolymphatic sac or abnormalities in this region have been implicated in Meniere disease (13).
The large vestibular aqueduct syndrome is thought to be a result of arrest of the normal development of the endolymphatic duct and sac (2, 3, 15, 16). Instead of the normal inverted J shape, the duct and sac remain enlarged in their early embryological form (Fig 1B). Pa-tients with this congenital anomaly typically have some hearing at birth but progressively lose this hearing in the first years of life (1, 2, 15, 17).
Subjects and Methods
We first determined the normal diameter range for the midlevel endolymphatic sac on high-resolution MR images by measuring the width of signal at the level of the vestib-ular aqueduct in 44 healthy volunteers (88 normal inner ears) after obtaining informed consent. These subjects underwent high-resolution fast spin-echo MR imaging on a 1.5-T superconducting MR unit. A dual, 3-inch phased-array receiver coil fixed in a temporomandibular joint holder and centered over the temporal bones was used. Imaging included a coronal fast spin-echo localizer
se-Fig 1.A, The anatomy of the normal right inner ear, viewed from above and behind the temporal bone. The endolymphatic duct (arrow) courses through the proximal bony vestibular aque-duct from its internal aperture in the anteromedial wall of the vestibule to the endolymphatic sac (S) found in the bony aque-duct and within a shallow impression on the posterior face of the petrous temporal bone.
[image:2.587.312.554.82.517.2]quence followed by axial and oblique sagittal (parallel to the turns of the cochlea) sequences. Imaging parameters were 4000/90/6 (repetition time/effective echo time/exci-tations), an echo train length of 32, a 5123512 matrix, a 20310 field of view, and 2-mm-thick sections with 1-mm overlap. A triple acquisition was used to eliminate satura-tion and minimize crosstalk. The approximate imaging times were 9 minutes for the axial sequence and 7 minutes for the oblique sagittal sequence. The membranous con-tents of the vestibular aqueduct (endolymphatic duct and sac) were measured at the midportion of the canal be-tween the common crus and the external aperture using a calibrated jeweler’s eyepiece. This measurement location has been used previously for CT measurements of the bony vestibular aqueduct (2). In addition, the healthy volunteers were examined for the presence of a visible extraosseous endolymphatic sac on high-resolution MR images.
In the second phase of the study, we compared high-resolution, thin-section fast spin-echo MR images with CT scans obtained in patients with enlarged bony vestibular aqueducts. First, thin-section temporal bone CT scans of 21 patients with unilateral or bilateral hearing loss and unilateral or bilateral enlarged bony vestibular aqueducts were reviewed retrospectively. We then examined these patients with high-resolution fast spin-echo MR imaging of the temporal bones using a technique identical to that used with the volunteer subjects. All CT scans were viewed at a window setting of 4000 and a level setting of 450. Eight of the CT studies were performed with 1.5-mm axial sections and 13 with 1-mm axial sections. All MR imaging window and level settings were adjusted to maximize detail of the cochlear contents.
The diameter of the bony vestibular aqueduct was mea-sured on CT scans at its midpoint between the common crus and the external aperture using a calibrated jeweler’s eyepiece. As described by Valvassori (15, 17), a measure-ment greater than 1.5 mm was considered enlarged. This value is consistent with that used in a microdissection study of human temporal bones reported by Wilbrand et al (18), in which the normal diameter of the vestibular aque-duct ranged from 0.4 to 1.0 mm. The contents of the vestibular aqueduct were measured in an identical manner and location on the axial fast spin-echo MR images. The measurements obtained on the CT and MR studies were compared using a regression coefficient. The CT and MR examinations were also evaluated for the morphology of the vestibule, cochlea, semicircular canals, and endolym-phatic sac. The size of the endolymendolym-phatic sac was mea-sured using a calibrated jeweler’s eyepiece.
Complete audiometric data were available for 11 pa-tients. Clinical records were reviewed for the age of onset of hearing loss, progression of hearing loss, unilateral or bilateral hearing loss, and precipitating events for hearing loss. The structural abnormalities observed were com-pared with the degree and laterality of the hearing loss in those patients for whom audiometric data were available.
Results
The control group consisted of 44 healthy subjects, 26 male and 18 female, 8 to 73 years old (average age, 43 years), in whom 88 ears were examined with high-resolution, thin-sec-tion fast spin-echo MR imaging. In 22 (25%) of the 88 inner ears imaged, an endolymphatic duct or sac could not be identified, despite high-resolution images without motion artifacts. In those ears in which the sac was identified, the diameter ranged from 0.5 to 1.4 mm (average, 0.8 mm) when measured at its midportion (Fig 2). The morphology of the vestibule, cochlea, and semicircular canals was normal in all con-trol subjects. The extraosseous endolymphatic sac along the posterior aspect of the temporal bone could not be identified in any of the control subjects.
The group with large bony vestibular aque-ducts on CT scans consisted of 12 females and nine males. The average age was 17 years (range, 1 to 49 years); eight patients were older than 18 years.
On temporal bone CT scans, all patients had at least one enlarged vestibular aqueduct (.1.5 mm in diameter). Seventeen patients had bilat-eral and four patients had unilatbilat-eral enlarged bony vestibular aqueducts (38 ears total) (Figs 3 and 4). The minimum midaqueduct diameter was 1.7 mm, the maximum was 6.8 mm (aver-age, 3.7 mm).
The fast spin-echo MR images in this group with abnormal CT findings revealed a large en-dolymphatic sac (.1.5 in mm) in all but three patients (five ears). In these three patients, no enlargement of the endolymphatic system was seen on the MR images (Fig 5). Sixteen patients had bilateral and two patients had unilateral enlarged vestibular aqueducts on MR images. In one patient with bilateral hearing loss who ap-peared to have a unilateral enlarged vestibular aqueduct on CT scans, bilateral enlarged en-dolymphatic ducts and sacs were seen on MR images (Fig 6). The minimum midaqueduct di-ameter was 2.1 mm, the maximum was 7.2 mm (average, 3.8 mm) on the MR images.
images (Fig 7). Three patients had bilateral and one patient had unilateral cystic dysplasia of the vestibule on CT scans. These were all seen on the fast spin-echo MR images. Three cases of bilateral cystic dysplasia of at least one semi-circular canal were evident on CT scans. All these were seen on the fast spin-echo MR im-ages. There were no additional cases of cystic vestibule or semicircular canals on MR images that were not seen on CT scans.
Audiometric data were available for 11 pa-tients, representing 21 ears with hearing loss. The hearing loss was profound (.80 dB) in 14, severe (60 to 80 dB) in three, moderate (50 to 59 dB) in three, and mild (30 to 49 dB) in one. The hearing loss was a down-sloping predomi-nately high-frequency loss in 20 patients and a uniform loss at all frequencies in one patient. The age of onset of hearing loss was available in 13 patients. Six patients had hearing loss since birth, two patients had loss at 3 years of age,
and one patient each had loss at 2, 4, 8, 17, and 45 years of age.
The side with the largest endolymphatic sac on MR images corresponded to the side with the greatest hearing loss in eight of 10 patients in whom bilateral large vestibular aqueduct syn-drome and audiometric data were available. The remaining two patients had profound bilat-eral hearing loss. However, when the size of the endolymphatic duct or sac was compared with the degree of hearing loss, no correlation ap-peared to exist.
In two patients, the onset of hearing loss was precipitated by trauma. One 17-year-old girl had stepwise progression of hearing loss after two motor vehicle accidents. A 45-year-old woman first experienced hearing loss after a heavy object fell on her head.
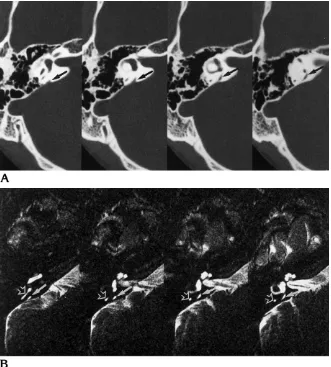
The direct axial images were the most useful for examining the endolymphatic duct and sac. The oblique sagittal images parallel to the co-Fig 2.A, Temporal bone axial CT
scans show normal vestibular aqueduct. This bony vestibular aqueduct (arrows), while prominent, is normal in size (less than 1.5 mm).
[image:4.587.216.547.84.451.2]chlear turns were helpful for determining co-chlear dysplasia.
Discussion
The radiologic description of the large vestib-ular aqueduct syndrome was defined by Valvas-sori using polytomography in 1978 (17). The large bony vestibular aqueduct was further measured and defined with the use of CT during subsequent years (1, 3). Gradient-echo MR im-aging followed, allowing the first radiologic look at both the endolymphatic duct and sac (4, 7). Susceptibility artifacts associated with gradient-echo techniques of the inner ear hampered the evolution of MR imaging in examining patients with congenital hearing loss. With the arrival of fast spin-echo pulse sequences, high-resolution MR imaging of the inner ear unaffected by sig-nificant signal loss from susceptibility artifacts became available (10). In this study, we com-pared high-resolution fast spin-echo MR imag-ing with temporal bone CT in patients with CT-proved large vestibular aqueduct syndrome in an attempt to evaluate the usefulness of MR imaging in this patient population.
With fast spin-echo MR imaging, as with any new imaging technique, determining what is normal versus abnormal is critical to radiologic interpretation. The average normal midpoint di-ameter (0.8 mm) and range (0.5 to 1.4 mm) of the transverse endolymphatic sac measured on fast spin-echo MR images in this study corre-spond well to values reported in the literature. On polytomographic studies, Becker et al (19) found a maximal normal diameter of 1.25 mm, while Kraus and Dubois (20) reported a mean diameter of 0.8 mm with a range of 0.1 to 2.0
mm measured transversely at the midpoint of the posterior limb of the vestibular aqueduct. In the majority of CT studies, investigators consid-ered a bony vestibular aqueduct enlarged if its diameter was greater than 1.5 to 2.0 mm (2, 3, 15, 21). None of our measurements in normal ears exceeded this range. Finally, in a microdis-section study of human temporal bones, Wil-Fig 3. Axial fast spin-echo MR image of bilateral enlarged
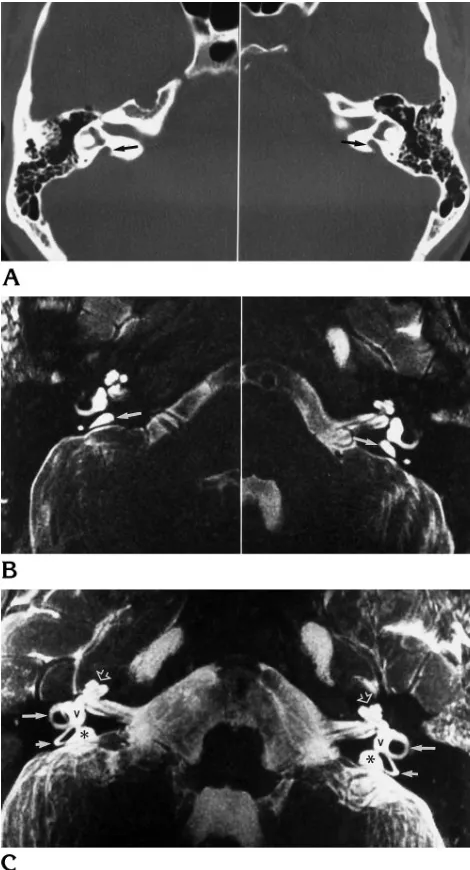
[image:5.587.309.544.84.519.2]endolymphatic ducts and sacs. In this patient, the bilateral en-dolymphatic ducts (arrows) are enlarged (.1.5 mm in diameter). Also seen are enlarged endolymphatic sacs (asterisks).
Fig 4. Bilateral enlarged endolymphatic ducts and sacs. A, The bony vestibular aqueduct (arrows) is enlarged on axial CT scans.
B, Axial fast spin-echo MR images show enlarged endolym-phatic sacs (arrows).
[image:5.587.50.289.84.216.2]brand et al (18) found a normal diameter range of 0.4 to 1.0 mm for the midpoint transverse bony vestibular aqueduct. On the basis of these comparisons, we concluded that any transverse measurement under 1.5 mm at the level of the midpoint of the vestibular aqueduct on fast spin-echo MR images is normal. Note that in 25% of our healthy subjects, the endolymphatic duct and sac could not be seen; thus, nonvis-ibility need not be pathologic.
In the group with abnormal findings, the av-erage transverse midpoint diameter of the bony vestibular aqueduct on CT scans (3.7 mm) and the similarly measured diameter of the en-dolymphatic sac on fast spin-echo MR images
(3.8 mm) were similar, with a correlation coef-ficient ofr25.96. However, when the individual values are examined, the transverse midpoint diameter on MR images was consistently mini-mally larger than that on CT scans. A pairedt
test revealed a significant difference (P 5.04). A “blooming effect” of the bright endolymph, causing a slight increase in the measurement on MR images in each case, may explain this small discrepancy. Window and level settings on MR images may also be a contributing factor.
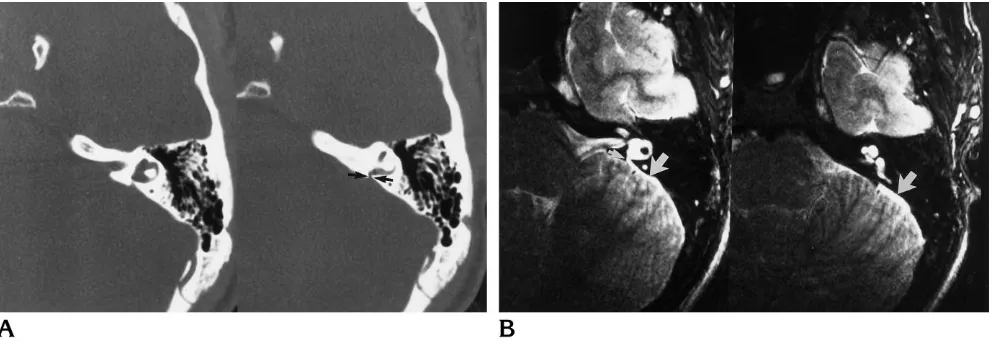
[image:6.587.54.547.84.228.2]At first glance, comparing a healthy control population with an average age of 43 years with a study group whose average age was 17 years may seem incorrect. However, Kodama and Fig 5. Enlarged bony vestibular aqueduct on temporal bone CT with normal findings at MR imaging.
A, On axial temporal bone CT scans of the right ear, the vestibular aqueduct is enlarged (arrow), measuring 2.4 mm at the transverse midpoint.
B, Axial fast spin-echo MR images show a normal-appearing endolymphatic sac (arrow), which measures 1.3 mm at its transverse midpoint.
Fig 6. Prominent vestibular aqueduct that is indeterminate on CT but enlarged at MR imaging.
A, Axial CT scans show the bony vestibular aqueduct (arrows) as slightly enlarged, but it is difficult to measure, owing to the unusual appearance of the posterior margin of the temporal bone. There is a very short distance between the vestibule and the posterior temporal bone, making it difficult to measure accurately the vestibular aqueduct, which is very short.
[image:6.587.51.548.295.469.2]Sando (14), in a study of the diameter of the bony vestibular aqueduct in human temporal bones of persons 0 to 13 years old, concluded that the bony vestibular aqueduct and the rug-ose portion of the endolymphatic sac increase slowly in size from birth until 3 years of age, at which point adult size is obtained and no further change in size is seen. Given the stability of size after the first 3 years of life, we felt justified in using our comparison population despite the age difference.
In the majority of ears with enlarged vestibu-lar aqueducts on CT scans, a corresponding enlarged endolymphatic sac was seen on MR images (34 on MR images, 38 on CT scans). Two circumstances in which the two studies did not agree were when the CT measurement sug-gested the diagnosis of large vestibular aque-duct syndrome but fast spin-echo MR images showed a normal endolymphatic sac, and when the CT measurement of the vestibular aqueduct was normal but fast spin-echo MR images showed an enlarged endolymphatic sac. Three patients (five ears) had large bony vestibular aqueducts measured on CT scans with fast spin-echo MR images that showed a normally sized endolymphatic duct and sac (Fig 5). The direct visibility with MR imaging of the fluids and soft tissues of the membranous labyrinth that were normal in these cases might suggest that the CT scan produced a false-positive finding. However, the presence of hearing loss involving
these ears and the enlarged vestibular aqueduct on CT scans would suggest a true-positive re-sult. Without a standard of reference it is difficult to ascertain which test is correct. One possibil-ity to explain the positive CT and negative MR result is prior enlargement of the endolymphatic duct and sac with associated enlargement of the bony vestibular aqueduct. If for some reason the pliable endolymphatic duct and sac returned to normal size, the bony vestibular aqueduct would remain enlarged, resulting in the positive CT finding.
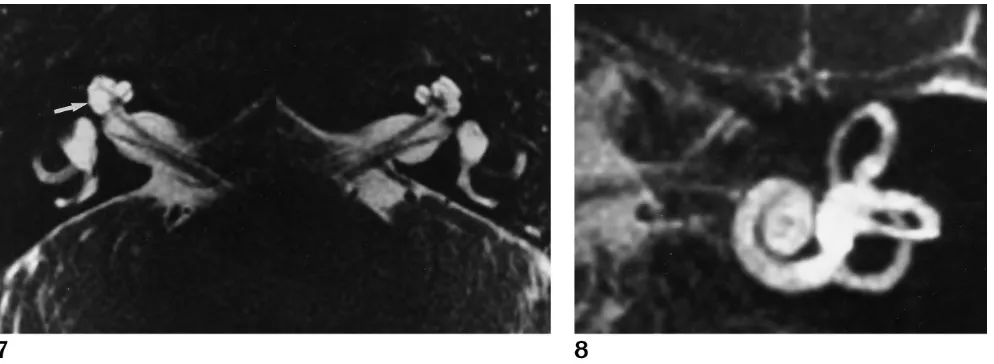
[image:7.587.52.549.83.265.2]A second advantage of fast spin-echo MR imaging is exemplified in one patient in whom CT scans showed a unilateral large bony ves-tibular aqueduct while fast spin-echo MR im-ages revealed bilateral enlarged endolymphatic ducts and sacs (Fig 6). If CT alone had been performed in this patient, this congenital anom-aly would have only been diagnosed in one ear, with the other ear considered radiologically nor-mal. Fast spin-echo MR imaging clearly defined an abnormal sac in the ear that appeared nor-mal on CT scans. In this case, the posterior wall of the vestibular aqueduct was short, so most of the sac was extraosseous. Because only the extraosseous segment was enlarged, the abnor-mality was visible with MR imaging but not with CT. Although this false-negative CT finding was seen only once in this small series, it suggests that congenital anomalies may be missed by CT alone. A second case in this study in which CT Fig 7. Subtle cochlear dysplasia is seen on this axial fast spin-echo MR
image as a small cystic region within the cochlea (arrow), which was not visible on temporal bone CT scans. The opposite, normal, side shows the normal cochlear morphology for comparison.
showed a normal cochlea but MR imaging dis-played a mild cochlear dysplasia (Fig 7) sub-stantiates the premise that fast spin-echo MR imaging is a complementary radiologic tool in this clinical setting.
Fast spin-echo MR imaging alone showed the size and extent of the endolymphatic sac in the group of patients with an enlarged vestibular aqueduct. The endolymphatic sac on T2-weighted fast spin-echo MR images appears as a focal collection of CSF-intensity fluid that communicates directly with the endolymphatic duct. CT of the temporal bone did not show the extraosseous endolymphatic sac in any of these cases because of its location outside the con-fines of the temporal bone itself. A larger field of view on CT scanning with soft-tissue windows would reveal the endolymphatic sac as an en-larged CSF space along the posterior temporal bone. However, such scans are not routinely obtained. All patients who had an enlarged in-traosseous sac on fast spin-echo MR images also had an enlarged extraosseous sac, which agrees with previous reports on this subject (1, 2, 12, 14, 22). The smallest endolymphatic sac in our series associated with a large endolym-phatic duct measured 2 3 6 mm; the largest was 9319 mm, with average sac size of 5313 mm as measured in the greatest dimension in the axial plane. Microsurgical analysis in the healthy adult shows a mean width and height of the sac to be 3.83 mm and 3.80 mm, respec-tively (23). Enlargement of the endolymphatic sac on fast spin-echo MR images in this study was bilateral in 89% of patients, compared with values reported in the literature that range from 60% to 94% (1, 2, 15, 21).
Of the 34 ears with enlarged endolymphatic sacs by fast spin-echo MR imaging, 27% had an abnormal cochlea, 31% had a cystic vestibule, and 23% had abnormal semicircular canals. Bi-lateral cochlear dysplasias were seen in four of the patients with a large endolymphatic sac. All dysplasias were of the incomplete partition type, as described by Jackler et al (16), in which the basal turn is formed normally but the apical turn is abnormal.
In summary, fast spin-echo MR imaging can directly show the fluid spaces and soft tissues of the membranous labyrinth. Temporal bone CT, on the other hand, best delineates the bony labyrinth, conveying soft-tissue information by inference only. Thin-section, high-resolution fast spin-echo MR images of the inner ear
pro-vide adequate detail of the fluid and soft-tissue contents of the aqueduct to diagnose the large vestibular aqueduct syndrome confidently. An additional advantage of this thin-section fast spin-echo MR technique is the presence of ad-equate source image data, which can be sub-jected to a postprocessing maximum intensity projection algorithm, creating a unique dimen-sional sense that may be of help in further fining congenital inner ear malformations (Fig 8).
References
1. Levenson MJ, Parisier SC, Morton J, Edelstein DR. The large vestibular aqueduct syndrome in children.Arch Otolaryngol Head Neck Surg1989;115:54 –58
2. Jackler RK, De La Cruz A. The large vestibular aqueduct syn-drome.Laryngoscope1989;99:1238 –1243
3. Urman SM, Talbot JM. Otic capsule dysplasia: clinical and CT findings.Radiographics1990;10:823– 838
4. Brogan MA, Chakeres DW, Schmalbrock P. High-resolution 3DFT MR imaging of the endolymphatic duct and soft tissues of the otic capsule.AJNR Am J Neuroradiol1991;12:1–11
5. Schmalbrock P, Brogan MA, Chakeres DW, et al. Optimization of submillimeter resolution MR imaging methods for the inner ear.J Magn Reson Imaging1993;3:451– 459
6. Casselman JW, Kuhweide R, Deimling M, et al. Constructive in-terference in steady state 3DFT MR imaging of the inner ear and cerebellopontine angle.AJNR Am J Neuroradiol1993;14:47–57 7. Casselman JW, Kuhweide R, Ampe W, et al. Pathology of the membranous labyrinth: comparison of T1- and T2-weighted and gadolinium-enhanced spin-echo and 3DFT-CISS imaging.AJNR Am J Neuroradiol1993;14:59 – 69
8. Casselman JW, Majoor MHJM, Albers FW. MR of the inner ear in patients with Cogan syndrome.AJNR Am J Neuroradiol1994;15: 131–138
9. Harnsberger HR, Dart DJ, Parkin JL, et al. Cochlear implant can-didates: assessment with CT and MR imaging.Radiology1987; 164:53–57
10. Tien RD, Felsberg GJ, Macfall J. Fast spin-echo high-resolution MR imaging of the inner ear.AJR Am J Roentgenol1992;159: 395–398
11. Schuknecht HF.Pathology of the Ear.2nd ed. Philadelphia, Pa: Lea & Febiger; 1993:61– 62
12. Ogura Y, Clemis JD. A study of the gross anatomy of the human vestibular aqueduct.Ann Otol1971;80:813– 825
13. Schuknecht HF.Pathology of the Ear.2nd ed. Philadelphia, Pa: Lea & Febiger; 1993:103–105
14. Kodama A, Sando I. Postnatal development of the vestibular aqueduct and endolymphatic sac. Ann Otol Rhinol Laryngol 1982;91(suppl 96):3–12
15. Valvassori GE. The large vestibular aqueduct and associated anomalies of the inner ear.Otolaryngol Clin North Am1983;16: 95–101
16. Jackler RK, Luxford WM, House WF. Congenital malformations of the inner ear: a classification based on embryogenesis. Laryngo-scope1987;97(part 2, suppl 40):2–14
17. Valvassori GE, Clemis JD. The large vestibular aqueduct syn-drome.Laryngoscope1978;88:723–728
aque-duct and paravestibular canal: an anatomic and radiologic inves-tigation.Acta Radiol (Diagn)1974;15:337–355
19. Becker TS, Vignaud J, Sultan A. The vestibular aqueduct in con-genital deafness: evaluation by the axial projection.Radiology 1983;149:741–744
20. Kraus EM, Dubois PJ. Tomography of the vestibular aqueduct in ear disease.Arch Otolaryngol1979;105:91–98
21. Emmett JR. The large vestibular aqueduct syndrome.Am J Otol 1985;6:387– 415
22. Gussen R. The endolymphatic sac in the Mondini disorder.Arch Otorhinolaryngol1985;242:71–76