Great Britain © The Company of Biologists Limited 1984
TRACHEAL GASES, RESPIRATORY GAS EXCHANGE,
BODY TEMPERATURE AND FLIGHT IN SOME
TROPICAL CICADAS
BY GEORGE A. BARTHOLOMEW AND M. CHRISTOPHER BARNHART
Department of Biology, University of California, Los Angeles, CA 90024, U.SA.
Accepted 9 January 1984
SUMMARY
Fidicina mannifera Fab. (mass 3 g) can fly at a body temperature of 22 °C, but take-off is usually preceded by an endothermic warm-up that elevates Tth to 28 °C or higher. Warm-up is accompanied by slow, almost impercep-tible, wing movements, gentle abdominal pumping and an increase in V02 to about 16 times the resting level. During wing-flapping in fixed flight, V02 increases explosively to about 70 times the resting level, and thoracic temperature rises to about 33 °C. Wing-beat frequency increases with Tth . Between 25 and 34 °C the mean wing-beat frequency is about 37 Hz. F. mannifera does not maintain free flight, or wing flapping in fixed flight, for more than about 100 s. Flight is supported aerobically, and we infer that exhaustion is related to depletion of substrate in the flight muscles.
The volume of the tracheal system of F. mannifera is about 45 % of total body volume. At rest, F02 in the thoracic air sacs remains near 17% and Fco2. near 3 %. During non-flapping warm-up, F02 falls to as low as 1 % and Fcc>2 rises to as high as 21 %. Thus, gas exchange may limit the rate of warm-up. When wing-flapping commences, F02 and Fco2 quickly return to near resting levels, presumably as a result of auto ventilation.
The interspecific regression of V02 on mass for three species of cicadas at 23-24°C has a slope of 0-89 and a 1-g intercept of 0-63 mlh"1.
INTRODUCTION
Fidicina mannifera, a large (~3g) cicada that occurs in the lowland tropics of central America, is able to take off and fly with a body temperature as low as 22 °C. This contrasts sharply with the situation in many beetles and most moths of similar mass, which require thoracic temperatures greater than 30 °C for flight (Heinrich,
1981).
The present study examines the oxygen consumption, body temperature, tracheal gas concentrations and flight characteristics of F. mannifera, as well as the energy metabolism of other cicadas at rest. Previously published research on the energetics and body temperatures of cicadas has been directed at the mechanism of sound
production (Josephson & Young, 1979) and aspects of behavioural thermoregulatil (Heath, Wilkin & Heath, 1972).
MATERIALS AND METHODS
Our studies were carried out during July, 1982 at the Barro Colorado Island Station of the Smithsonian Tropical Research Institute in the Republic of Panama.
Animals
Cicadas were captured at night at lights, or during the day on the trunks and branches of trees, particularly Zanthoxylum panamense on which they commonly fed. The cicadas were weighed to the nearest mg and housed individually in ventilated plastic boxes which contained moistened paper and were kept in an air-conditioned room. Physiological measurements were made within 24 h of capture. Species identif-ications were confirmed by Dr Thomas E. Moore of the Museum of Zoology, Univer-sity of Michigan, Ann Arbor where the specimens are deposited.
Temperature
Experiments were carried out at 23-0-24-5 °C either in an air-conditioned room or a refrigerated incubator in which ambient temperature (T.) could be controlled to within half a degree and which was equipped with a window, and a reach-through port.
All temperatures were measured with copper-constantan thermocouples connected to Bailey Bat thermometers. Thoracic temperature was measured with a 40 gauge thermocouple inserted dorsolaterally into the flight muscles to a depth of about 2 mm. The thermocouple was secured to the cuticle with beeswax. A shortened insect pin was inserted transversely through the heavy cuticle on the dorsal part of the caudal end of the thorax and secured with beeswax. A pipe cleaner was looped around the pin and served as a handle for positioning and lifting the cicada and for securing the thermo-couple leads (Fig. 1).
Oxygen consumption
Rates of oxygen consumption (V02) were measured with an Applied Electrochemistry S3-A Oxygen Analyzer. Measurements during fixed flapping and non-flapping warm-up were made in a flow-through system. Measurements of inactive cicadas were made in a closed system. In both systems the air was dried and the CO2 removed before it was introduced into the oxygen sensor. Rates of air flow were measured with a flow meter calibrated against a Brooks mass flow meter.
Flow-through system
Anchor pin
Thermocouple lead
Polyethylene Micropipette
Fig. 1. Experimental preparation for sampling of tracheal gas (see Methods).
was controlled at 73 cm3 min"1 by a needle valve. Tygon tubing was used throughout. The system was calibrated before each run. An AIM-6S microcomputer (Rockwell) controlled a multichannel switching and analogue-to-digital conversion system, recor-ded the outputs of the sensors and converted these voltages to temperature and to instantaneous rates of oxygen consumption.
Instantaneous V02 was calculated as described in Bartholomew, Vleck & Vleck (1981) using the wash-out curve of the system (effective volume, 1210 cm3) as a baseline, and making measurements at intervals of 20 or 60s. The system was functionally the same as the mask systems used for large vertebrates and oxygen consumption was calculated by substituting FEEQ (see Bartholomew et al. 1981) for FE02 m the following formula and correcting to STP:
VO2 = V(FIO2-FEO2)/(1-FIO2), (1) where V is the flow of dry, CC>2-free air in cm3 min"1, F102 is the fractional concentra-tion of oxygen in the incurrent air and FE02 is the concentraconcentra-tion of oxygen in the excurrent air. Under the conditions employed, the flow-through system measured instantaneous rates of oxygen consumption to within 0-05 cm3 min"1, which is about 2 % of the V02 during fixed flapping.
Closed system
air. After the cicada had remained motionless for about 10 min the syringe was a g » closed and a new period of measurement was begun. At the end of the experiment the syringe was placed in a Razel infusion pump and the air in it was delivered to the oxygen sensor through a Tygon tube containing desiccant and COz-absorbent. V02 was calculated from the formula below and converted to STP:
V02 = Vtot - (Vc + VH2o) (F102 - F EO 2) / ( 1 - FEo2)t, (2)
where t is time in minutes; F102 and FE02 are as in equation (1); Vtot is the volume of air in the syringe at the beginning of the experiment; VH20 is the volume of water vapour in that air; and Vc is the volume of the cicada excluding its tracheae and air sacs. Vc is equal to the mass of the animal divided by the density of its tissues (assumed to be 1-08gem"3).
Tracheal gases
Tracheal gases were sampled through a polyethylene tube 1 cm long (o.d. = 1 mm; i.d. = 0-5 mm) which was inserted into the dorsal air sac through a hole drilled in the cuticle. The tube was sealed to the cuticle with beeswax to ensure an airtight connec-tion. The cicada was attached, as previously described, to a pipe cleaner, one end of which was embedded in a post of plasticine clay (Fig. 1). The cicada was orientated horizontally and given a foam rubber ball to hold so that it could make normal walking movements. A mercury-filled micropipette (Scholander & Evans, 1947) was inserted into the polyethylene tube. The plunger of the pipette was depressed, filling the polyethylene tube with a column of mercury that was continuous with that in the pipette. To obtain a gas sample the plunger was slowly withdrawn, pulling all of the mercury back into the pipette and also drawing 3-5 pi of air from the air sac into the tip of the pipette. A drop of water, slightly acidified with HC1, was placed on the junction of the pipette and the tube. When the pipette was withdrawn from the tube a small quantity of the acidified water entered the tip, preventing exchange between room air and the gas sample. The sample was then stored behind mercury in a glass tube, one end of which was sealed. The pipette was reinserted into the polyethylene tube and the sampling process was repeated as desired. The concentrations of CO2 and O2 in the samples were determined as described in Scholander & Evans (1947) except that we used the reagents described by Scholander (1947). A series of 25 determina-tions of room air gave mean values of 20-88 % ± S.D. 0-09 for O2 and 0-03 % ± S.D. 009 for CO2.
Tracheal volume, air sac volume and mass of flight muscles
The flight muscles were dissected out of the thorax, blotted, and then weighed to the nearest mg.
Wing-loading
The left wings were removed and arranged on translucent paper in the spread position typical of flight, with front and hind wings interlocked. The outline of the wings was traced on opaque paper and cut out. The area of the cut-out was measured with a model LI-3000 Licor portable area meter and multiplied by two.
Wing-beat frequency
Cicadas with thermocouples implanted in the thorax were suspended above a microphone by a pipe cleaner secured to the thorax as previously described. By jiggling the cicada and directing a stream of air at it from a blower it was induced to flap its wings until exhausted while the sound of the wing beats was recorded with a tape recorder. The thoracic temperature was recorded verbally on the tape at inter-vals. Wing-beat frequency was determined from the recordings with a Kay Sonagraph.
RESULTS
Resting V02 and mass
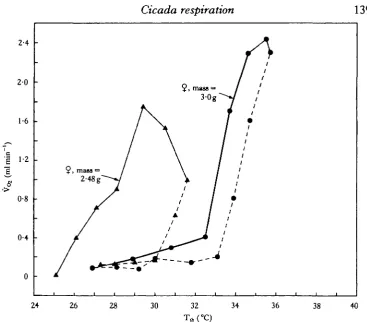
The relationship between body mass and daytime resting V02 was investigated using three species of cicadas (Carineta viridicata Distant, Zammara smaragdula Walker andFidicina mannifera) ranging in mass from 0-2 to 3 -0 g. Body temperatures did not differ from ambient (23-24-5 °C). The equation for the linear regression of log V02 (Y) on log mass (X) is Y = 0-633X0'89 (r2 = 0-89). The slope does not differ significantly from those of beetles and moths measured under similar conditions but the intercept is higher (see Discussion). Z. smaragdula andF. mannifera feed and call during daylight. Consequently, the values of V02 represent resting metabolism during a time of day when they were normally active.
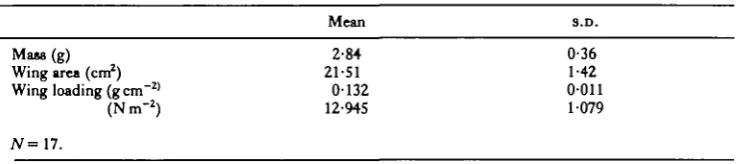
Morphometrics
[image:5.451.43.413.564.646.2]F. mannifera is the largest of the cicadas on Barro Colorado Island. The males and females do not differ in mass, wing area or wing-loading (Table 1). Wing-loading increases with body mass inF. mannifera (Y = 0-104+0-056X; ri = 0-77). A similar relationship exists interspecifically (Fig. 2).
Table 1. Wing-loading in Fidicina mannifera
Mean 3.D. 0-36 1-42 0011 1079 17.
Mass(g) Wing area (cm2) Wing loading (gcm~2>
(Nn-T2)
4 0
Fig. 2. Wing-loading as a function of body mass in Fidiana manmfera (open circles) and Zammara
smaragdula (shaded circles). Dashed lines enclose the 95 % confidence interval of the regression. To
convert gem"2 to N m "! multiply by 98-07.
Table 2. Volume of tracheal system and mass of flight muscles in male and female Fidicina mannifera
Male Female
Mass(g) Flight muscle (g) Abdominal air sac (ml) Tracheal volume excluding
abdominal air sac (ml) Total volume of tracheal
system (ml)
Mean
2-68 0-93 1-08
1-25
1-84
S.D. 0-49
on
0-28
on
0-20
P is from Student's t =test comparing males and females.
Mean
2-65 0-95 112
0-75
2-37
S.D. 0 1 5 0 0 9 0-21
0-22
0-26
P
> 0 1 >0-05 >0-05
<0-01
<001
V02 and To, during non-flapping warm-up
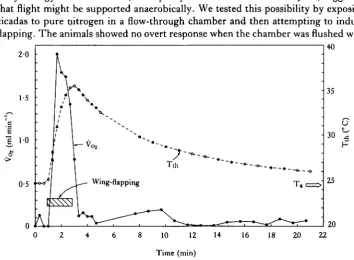
All of the.F. mannifera we observed in the field, and at 22—24-5 °C in the laboratory, were capable of immediate flight when startled. However, in the laboratory, spon-taneous take-offs (those in which the insect was not startled into immediate flight) were always preceded by non-flapping warm-up, which was accompanied by barely visible wing movements of low frequency (1—2 s"1). It was usually possible to induce warm-up in the restrained cicadas by brief, gentle prodding. Non-flapping warm-up was sometimes, but not always, followed by an attempt to fly. Mean Tth immediately before spontaneous take-off was 29-3 °C (S.D., 2-5; range, 25-4-33-0; iV = 12). Some individuals that did not attempt to fly after warm-up maintained elevated Tth for 20min or longer (Fig. 3).
40 35 2-0 I S
„
0-5 0 • •To, ~ - « . ^
'*<* T . ^ > ;
30 u
• 5
20
10 IS
Time (min)
20 25 30 35
Fig. 3. Thoracic temperature (Ty,) and V02 during non-flapping warm-up in a specimen oiFidiana
mannifera; male, 2-76g. T , , ambient temperature.
Table 3. Peak V02, peak To, and total V02 during bouts of non-flapping warm-up (N = 6) and during bouts of fixed flapping to exhaustion (N = 11) in Fidicina mannifera
Mean mass (g) Duration (s) Peak Tu, (°C) Peak V02 (mlmin"') Total Vo, tml)t
Fixed flapping A Mean 2-838 79 32-7 1-837 2-52 S.D. 0-451 10-9 1-98 0-373 0-584 Mean 2-628 737* 30-4 0-470 3-238 Warm-up A S.D. 0-067 368-2 3-57 0-068 2-144
• Period during which V02 exceeded the resting level.
t Total oxygen consumed during and subsequent to the period of flapping or warm-up until V02 returned to the resting level.
138
G. A. BARTHOLOMEW AND M. C. BARNHARTLike the elevation in Tth, the increase in V02 during non-flapping warm-up wm variable. Peak values of V02 (mean of the two highest readings during each warm-up) were about 16 times the resting rate at the same ambient temperature (Table 3). '
V02 and Tth during fixed flapping
F. mannifera apparently never makes prolonged flights. The flights we observed were usually no longer than a few tens of metres from one tree to another. We were never able to force them to remain airborne in enclosed areas for more than 100s. They readily attempted to fly while restrained (see Fig. 1) but would not flap con-tinuously for more than 90s.
We measured instantaneous V02 and thoracic temperature during fixed flapping to exhaustion 11 times on five female and four male/*1, mannifera (Table 3). Both V02 and Tth rose rapidly as soon as wing-flapping began. Tth continued to increase after V02 had peaked and started to decrease. Neither reached equilibrium during the period of flapping. As soon as flapping stopped, V02 fell precipitously and T^ declined slowly and exponentially (Fig. 4).
The relationship between V02 and Tth differs during fixed flapping and post-flight cooling (Fig. 5). The factorial metabolic scope of a 2-84gF. mannifera, calculated as the mean peak V02 during flapping (Table 3) divided by the mean resting V02 (calculated from mean mass and the relation between V02 and mass), is 69.
Effect of anoxia on flapping
By analogy with vertebrates, the rapidity of exhaustion inF. mannifera, suggested that flight might be supported anaerobically. We tested this possibility by exposing cicadas to pure nitrogen in a flow-through chamber and then attempting to induce flapping. The animals showed no overt response when the chamber was flushed with
140
10 12 14 16 18 20 22
o
[image:8.451.44.399.363.623.2]•5
Fig. 4. Thoracic temperature (Tm) and Voj during tethered flapping (attempted flight) in Fidiana
139
[image:9.451.39.407.48.370.2]40
Fig. S. Relation of mass-specific V02 and Tu, during tethered flapping. Dotted lines indicate period of post-flight cooling.
nitrogen and remained completely immobile when we attempted to induce flapping. When returned to a normal atmosphere, the cicadas could flap vigorously within less than 1 min.
Minimum temperature for flight
We cooled F. mannifera in the temperature-controlled chamber while monitoring Tth with an implanted thermocouple. When the desired Tth was reached, the thermo-couple leads were cut and the cicada was tossed into the air to a height of about 2 m. Even when Tth was as low as 16 °C, the cicadas attempted to fly. Cicadas which could not maintain altitude for a distance of 4 to 5 m were judged incapable of effective flight. The cut-off temperature for effective flight was quite sharp. In 15 trials on four cicadas, no successful flights occurred when Tth was below 21 °C. When Tth was 22 °C or higher the cicadas always flew effectively.
Tracheal gases and activity
140
G. A. BARTHOLOMEW AND M. C. BARNHARTand 5%, respectively (Table 4). Immediately after wing-flapping ended, F<s decreased somewhat and Fco2 increased; both then slowly returned toward resting levels over a period of about 20min. Changes in F02 and Fcc>2 were inverse and roughly symmetrical. However, F02 changed more rapidly than Fcc>2 during the first part of warm-up and immediately after flapping (Fig. 6).
Abdominal pumping
Telescoping movement of the abdomen at 15-36 cycles min"1 was characteristic of non-flapping warm-up. This pumping also occurred intermittently during and im-mediately after flapping, but was not necessary for flight. Two unrestrained specimens flew strongly with the abdomen immobilized with wax to prevent pumping and with the abdominal spiracles sealed. Moreover, sealing either the first or third pair of thoracic spiracles in addition to sealing the abdominal spiracles did not prevent flight. When only the second pair of thoracic spiracles was left open, the cicadas could only flap weakly.
Wing-beat frequency
[image:10.451.46.411.358.639.2]Wing-beat frequency (f) was positively correlated with Tth between 25 and 34 °C (f = 19-47+058Tth ;r2 = 0-36). However, under the conditions of measurement, high
Table 4. Tracheal gas concentrations and thoracic temperatures during different types of activity in Fidicina mannifera
Motionless Walking Non-flapping warm-up Tethered napping Post-tethered flapping Mean S.D. Min—max N Mean S.D. Min—max N Mean S.D. Min—max N Mean S.D. Min-max N Mean S.D. Min—max N
Samples include both males and females.
Fractional concentration of gases (%)
COz 2-88 0-86 1-45-4-51 24 2-56 0-66 1-56-3-49 7 13-26 4-51 3-61-20-97 18 4-63 0-98 3-39-7-08 14 7-04 2-27 3-85-12-65 20 O2 1718 1-53 13-10-19-55 24 17-55 0-95 1619-1919 7 604 4-60 0-76-17-11 18 16-16 1-22 12-7-17-65 14 12-30 3-33 6-68-17-12 20
Tit *t time of
Wing-flapping
141
24 28 32 36 40 +4 0 4 8 12 16 20
Fig. 6. Changes in trachea! gas concentrations and thoracic temperature during rest, non-flapping warm-up and tethered flapping in Fidicina mannifera. The duration of non-flapping warm-up has been normalized to 10 min to synchronize the data from the six individuals whose measurements are included. The envelopes enclose the approximate range of values in relation to time.
Tth occurred only towards the end of flapping as the animals approached exhaustion. Thus, the relationship between frequency and temperature may have been partially offset by fatigue. Mean wing-beat frequency between 25 and 34 °C was 366 Hz (S.D.,
DISCUSSION
Resting Yen
The slope of the regression of log resting V02 on log mass in cicadas is similar to the slopes reported for other orders of insects. However, at a temperature of 22-24 °C the one gram intercept for cicadas (0-633 ml h"1) is substantially higher than that for either beetles (0-23 ml h"1) or heterothermic moths (0-402 ml h"1) (Bartholomew & Casey, 1977, 1978). By analogy with vertebrates, the relatively elevated V02 of the cicadas may be related to the fact that their V02 was measured during an active phase of their daily cycle, while that of the moths and many of the beetles was measured during their inactive phase.
Wing-loading
As in beetles (Bartholomew & Heinrich, 1978) and moths (Bartholomew & Casey, 1978; Casey & Joos, 1983), wing-loading in cicadas increases with increasing body mass (Fig. 2). The wing-loading for F. mannifera is higher than for sphingids but lower than for beetles of similar size. Unlike beetles and sphingids of similar size, F. mannifera is not conspicuously endothermic, need not warm up prior to flight, and cannot remain airborne for long periods.
Warm-up and tethered flapping
Pre-flight warm-up has not previously been reported in cicadas. F. mannifera can warm itself by endothermy but need not do so in order to fly, as long as its body temperature exceeds 22°C. Its ability to fly at Tth as low as 22°C, together with its diurnal habits and lowland tropical distribution means that it can usually take off without pre-flight warm-up. Nevertheless, in the laboratory F. mannifera always warmed up prior to spontaneous take-off. The dependence of wing-beat frequency on body temperature in F. mannifera is slight, but it is within the range reported for insects of other orders (May, 1981). A warm-up from 22 to 30 °C would increase wing-beat frequency by about 15 %, which might be selectively advantageous if it resulted in increased flight speed or manoeuvrability. However, the functional significance of endogenous warm-up in F. mannifera remains problematic.
The peak V02 during warm-up in a 2-63 g F . mannifera (Table 3) is only 11-6% that of a sphinx moth of similar mass (Bartholomewet al. 1981). This difference may be related to relatively limited autoventilatory gas exchange during warm-up in cicadas (see below). Warm-up in cicadas is not accompanied by substantial wing movements, whereas sphinx moths vibrate the wings and thorax vigorously and at high frequency during warm-up and presumably are strongly autoventilated.
Cicadas exhaust quickly during flight, probably due to depletion of muscle stores of substrate for oxidative metabolism in the flight muscles. Exhaustion is evidently not due to any insufficiency in the rate of oxygen delivery. During flapping, F02 in the thoracic air sacs is high and relatively uniform (Table 4, Fig. 6). Post-flapping oxygen debt (Figs 4, 5) is negligible in comparison with post-flight oxygen debt in sphingid and saturniid moths (Bartholomew et al. 1981).
^ are small and that the rate of delivery of substrate to the muscles is low, relative to the rate of utilization during flight. In contrast, cicadas do not become exhausted during warm-up, although the total volume of oxygen consumed during a bout of warm-up exceeds that during a bout of flapping (Table 3). Warm-up is metabolically less intense, but more prolonged, than flapping. After warm-up the animals were capable of flights of normal duration. Thus, substrate was not depleted during warm-up and must have been delivered at least as fast as it was being used. We did not measure the cost of free flight in cicadas. In the sphinx moth, Manduca, Vo2 during fixed flapping is less than half that during free flight (Heinrich, 1971). However, in F. mannifera, it appears unlikely that such a large difference exists between V02 during fixed flapping and free flight. The observed V02 of flapping cicadas in this study is about 70 % of that predicted for a free-flying sphingid of similar size. Moreover, the cicadas exhausted equally rapidly during fixed flapping and free flight, suggesting that V02 under the two conditions may be similar. However, measurements of V02 during free-flapping flight are needed.
Tracheal gases and autoventilation
In many large, flying insects the high demand for gas exchange during flight is met primarily by 'autoventilation' of the thorax; that is, by ventilation directly due to the thoracic movements associated with wing-flapping (Weis-Fogh, 1967). The impor-tance of autoventilation in the gas exchange of F. mannifera can be assessed by comparing the overall conductance for oxygen between the thoracic air sacs and the outside air during rest, warm-up and wing-flapping. The exchange of oxygen between the dorsal thoracic air sacs and the air outside the insect can be described as follows:
V02 = G02 X AP02, (3)
where V02 is the rate of oxygen consumption (ml min"1), and AP02 is the difference in partial pressure of oxygen between the air sacs and the outside air. G02, the overall conductance for oxygen (mlmin~1Torr~1) between the air sacs and the outside air, describes both diffusive and convective transport. For present purposes we assume that all oxygen consumption takes place in the thorax.
We have calculated G02 for F. mannifera using the resting V02, mean peak V02 during warm-up and during fixed flapping (Table 3), and the thoracic F02 (Table 4). G02 is about 0-007 ml min"1 Torr"1 in resting individuals and increases to about 0-032 ml min^Torr"1 during warm-up. During fixed flapping G02 increases by about 0-391 ml min"1 Torr"1, or about 50 times the resting value.
The moderate increase of G02 during warm-up relative to rest is presumably due to opening of the spiracles and possibly to ventilation by abdominal pumping. High Fco2 a nd low F02 in the tracheal system during warm-up presumably induce maximal opening of the spiracles so that resistance to diffusion is minimized (cf. Burkett & Schneiderman, 1974). The larger increase in G02 during wing-flapping is attributable to autoventilation. If all of the difference in G02 between warm-up and flapping is due to autoventilation, then autoventilation accounts for about 92% of gas exchange during wing-flapping. Abdominal pumping often continues during and after flapping, but it is not critical for flight.
as in insects (Bramble & Carrier, 1983; Butler & Woakes, 1980; Weis-Fogh, ^ In vertebrates, the mechanism and functional significance of this coupling have not been clearly demonstrated. However, in locusts and dragonflies, direct measurements have shown that the movements of the thorax during flapping flight ventilate the thorax at a rate sufficient to sustain flight without the support of any other ventilatory mechanism (Weis-Fogh, 1967). This also appears to be the case inF. mannifera.
The concentrations of O2 and CO2 in the thoracic air sacs of F. mannifera at rest and during fixed flapping are similar to values recorded by Weis-Fogh (1967) under similar conditions in the locust Schistocerca. For example, during tethered flapping in Schistocerca, F02 was 13-4% and Fco2 was 5*7 %. We are not aware of any previously published data on tracheal gas tensions in an insect during an episode of endothermy. The low F02 and high Fco2 m F- mannifera during warm-up indicate that, in the absence of autoventilation, gas exchange imposes a ceiling on metabolic rate. Therefore, gas exchange may limit the rate of non-flapping warm-up. The rapid restoration of F02 and Fc02 to near resting levels as soon as wing-flapping commenced, indicates that in F. mannifera autoventilation closely matches oxygen supply with demand during flight.
R E F E R E N C E S
BARTHOLOMEW, G. A. & CASEY, T . M. (1977). Body temperature and oxygen consumption during rest and activity in relation to body size in some tropical beetles. J. thermal Biol. 2, 173—176.
BARTHOLOMEW, G. A. & CASEY, T. M. (1978). Oxygen consumption of moth« during rest, pre-flight warm-up, and flight in relation to body size and wing morphology. J. exp. Biol. 76, 11—25.
BARTHOLOMEW, G. A. & HEINJUCH, B. (1978). Endothermy in African dung beetles during flight, ball making, and ball rolling. J. exp. Biol. 73, 65-83.
BARTHOLOMEW, G. A., VLECK, D. & VLECK, C. M. (1981). Instantaneous measurements of oxygen consump-tion during pre-flight warm-up and post-flight cooling in sphingid and saturniid moths. J. exp. Biol. 90, 17—32. BRAMBLE, D. M. & CARRIER, D. R. (1983). Running and breathing in mammals. Science, N.Y. 21, 251-256. BURXETT, B. N. & SCHNEIDERMAN, H. A. (1974). Roles of oxygen and carbon dioxide in the control of
spiracular function in cecropia pupae. Biol. Bull. mar. Biol. Lab., Woods Hole 147, 274-293.
BUTLER, P. J. & WOAKES, A. J. (1980). Heart rate, respiratory frequency and wing beat frequency of free flying barnacle geese Branta leucopsis.J. exp. Biol. 85, 213-226.
CASEY, T. M. SC JOOS, B. A. (1983). Morphometrics, conductance, thoracic temperature and flight energetics of noctuid and geometrid moths. Phyiiol. Zool. 56, 160-173.
HEATH, J. E., WILKIN, P. J. & HEATH, M. S. (1972). Temperature responses of the cactus dodger, Cacama
valvata (Homoptera, Cicadadac). Physiol. Zool. 45, 238—246.
HEINRJCH, B. (1971). Temperature regulation of the sphinx moth, Manduca texta. I. Flight energetics and body temperature during free and tethered flight. J'. exp. Biol. 54, 141—152.
HEINRJCH, B. (1981). Temperature regulation during locomotion in insects. In Locomotion and Energetics in
Arthropods, (eds C. F. Herreid & C. R. Fourtner), pp. 391-417. New York: Plenum Press.
JOSEPHSON, R. K. & YOUNG, D. (1979). Body temperature and singing in the bladder cicada, Cystosoma
saundersii.J. exp. Biol. 80, 69-81.
MAY, M. L. (1981). Wingstroke frequency of dragonflies (Odonata: Anisoptera) in relation of temperature and body size. J. comp. Physiol. 144, 229-240.
SCHOLANDER, P. F. (1947). Analyzer for accurate estimation of respiratory gases in one-half cubic centimeter samples. J . biol. Chem. 167, 235-250.
SCHOLANDER, P. F. & EVANS, H. J. (1947). Microanalysis of fractions of a cubic millimeter of gas. J. biol.
Chem. 169, 551-560.