THE EFFECT OF VARYING WATER pH ON THE
ACIDIFICATION OF EXPIRED WATER IN RAINBOW TROUT
BY HONG LIN AND D. J. RANDALL
Zoology Department, University of British Columbia, 6270 University Boulevard, Vancouver, BC, V6T 2A9, Canada
Accepted 19 September 1989
Summary
Acidification of expired water was studied in rainbow trout exposed to water of pH9.91, 6.80 (control) and 3.88. For the high-pH and the control exposures, the water flowing over the gills was acidified because of the dominant effect of CO2
hydration. During the low-pH treatment, the water was alkalized because of ammonium ion formation and perhaps bicarbonate dehydration. Carbon dioxide excretion was not significantly affected by the high-pH and low-pH treatments but ammonia accumulated in the plasma in both cases.
Introduction
Fish excrete molecular CO2 and NH3 into the water passing over the gills. The
excretion rates are an order of magnitude greater for CO2 than for NH3. Some
carbon dioxide is excreted as bicarbonate in exchange for chloride, and some ammonia as ammonium ion in exchange for sodium. The former represents about 10 % of the total resting carbon dioxide excretion and the latter up to 50 % of the total ammonia excretion (see review by Randall and Wright, 1989). Because molecular CO2 is the dominant excretory product in the gills, the water should be acidified because of CO2 hydration catalyzed by carbonic anhydrase in the gill
mucus and water boundary layer (Wright et al. 1986) and on the apical surface of the gill epithelium (Rahim et al. 1988). In neutral and alkaline waters most of the excreted CO2 should be converted to bicarbonate, but under acid conditions only a
small fraction should be hydrated. Thus, the extent of acidification of water as it passes over the gills should decrease with water pH. The opposite should be true for the NH3/NH4"1" reaction. Under acid conditions almost all the NH3 should be
converted to NFL;"1" but under alkaline conditions only a fraction of the excreted NH3 should form NH4+ in the gill water. The following experiments were designed
to investigate the effect of varying the pH of inspired water on the acidification of water as it passes over the gills.
150
H. L I N AND D. J. RANDALLMaterials and methods Animals and preparation
Rainbow trout (Salmo gairdneri, Richardson), weighing 324-494g, were obtained from the West Creek Trout Farm (Aldergrove, BC) and housed in outdoor fiberglass tanks supplied with flowing dechlorinated Vancouver tap water (pH6.5-6.8; temperature, 8-12°C; hardness, 12p.p.m. CaCO3). Fish were fed
with commercial trout pellets and feeding was suspended at least 2 days before experimentation.
Fish were prepared with a dorsal aortic cannula for sampling blood, an opercular cannula for sampling expired water and a van Dam mask for measure-ment of ventilation, as described by Wright et al. (1986). After the surgical procedure, fish were left to recover for 20-40 h in the van Dam apparatus (Fig. 1) supplied with a flowing aerated test solution of 40mmoll~1 NaCl and O.Smmoll"1 CaCl2 in dechlorinated tap water (9.5-11.2°C). The test solution had an ionic
Dechlorinated tap water
Air
Test solution reservoir
Cooling coil
Expired water pH meter
Inspired water pH meter
pH electrodes
/7 Dorsal aortic cannula
Peristaltic pump
Chart recorder
Concentrated salt solution
Opercular cannula
Stopped-flow apparatus
Stirring bar
[image:2.451.79.378.276.601.2]Ventilatory i outlet
strength similar to that of the buffer solution used to calibrate the pH electrodes. By using this test solution, we reduced the response time of the pH electrode, increased its stability and thus obtained more precise water pH measurements.
Experimental protocols and measurements
Fish were subjected to one of two treatments during the experimental periods, as follow. (1) NaOH was added to the reservoir to increase the pH of the test solution to 9.91±0.02 for 90min. (2) HC1 was added to the reservoir to reduce the pH of the test solution to 3.88±0.02 for 90min.
Each series consisted of a 30-min control period (Cl), two experimental periods (El, E2), 45min each, and a 30-min recovery period (C2).
The following measurements were performed in each of the control, experimen-tal and recovery periods. (1) Inspired water pH (pHin), expired water pH (pHex) and stopped-flow water pH (pHst) were measured as by Wright etal. (1986). (2) Ventilation (VG) was measured by collecting the outflow water over 1-min periods from the standpipe in the back chamber of the van Dam apparatus. (3) Total carbon dioxide contents of the inspired water (CO2,in) and expired water
(CO2jex) were measured with a Carle gas chromatograph (model III) containing a
CO2 discriminating column (porapak Q) (Boutilier etal. 1985; Lenfant and
Aucutt, 1966). (4) A blood sample (0.7 ml) was withdrawn from the dorsal aortic cannula and replaced with the same amount of heparinized saline. The whole-blood pH ( P H B ) was measured by using a Radiometer G297/G2 capillary electrode with a Radiometer PHM-71 acid-base analyzer. (5) The remaining blood sample was centrifuged and the plasma was removed. Total carbon dioxide content of the plasma (CO2;Pi) was measured by gas chromatography as described
above for water. Total ammonia content (TAmm) of the plasma was measured by
micro-modification of a commercial diagnostic kit with an ultraviolet-visible recording spectrophotometer (L-glutamic dehydrogenase/NAD method; Sigma, 1982). (6) Inspired and expired water buffering capacities were determined separately in acid, alkaline and neutral water by titrating both the inspired and the expired water under each experimental condition using either 0.1 moll"1 HC1 or 0.1 moll"1 NaOH as titrants. The water was open to the air and stirred during this procedure, resulting in small and uncontrolled changes in PQO2- However, there
was no measurable difference between inspired and expired buffer curves for the same experimental condition. The buffer curves obtained from the titration were used to calculate the increase in proton concentration in expired water.
Calculations and statistics
The rate of carbon dioxide excretion (MCO2) was calculated from the total CO2
contents of inspired and expired water and the ventilation volume per hour by application of the Fick principle, and expressed per gram of fish mass.
Free ammonia concentration in plasma [NH3] was calculated from total
Henderson-152
H . L I N AND D . J. R A N D A L LHasselbalch equation, incorporating the pKA m m value of Cameron and Heisler
(1983).
Carbon dioxide partial pressures of both plasma and water were calculated from the total CO2 content and pH, using the Henderson-Hasselbalch equation and the
pKcch a nd #c<>2 values of Boutilier et al. (1985).
The increase in proton concentration in expired water was calculated from the differences in pHex and pHin and the appropriate buffer curve, and was expressed as the proton concentration increase per hour per gram of fish mass.
Data are presented as means±standard error. To compare the relationships in the data, Student's two-tailed t-tests, one-way and two-way ANOVAs (analysis of variance) and regression analyses were used. 5 % level of rejection was taken as the statistical limit of significance.
Results
Downstream water pH
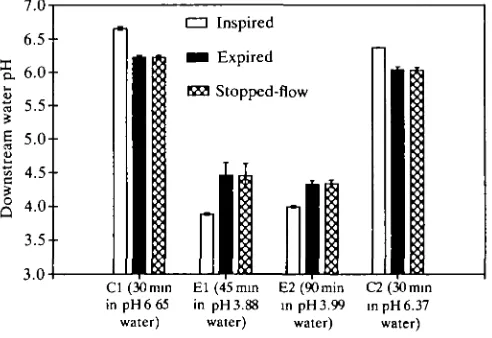
At high pH, the inspired water was acidified as it passed through the gills (Fig. 2). During periods Cl and E l , there was no significant difference between pHex and pHst. However, in E2 and C2 there were small but significant differences in pH. The calculated proton concentration increase in expired water was significantly larger for fish exposed to alkaline water (Fig. 3). There was, however, no significant difference in the proton concentration increase in expired water between periods E l and E2, or between periods Cl and C2.
During the low-pH treatment, the inspired water was alkalized rather than
10.0
9 . 5 - •
5 . 9.0-•
I 8.5-•
I 8.0-• a I 7.5-•
O i n . .
6 . 5
-6.0--
i
I I Inspired
• Expired
E 3 Stopped-flow
[image:4.451.105.352.397.561.2]Cl(3bmin El(45min E2 (90min C2 (30min in pH 6.80 inpH9.91 inpH9.60 inpH7.25 water) water) water) water)
— • — I — • — • — I — • — • — I — • — • — I — • —
a (30 mm El (45 min E2 (90 min C2 (30 mm in pH 6.80 in pH9.91 in pH9.60 in pH7.25
[image:5.451.121.333.48.214.2]water) water) water) water)
Fig. 3. Proton concentration increase in the expired water during high-pH treatment of rainbow trout expressed in janol per hour per gram of fish mass. Data were calculated using the pH values in Fig. 2 and buffer curves for water over the appropriate pH range. Significant differences were exhibited between periods El and Cl and between E2 and C2 (X±S.E.).
7.0
6.5% 6 . 0
-M 5.5 —
I 5.0"
I
4.5-Q 4
3.5-3.0
CD Inspired
• • Expired
IE] Stopped-flow
Cl (30 mm in pH6 65
water)
El (45 min in pH3.88 water)
I
E2(90min in pH3.99 water)C2(30min in pH 6.37 water)
Fig. 4. pH of inspired, expired and stopped-flow expired water of rainbow trout during low-pH treatment. Measurements were taken after the fish had been in the neutral control water for 30min, after the fish had been exposed to pH3.88 experimental water for 45 and 90 min, and 30 min after the fish had been returned to the neutral control water. pHin was significantly different from pHex in all cases but pHst was significantly different from pHex only in period E2 (X±S.E.).
[image:5.451.103.349.303.472.2]154
H. L I N AND D. J. RANDALL1.5
1.0-.If
0.5-| 0.5-| 0.0
c « 0 . 5
-c ^ 1 n l
§•5. -1.5-' o
a. -2.0
Cl (30min El (45 min E2 (90mm Cl (30min inpH6 65 inpH3.88 inpH3.99 inpH6.37
water) water) water) water)
Fig. 5. Proton concentration increase in the expired water during low-pH treatment of rainbow trout expressed in jjmcA per hour per gram of fish mass. Data were calculated using the pH values in Fig. 4 and buffer curves for water over the appropriate pH range. Significant differences were exhibited between periods El and Cl and between
E2 and C2 (X±S.E.).
8.2
X 8.1
a. -a 3 8.0
7.9
7.8
O High-pH treatment
• Low-pH treatment *•*
\ \
Cl (30mm in El (45 nun in E2 (90mm in C2 (30nun m pH 6 80/6 65 pH 9 91/3.88 pH 9.60/3.99 pH 7.25/6.37
water) water) water) water)
Fig. 6. Dorsal aortic blood pH of rainbow trout. Measurements were taken after the fish had been in the neutral control water for 30 min, after the fish had been exposed to pH3.88 or 9.91 experimental water for 45 and 90min, and 30min after the fish had been returned to the neutral control water. * indicates a significant difference from the control (Cl) value (X±S.E.).
Whole-blood pH
The blood of the fish was alkalized when the inspired water pH was raised to 9.91, and returned to normal during recovery. There was no significant difference in blood pH between periods E l and E2 (Fig. 6).
No significant change in blood pH was observed when the inspired water pH was dropped to 3.88 and then returned to 6.37 (Fig. 6).
Carbon dioxide excretion
Table 1. Carbon dioxide excretion during high-pH and low-pH treatments in
rainbow trout
High-pH treatment Total CO2 (mmoir1)
Plasma Inspired Expired
7co(ex-m) (mmoir1) Pco, (kPa)
Plasma Inspired Expired
VG (mimin"1)
Low-pH treatment Total CO2 (mmoir1)
Plasma Inspired Expired
7co2(ex-in) (mmoir1)
^co2 (kPa)
Plasma Inspired Expired
VG (rnlmin"1) McoJ/anolg-1!!-1) * Indicates a significant
N 6 7 7 7 6 7 7 7 7 6 6 6 6 6 6 6 6 6 Control 1 19.4±0.9 0.38±0.02 0.53±0.02 0.15±0.01 0.64±0.03 0.19±0.01 0.59±0.04 146±38 3.18±0.89 17.1±1.4 0.40±0.02 0.54±0.03 0.14±0.02 0.61±0.04 0.25±0.01 0.60±0.04 110±18 2.03±0.14
difference from the
Experiment 1 20.1±1.0 0.45±0.02* 0.60+0.02* 0.15±0.02 0.54±0.02* 0.00±0.00* 0.21±0.03* 145 ±31 2.91±0.74 16.3±1.7 0.32±0.02* 0.46+0.04* 0.14±0.03 0.60±0.06 0.62±0.04* 0.87±0.07* 128±22 2.39±0.46 Experiment 2 20.2±l.l 0.50±0.02* 0.64±0.03* 0.14±0.02 0.48±0.03* 0.00±0.00* 0.21±0.04* 117±17 2.27±0.45 16.2±1.7 0.32±0.02* 0.44±0.04* 0.12±0.03 0.59±0.06 0.61±0.04* 0.83±0.07* 122 ±15 2.05±0.44
control (Cl) value (X±S.E.).
Control 2 19.4±0.9 0.40±0.02 0.54±0.02 0.14±0.01 0.65±0.04 0.11±0.01* 0.47±0.05* 126±15 2.46±0.28 16.5±1.7 0.41±0.03 0.52±0.04 0.11±0.02 0.61±0.05 0.38±0.03* 0.66±0.08 126±22 1.85±0.35
content, but plasma Pco2 w a s reduced. Inspired and expired water total CO2 were
increased because carbon dioxide was trapped as HCO3~ in this alkaline water,
even though inspired water PCo2 w a s lower than control values (Table 1). There
was, however, no change in the difference between inspired and expired water rCo2 between or within the control and experimental periods; that is, carbon
dioxide excretion was unaffected by the elevation in water pH and TCCh. The
ventilation volume (VG) varied greatly among animals but there were no significant differences between the control and experimental groups (Table 1).
Exposure of the fish to acid conditions also produced no significant changes in plasma total CO2 content, plasma Pcch> ^G an<^ ^ C Q I (Table 1). PQO2 of the inspired acid water was raised to twice that of control water, but total CO2 content
decreased. However, there was no significant difference in TCo2(ex-in) between
fish in control and acidified water (Table 1).
Plasma ammonia
156
H. L I N AND D. J. RANDALLTable 2. Plasma ammonia levels during high-pH and low-pH treatments in
rainbow trout
High-pH treatment
Total ammonia in plasma
[NH3] in plasma
(/imoir1) N H3/ rA m m ratio
Low-pH treatment
Total ammonia in plasma (/imoir1)
[NH3] in plasma
N H3/ rA m m ratio
N
6
6
6
6
Control 1
48.9±8.2
0.81±0.15
0.017
57.3±14.9
0.86±0.24
0.015
* Indicates a significant difference from the
Experiment 1
85.0±15.4*
1.70±0.37*
0.02O
173±47.0*
2.46±0.69*
0.014
control (Cl) value
Experiment 2
81.8±17.6*
1.80±0.36*
0.022
213±49.2*
2.96±0.69*
0.014
(x±S.E.).
Control 2
54.5±11.1
0.88±0.19
0.016
95.4±15.3*
1.36±0.29*
0.014
low-pH treatments. Total ammonia content of plasma increased by 70 % in fish in pH9.91 water but returned to normal during recovery (Table 2). Non-ionic ammonia content [NH3] increased along with the [NH3]/rA m m ratio, reflecting the
elevation in blood pH (Table 2). Total ammonia content in plasma rose continu-ously during the pH3.88 treatment, increasing above the initial control value by 203.4 % in E l and 272.8 % in E2. It was still 66.4 % higher than the initial control value during recovery (Table 2). [NH3] increased with total ammonia content.
There was no change in the [NH3]/rA m m ratio as blood pH remained constant
(Table 2).
Discussion Downstream water pH
In all our experiments, the differences between pHst and pHex values were
quantitatively negligible, although in some cases they were statistically significant due to a small disequilibrium of the CO2: HCO3~ reaction, as observed by Wright et al. (1986). The similarity of pHst and pHex values indicated, however, that the
CO2 hydration/dehydration reaction was catalyzed by carbonic anhydrase at the gill surface over a wide range of environmental water pH.
In inspired water of approximately neutral pH, expired water was acidified by excreted CO2, which formed HCO3~ and protons, the reaction being catalyzed by
carbonic anhydrase (Wright et al. 1986). At the same time, protons were consumed by excreted NH3, which formed NH4+. As the CO2 excretion rate is about 10 times
greater than the ammonia excretion rate in fish (Wright and Wood, 1985), the overall result was acidification of the expired water.
to NH4"1" formation was reduced because, at this pH, less than half of the excreted NH3 will form NH4+, whereas essentially all the molecular carbon dioxide
excreted will form bicarbonate, and the remainder will form carbonate. In pH 3.88 water, in contrast, acidification caused by HCO3~ formation was negligible, for no
more than 1 % of the total excreted CO2 will be converted to HCO3~ at this pH.
Alkalization by NH4+ formation, however, will occur because almost all the excreted ammonia is converted to NFL,"1". As a result, expired water pH showed a small but significant increase.
We translated the differences of expired and inspired water pH into proton concentration increases in expired water by using the appropriate buffer curve.
The total acid equivalents added to the neutral water as it passed over the gills was in the same range as carbon dioxide excretion, indicating that acidification was largely the result of CO2 hydration. Exposure to alkaline water resulted in a
marked increase in the acid equivalents added to the water (Fig. 3) without any change in carbon dioxide excretion (Table 1). This is to be expected because of a marked increase in proton production due to carbonate formation (pK2=10). As a
result, proton production at this pH will be approximately 1.5 times CO2
excretion. Other explanations for this observed increase are an expected de-creased formation of NH4"1" at high pH, and/or a reduced HCO3~ excretion
and/or increased proton efflux. A net acid efflux across the gills is indicated by the rise in blood pH in fish exposed to alkaline conditions. If HCO3~ efflux across the
gills is reduced, CO2 excretion will be maintained by an elevated excretion of
molecular CO2 augmented by the increased PQO2 difference between water and
blood (Table 1).
The number of alkaline equivalents added to the water passing over the gills when fish were exposed to acid water (Fig. 5) was greater than the expected ammonia excretion, which is known to be reduced in acidic environments (Wright and Wood, 1985). Bicarbonate (excreted via a C1~/HCO3~ exchange process)
dehydration will also contribute to this process and may account for the unexpectedly high levels of alkaline equivalents added to the water under acid conditions.
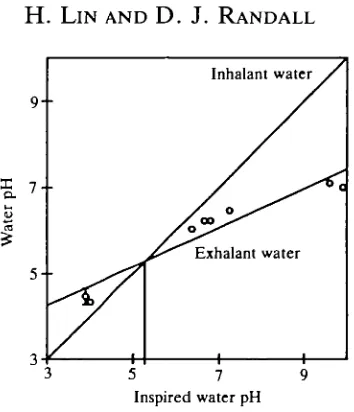
When inhalant water pH and exhalant water pH are plotted against inspired water pH (Fig. 7), the pHin/pHex regression intersects the line of identity at pH5.3. This shows that water was acidified in the neutral and alkaline environ-ments and alkalized in the acidic environment as it passed over the gills. At environmental water pH around 5.3, about one-tenth of the excreted CO2 will be
converted to HCO3~, acidifying the expired water, but almost all the excreted
NH3 (about one-tenth of the amount of excreted CO2) will be converted to N H ,+
and raise expired water pH, the overall effect being no change in water pH as it flows over the gills.
If one assumes that NH3 excretion is 10 % of CO2 excretion, that only NH3 and
CO2 (but not NH4+ and HCO3") are excreted, and that VG and excretion rates are
158
H. LIN AND D. J. RANDALLInhalant water
[image:10.451.143.320.49.255.2]
9--5 7 9 Inspired water pH
Fig. 7. The relationship between pH of exhalant water (O) and inhalant water of rainbow trout. The exhalant water line is the regression line of the mean pH values collected from both high-pH and low-pH treatments (y=0.453*+2.894, ^=0.96). The inhalant and exhalant lines cross at pH 5.3, which may be equivalent to the point where no pH change occurs when water flows over the gills.
intersect at pH5.39 (f=10°C, ionic composition of water as in methods, pK values from Boutilier et al. 1985; Cameron and Heisler, 1983). This calculated value of 5.39 is similar to the graphically derived value of 5.3, indicating that the ratio of NH3 to CO2 excretion was 0.1 and only the non-ionic forms were excreted by the
fish under these acidic conditions.
CO2 excretion
In high-pH water, a decrease in water and, therefore, plasma PCo2 w a s
expected. When the water pH was increased from 6.80 to 9.91, the CO2/HCO3~
ratio went down from about 0.2 to 0.002. As a result, there was a decrease of water Pco2 when pH was increased. This significant decrease in inspired water Pco2 was
associated with a lowered plasma Pco2- In l °w pH water, however, Pco2 was
expected to increase, for only 1 % of the total CO2 will be as HCO3~. This increase
occurred but had no impact on plasma Pco2- Arterial plasma Pco2 anc^ inspired
water Pco2 were not significantly different from each other, whereas expired water Pco2 w a s higher than arterial plasma Pco2 (but might not be higher than venous
plasma Pco^- Changes in water pH, whether acid or alkaline, had no effect on carbon dioxide excretion by the fish, although high water pH might be expected to facilitate CO2 excretion while low water pH inhibits it. It appears that C1~/HCO3~
exchange across the red blood cell membrane is the rate-limiting step in carbon dioxide excretion (Perry et al. 1982) and this will be unaffected by changes in water pH. This may also explain the absence of any effect of a rise in water Pco2 °n
plasma Pco2 m a cid water.
comparison with other published data. This might be due to the application of a van Dam mask which stressed the fish.
Ammonia
At an environmental water pH of 9.91, more than half the ammonia will be in a non-ionic state (NH3). [NH3] will be 100 times greater than that of the control
inspired water (pH6.80). This will greatly inhibit the passive diffusion of NH3 out
of the fish. In addition, Wright and Wood (1985) concluded that the N a+/ N H4+
exchange mechanism was inhibited by high environmental pH. The observed accumulation of total ammonia in plasma, therefore, was expected in fish exposed to high water pH. Blood pH increased during the high-pH treatment, which raised the blood N H3/ rA m m ratio. This facilitated the passive diffusion of ammonia and
ameliorated ammonia accumulation in fish plasma.
In water of pH 6.65 (control) the ratio NH3/NH4+ is 0.02 but when the water pH
is reduced to 3.88 the ratio is only 0.00005. The actual [NH3] difference between
water of pH3.88 and pH6.65 at constant total ammonia content, however, is very small. This small decrease in water [NH3] might be expected to reduce blood
[NH3], but blood [NH3] increased despite the reduction in water [NH3] when the
fish were exposed to acid conditions. Wright and Wood (1985), however, showed that Na+/NH4+ exchange was abolished in fish exposed to water of pH 3.88, which led to a reduction in total ammonia excretion. Ammonia concentrations in blood increased throughout the period of acid exposure.
The overall result of CO2 and NH3 excretion is to ameliorate the magnitude of
the change in water pH next to the gills in the face of changes in pH of the environmental water. Inspired water pH varied from 3.88 to 9.91 but expired pH varied only from 4.33 to 7.10. Thus, the high permeability of the gill epithelium to non-ionic but not ionic forms of carbon dioxide and ammonia maintains a relatively stable pH in the micro-environment of the fragile gill epithelium of fish.
References
BOUTILIER, R. G., IWAMA, G. K., HEMING, T. A. AND RANDALL, D. J. (1985). The apparent pK of carbonic acid in rainbow trout blood plasma between 5 and 15 °C. Respir. Physiol. 61, 237-254.
CAMERON, J. N. AND HEISLER, N. (1983). Studies of ammonia in the rainbow trout: physiochemical parameters, acid-base behaviour, and respiratory clearance. J. exp. Biol.
105, 107-125.
LENFANT, C. AND AUCUTT, C. (1966). Measurement of blood gases by gas chromatography.
Respir. Physiol. 1, 398-407.
PERRY, S. F., DAVIE, P. S., DAXBOECK, C. AND RANDALL, D. J. (1982). A comparison of CO2
excretion in a spontaneously ventilating blood-perfused trout preparation and saline-perfused gill preparation: contribution of the branchial epithelium and red blood cell. /. exp. Biol. 101, 47-60.
RAHIM, S., DELAUNOY, J. P. AND LAURENT, P. (1988). Identification and immunocytochemical localization of two different carbonic anhydrase isoenzymes in teleostean fish erythrocyte and gill epithelia. Histochemistry 89, 451-459.
160 H. LIN AND D. J. RANDALL
SIGMA, (1982). The quantitative ultraviolet determination of ammonia in plasma at 340 nm.
Sigma Technical Bulletin 170-UV. St Louis: Sigma Chemical Co.
WRIGHT, P. A., HEMING, T. A. AND RANDALL, D. J. (1986). Downstream pH changes in water flowing over the gills of rainbow trout. J. exp. Biol. 126, 499-512.
WRIGHT, P. A. AND WOOD, C. M. (1985). An analysis of branchial ammonia excretion in the freshwater rainbow trout: effects of environmental pH change and sodium uptake blockade.