Lexical Coherence Graph Modeling Using Word Embeddings
Mohsen Mesgar and Michael Strube Heidelberg Institute for Theoretical Studies gGmbH
Schloss-Wolfsbrunnenweg 35 69118 Heidelberg, Germany
(mohsen.mesgar|michael.strube)@h-its.org
Abstract
Coherence is established by semantic connec-tions between sentences of a text which can be modeled by lexical relations. In this pa-per, we introduce the lexical coherence graph (LCG), a new graph-based model to represent lexical relations among sentences. The fre-quency of subgraphs (coherence patterns) of this graph captures the connectivity style of sentence nodes in this graph. The coherence of a text is encoded by a vector of these fre-quencies. We evaluate the LCG model on the readability ranking task. The results of the ex-periments show that the LCG model obtains higher accuracy than state-of-the-art coher-ence models. Using larger subgraphs yields higher accuracy, because they capture more structural information. However, larger sub-graphs can be sparse. We adapt Kneser-Ney smoothing to smooth subgraphs’ frequencies. Smoothing improves performance.
1 Introduction
The concept of coherence is based on cohesive se-mantic relations connecting elements of a text. Co-hesive relations are expressed through grammar and the vocabulary of a language. The former is referred to as grammatical coherence, the latter as lexical coherence(Halliday and Hasan, 1976). Grammat-ical coherence encompasses coreference, substitu-tion, ellipsis, etc. Lexical coherence comprises se-mantic connections among words of a text.
In this paper we measure text coherence by mod-eling lexical coherence. Lexical relations spec-ify cohesive relations over the sentences of a text.
These lexical relations can be any kind of seman-tic relation: repetition, synonymy, hyperonymy, meronymy, etc. These lexical items may or may not have the same reference (Halliday and Hasan, 1976).
Why does the little boy wriggle all the time? Girls don’t.
In this example the lexical items boy and girls
are semantically related. Although they do not re-fer to the same entity, they still connect these two sentences.
There is coherence between any pair of lexi-cal items that stand to each other in some lexico-semantic relation (Halliday and Hasan, 1976). For textual purposes it is not required to determine the type of the relation. It is only necessary to recog-nize semantically related lexical items, and these re-lations can be learned by cooccurring lexical items.
One can use world knowledge resources to deter-mine semantic relations. This way is expensive in terms of determining the best resource, e.g. Word-Net vs. Freebase. WordWord-Net lacks broad coverage in particular with proper names, Freebase is restricted to nominal concepts and entities.
Recent improvements in embedding representa-tions of words let us efficiently compute semantic relations among lexical items in the vector space. These models use a vector of numbers to encode the meaning of words. We use these vectors to check the existence of any kind of semantic relations between two words.
In the following example the sentences are con-nected because of the semantic relation between
kingandqueenwhich can be induced by word
bedding models (Mikolov et al., 2013; Pennington et al., 2014).
. . . The king was in his counting-house, counting out his money,
The queen was in the parlour, eating bread and honey.
We model lexical coherence between sentences by a lexical coherence graph (LCG). We consider subgraphs of this graph coherence patterns and use their frequency as features representing the connec-tivity of the graph and, hence, the coherence of a text (Mesgar and Strube, 2015).
An important task for evaluating a coherence model is readability assessment. The goal of this task is to rate texts based on their readability. The more coherent a text, the faster to read and easier to understand it is. Other coherence models (Barzi-lay and Lapata, 2008; Guinaudeau and Strube, 2013; Mesgar and Strube, 2014) are also evaluated on this task. Pitler and Nenkova (2008) use the entity grid (Barzilay and Lapata, 2008) to capture the coher-ence of a text for readability assessment. Mesgar and Strube (2015) extend the entity graph (Guinaudeau and Strube, 2013) as coherence model to measure the readability of texts. They encode coherence as a vector of frequencies of subgraphs of the graph rep-resentation of a text. We build upon their method and represent the connectivity of sentences in our LCG model by a vector of frequencies of subgraphs. Although using the frequency of subgraphs of the lexical coherence graph encodes coherence features well, the subgraph frequency method, in general, is suffering from a sparsity problem when the sub-graphs get larger. Large subsub-graphs capture more structural information, but they occur only rarely. We resolve this sparsity issue by adapting Kneser-Ney smoothing (Heafield et al., 2013) to smooth subgraph counts (Section 3). We estimate the prob-ability of unseen subgraphs, i.e. coherence patterns. This prediction lets us measure the coherence of a text even when its corresponding graph representa-tion contains a subgraph which does not occur in the training data. If the unseen coherence pattern is sim-ilar to seen ones, smoothing gives it closer proba-bility to seen coherence patterns in comparison to dissimilar unseen ones. This is due to the base prob-ability factor in Kneser-Ney smoothing.
We evaluate our LCG model on the two readabil-ity datasets provided by Pitler and Nenkova (2008) and De Clercq et al. (2014), respectively (Section 4). The results (Section 5) indicate that the LCG model outperforms state-of-the-art systems. By ap-plying Kneser-Ney smoothing we solve the sparsity problem. Smoothing allows us to exploit the high informativity of large subgraphs which leads to new state-of-the-art results in readability assessment.
2 Related Work
The entity grid model (Barzilay and Lapata, 2008) is based on entity transitions over sentences. It uses a two dimensional matrix to represent transitions of entities among adjacent sentences. The entity grid is applied to readability assessment by Pitler and Nenkova (2008). The entity graph (Guinaudeau and Strube, 2013) is a graph-based, mainly unsuper-vised interpretation of the entity grid. This model represents the distribution of entities over sentences in a text with a bipartite graph. Connections be-tween sentences are obtained by information on en-tites shared by sentences. Guinaudeau and Strube (2013) perform a one-mode projection on sentence nodes and use the average out-degree of the one-mode projection graph to quantify the coherence of the given text. Mesgar and Strube (2015) rep-resent the connectivity of the one-mode projection graph by a vector whose elements are the frequen-cies of subgraphs in projection graphs. This encod-ing works much better than the entity graph for the readability task on the P&N dataset and even out-performs Pitler and Nenkova (2008) by a large mar-gin. Zhang et al. (2015) state that the entity graph model is limited, because it only captures mentions which refer to the same entity (the entity graph uses a very restricted version of coreference resolution to determine entities). Zhang et al. (2015) use world knowledge YAGO (Hoffart et al., 2013), WikiPedia
(Denoyer and Gallinari, 2006) andFreeBase (Bol-lacker et al., 2008) to capture the semantic related-ness between entities even if they do not refer to the same entity. Main issues with using world knowl-edge are: the choice knowlknowl-edge sources, selection of knowledge from the source, coverage, and language-dependence.
GloVe (Mikolov et al., 2013; Pennington et al., 2014) show that the semantic connection between words can be captured by word vectors which are obtained by applying a neural network. The ability to train on very large data sets allows the model to learn complex relationships between words.
3 Method
We introduce a new graph representation of seman-tic connections over lexical items in texts. After-wards we compute the frequency of all subgraphs, i.e. coherence patterns. The intuition is that sub-graphs capture how sentence nodes are connected and, respectively, encode text coherence.
3.1 Graph Model
We model semantic relations between sentences by a graphG=<V, E>whereV is the set of sentence nodes and E is the set of edges between sentence nodes. Two nodes ofGare adjacent if there is a se-mantic connection between the corresponding sen-tences. Two sentences are semantically connected if there is at least one strong semantic relation between the words of these sentences. We model seman-tic relations between words by their corresponding word embeddings (Pennington et al., 2014). Given word vectorsvafor wordaof sentenceAandvbfor
word b of sentence B, the cosine similarity value, cos(va, vb), between the two word vectors is a
mea-sure of semantic connectivity of the two words. The range of cos(va, vb) is between [−1,+1]. One
in-terpretation of cosine is the normalized correlation coefficient, which states how well the two words are semantically correlated (Manning and Sch¨utze, 1999). The absolute value of cosine, |cos(va, vb)|,
encodes how strongly the two words are connected. The connection between sentences is obtained from connections between their words (Figure 1). Assume sentenceAprecedes sentenceB, each word b of sentence B is connected with word a∗ of A,
where
a∗= argmax
a∈A cos(b, a)
Then from all connections between the words of sentencesA andB, the connection with the maxi-mum weight among the words of B is selected to connect these two sentences (Figure 2).
[image:3.612.342.511.60.139.2]w1 w2 w3 w4 w5
Figure 1:Sentence A with three words{w1, w2, w3}and
sen-tence B with two words{w4, w5}. w4is highly related tow2
andw5is highly related tow3.
w1 w2 w3 w4 w5
(a)
A B
(b)
Figure 2:The word relation with the maximum weight (a) rep-resents the connections between sentences (b).
The output of this phase is a graph whose edge weights model the strength of connections between sentences. The edges in this graph are directed to model the order of sentences.
Word embeddings relate each word in sentence Awith each word in sentenceB. Since the result-ing graph is very dense, we filter out edges whose weights are below a threshold1.
3.2 Coherence Features
Mesgar and Strube (2015) propose that the connec-tion style of an entity graph can be captured by the frequency of all k-node subgraphs in this graph. Larger2 subgraphs3 can capture more information
about the structure of graphs and are more informa-tive coherence patterns than smaller ones. We exper-iment withk∈ {3,4,5,6}. Text coherence is
repre-1We set this threshold to0.9to connect only sentences with
high confidence.
2The size of a subgraph is the number of its nodes. 3We compute induced subgraphs (Mesgar and Strube,
[image:3.612.339.510.212.358.2]sented by a vector whose elements are the frequency of subgraphs (coherence patterns) withk-node.
3.3 Smoothing
Although increasing the sizekof subgraphs captures more structural information about the connections of sentence nodes, a main risk with large subgraphs is sparsity. Given a sentence graph, many large subgraph types do not occur in this graph. Small subgraph types occur frequently in most sentence graphs in the dataset, but these subgraphs do not cap-ture enough information about the connectivity style of the graphs.
Inspired by Kneser-Ney smoothing in language models (Heafield et al., 2013), each feature vector of a sentence graph can be smoothed. Smoothing deals with the problem of zero counts in the feature vec-tor. It also lets the model having feature values for unseen subgraphs (like OOV in language modeling) which may be seen in the testing phase.
Kneser-Ney smoothing uses a discount factor to discount the raw count of each event (subgraph) and distributes the total discount to all event (subgraph) probabilities by means of a base probability.
The estimated frequency of subgraphsgin a given sentence graph is computed as follows:
KN(sg) = max{countZ(sg)−α,0}+MZ·αPb(sg),
whereαis the discount factor andM is the number of times that discount factor is applied. Z is a nor-malization factor to ensure that the distribution sums to one and is obtained as follows:
Z = X
sg∈A
count(sg),
whereAis the set of all subgraphs withk-nodesand functioncount(·)computes the number of instances of subgraphsgin the given sentence graph.
Pb(sg)in Kneser-Ney smoothing is the base
prob-ability of subgraphsgamong allk-nodesubgraphs (A). The base probability can be computed based on hierarchical (parent-child) relations in subgraphs. k-nodesubgraphsgiis a parent of(k+1)-node
sub-graph sgj, if sgi is a subgraph of sgj. Figure 3
shows the parent-child relation between subgraphs via a weighted tree. The root of this tree is a null
graph4. The weight of a parent-child relation
con-necting the parent subgraphsgi and child subgraph
sgj is shown bywij and computed as follows:
wij = P count(sgi, sgj) sgl∈Acount(sgi, sgl)
,
whereAis all subgraphs withk-nodeandkequals the number of nodes ofsgj. Interpretation of weight
wijis the normalized count ofsgiinsgjwith respect
to all outgoing edges fromsgi.
The base probability of each subgraphsgj is the
inner product of the Kneser-Ney probabilities of sgj’s parents by the weights of the corresponding
relations:
Pb(sgj) =P ·W, (1)
whereP is the vector of probabilities of all parents ofsgjandW is the vector of all corresponding edge
weights connecting the parents ofsgj tosgj.
Since the root node of this tree is the null sub-graph, and it is a subgraph of all possible sentence graphs, its base probability is one. Because the edge weights are in the range[0,1]the sum of the proba-bilities of all subgraphs withk-nodeis always equal to one.
Proof. AssumeI andJ are the set of all k-node and(k+1)-nodesubgraphs. We also assume that I hasnsubgraphs andPni=1p(sgi) = 1. Considering
these assumptions we prove that
m
X
j=1
p(sgj) = 1,
wheremis the number of subgraphs inJ. We start from the left and compute the value of
m
X
j=1
p(sgj).
Based on the definition of base probability, the value ofp(sgj)is computed based on its parents inI,
p(sgj) = n
X
i=1
wijp(sgi),
wherewij is the weight of the parent-child relation
betweensgiandsgj. Now we have:
Figure 3:parent child relation.
m
X
j=1
p(sgj) = m
X
j=1
n
X
i=1
wijp(sgi).
If we exchange the place of the sums and re-write the equation, we have:
m
X
j=1
p(sgj) = n
X
i=1
m
X
j=1
wijp(sgi).
In this equationp(sgi)is independent ofj(index of
the inner sum), so it can be moved out of the inner sum:
m
X
j=1
p(sgj) = n
X
i=1
p(sgi) m
X
j=1
wij
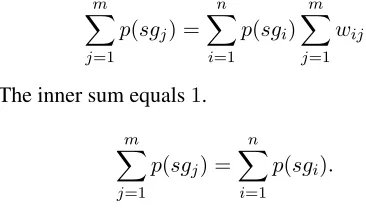
The inner sum equals1.
m
X
j=1
p(sgj) = n
X
i=1
p(sgi).
Based on our assumption the right side of the equa-tion is1and
m
X
j=1
p(sgj) = 1.
So we proved that the sum of the base probability of allk-nodesubgraphs is1.
This way, Kneser-Ney smoothing distributes the total discount value by considering the weights of parent-child relations among the subgraphs. The re-sult of applying smoothing is an estimation of the frequency of each subgraph in the sentence graph.
4 Experiments
4.1 Evaluation Task
We evaluate our coherence model on the task of ranking texts by their readability. The intuition is that more coherent texts are easier to read.
Datasets. We run our experiments on two datasets annotated with readability information provided by human annotators:P&N(Pitler and Nenkova, 2008) andDe Clercq(De Clercq et al., 2014).
The dataset P&N contains 27 articles randomly selected from the Wall Street Journal corpus5. The
average number of sentences is about10words. Ev-ery article is associated with a human score between
[0.0,5.0]indicating the readability score of that arti-cle. We create pairs of documents, if the difference between their readability scores is greater than0.5. If the first document in a pair has the higher score, we label this pair with+1, otherwise with−1. The resulting number of text pairs in this dataset is209.
The dataset De Clercq consists of 105 articles from different genres: administrative (17 articles), journalistic (43 articles), manuals (14 articles) and miscellaneous (31 articles). The average number of sentences is about12. This dataset was annotated by De Clercq et al. (2014) by asking human judges to compare two texts based on their readability. They use five labels:
5Pitler and Nenkova (2008)’s dataset contains 30 articles.
LME: left text is much easier,
LSE: left text is somewhat easier,
ED: both texts are equally difficult,
RSE: right text is somewhat easier,
RME: right text is much easier.
We map these labels to three class labels:
+1: for text pairs where the left text is easier to read (LME or LSE),
0: for text pairs where both texts are equally dif-ficult to read (ED),
−1: for text pairs where the right text is easier to read (RSE or RME).
Properties of this dataset are shown in Table 1.
Genre No. of articles No. of text pairs Administrative 17 272
Journalistic 43 1806
Manuals 14 182
[image:6.612.71.296.273.343.2]Miscellaneous 31 931
Table 1: Properties of the different genres in theDe Clercq dataset.
4.2 Experimental Settings
Word Embeddings and Classification. In order to reduce the effect of very frequent words, stop words are filtered by using the SMART English stop word list (Salton, 1971). We use a pretrained model of GloVe for word embeddings. This model is trained on Common Crawl with 840B tokens, 2.2M vocabulary. We represent each word by a vector with length 300 (Pennington et al., 2014). For handling out-of-vocabulary words, we assign a random vector to each word and memorize it for its next occurrence (Kusner et al., 2015). The classification task is done by the SVM implementation in WEKA (SMO) with the linear kernel function. All settings are set to the default values. The evaluation is computed by 10-fold cross validation.
Graph Processing and Smoothing. In order to compare the performance of LCG with the entity graph model, we follow Mesgar and Strube (2015) and use the gSpan method (Yan and Han, 2002) to compute all common subgraphs on each dataset and their frequencies. Note that gSpan does not count
all possible k-node subgraphs, whereas for apply-ing Kneser-Ney smoothapply-ing it is necessary to count all possible k-node subgraphs, because the proba-bility should be distributed among all possible sub-graphs. This also helps to estimate the probability of unseen patterns. We use a random sampling method (Shervashidze et al., 2009) to obtain the frequency of subgraphs in a sentence graph. In this regard, we take10,000samples of the given sentence graph by randomly selecting k nodes of the graph to count the occurrence of k-node subgraphs in this graph. We compute the base probability for at mostk= 6. We find the best value for d in a greedy manner. First, we initialize dwith 0.001. In each iteration we compute the performance. Then we multiply the discount factor by10. We iterate as long as the dis-count factor is less than 1000. We report the best performance.
5 Results
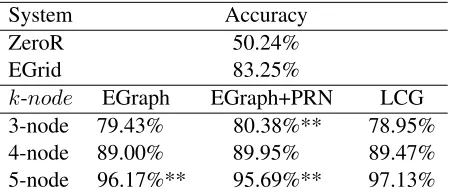
In order to compare our method with related work, we run our model on theP&N dataset. Table 2 re-ports the accuracy ofLCGwith different values fork ink-nodesubgraphs. This corresponds to coherence patterns spanning different numbers of sentences.
System Accuracy
ZeroR 50.24%
EGrid 83.25%
k-node EGraph EGraph+PRN LCG 3-node 79.43% 80.38%** 78.95% 4-node 89.00% 89.95% 89.47% 5-node 96.17%** 95.69%** 97.13%
Table 2:P&Ndataset.
[image:6.612.315.540.409.506.2]and slightly worse for 5-node subgraphs than the
EGraph. The lexical coherence graph model,LCG, performs slightly worse thanEGraphon3-node sub-graphs. This could be because the graphs in LCG
have more edges than the graphs inEGraph. When graphs are denser 3-node subgraphs occur in ev-ery graph, hence their frequency is less discrimina-tive. As shown in Table 2 larger subgraphs (4-node
and5-node) capture more information and improve uponEGraph and for5-node subgraphs even upon
EGraph+PRN.LCGsignificantly (p value= 0.01) works better thanEGraph+PRN andEGraphusing 5-node subgraphs. The difference betweenLCGand
EGraph+PRN andEGraphusing 4-node subgraphs is not significant.
Table 3 shows the performance of different mod-els on theDe Clercqdataset.
System Accuracy ZeroR 42.312% k-node EGraph+PRN LCG 3-node 42.31% 42.31% 4-node 48.07% 49.12%** 5-node 65.77% 76.27%**
Table 3:De Clercqdataset.
Again, we use a majority baseline (ZeroR) to put our results in context. While the performance of both methods almost does not beat the baseline for
3-node subgraphs, 4-node-subgraphs work already better, and5-node subgraphs yield reasonable per-formance on this dataset. Although EGraph+PRN
and LCG reach almost the same performance for
4-node, the difference between them is statistically significant (p value = 0.01). With 5-node sub-graphs,LCGoutperformsEGraph+PRN subgraphs by a large margin and gets a very reasonable perfor-mance on this dataset.
The general performance on theDe Clercqdataset is lower than the performance on the the P&N
dataset. This can have two reasons: first, the ranking task on theDe Clercqdataset is three-label classifi-cation which is more difficult than the binary clas-sification task on theP&Ndataset. Second, texts in theDe Clercqdataset are from different genres and coherence patterns may vary across genres. Hence, we take a closer look on the performance on the dif-ferent genres.
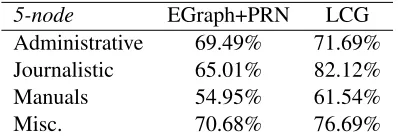
5-node EGraph+PRN LCG
Administrative 69.49% 71.69% Journalistic 65.01% 82.12% Manuals 54.95% 61.54%
[image:7.612.328.527.54.122.2]Misc. 70.68% 76.69%
Table 4:Accuracy ofEGraph+PRNandLCGon different gen-res in theDe Clercqdataset.
Table 4 shows the performance forEGraph+PRN
and LCG using 5-node subgraphs on the different genres in theDe Clercqdataset. The performance of
LCGis higher thanEGraph+PRNon all genres. Un-likeEGraph+PRN,LCGgets the best performance on journalistic articles. The lowest performance of both models is obtained on manuals. On administra-tive articles, performance ofLCG is slightly better thanEGraph+PRN. On miscellaneous articlesLCG
performs better thanEGraph+PRN.
While large subgraphs are very informative for coherence modeling, extracting large subgraphs (k > 4) in relatively small datasets leads to a data sparsity problem, as there are very many possible subgraphs to be represented in a high dimensional vector space. Hence, many possible subgraphs have low or even zero counts. The problem for such a vector is that each graph is only similar to itself and not to any other graph. Hence, we observe a drop in performance when the model deals with large sub-graphs (6-nodesubgraphs,LCG1forP&N in Table 5). We solve this problem by smoothing.
In order to apply Kneser-Ney smoothing we use a sampling method to create all possible (connected and disconnected)k-nodesubgraphs (forLCG1and
LCG1* we use connected and disconnected sub-graphs, forLCGonly connected ones).
Table 5 shows the performance ofLCG1when it is applied to ever larger subgraphs. As can be seen in Table 5, the performance on theP&Ndataset sud-denly drops for6-nodesubgraphs. This is could be caused by the sparsity problem.
When we apply Kneser-Ney smoothing as de-scribed in Section 3 the results for all tested values of kare superior forLCG1*when compared toLCG1
(Table 5).
fre-P&N De Clercq
[image:8.612.77.294.67.151.2]k-node LCG1 LCG1* LCG1 LCG1* 3-node 84.52% 89.00% 42.31% 49.60% 4-node 95.69% 96.17% 65.10% 66.23% 5-node 97.61% 98.08% 79.33% 79.85% 6-node 93.26% 95.69% 76.67% 78.03%
Table 5:Applying smoothing method yields to higher accuracy for larger subgraphs.
quency and makes the frequency distribution of sub-graphs more even. Smoothing reduces the values through all subgraphs by considering parent-child relations between subgraphs to relate similar sub-graphs. That is the advantage of the Kneser-Ney method in comparison to the other smoothing meth-ods like Laplace-Smoothing.
For the P&N dataset we achieve the best results to date. Pitler and Nenkova (2008) reported 83.25% accuracy, Mesgar and Strube (2015) 89.95%. When smoothing 5-node subgraphs we are able to report 98.08%. This, however, indicates that this dataset may not be the best one to report performance on. Hence, we now check whether smoothing also im-proves the performance on the more difficult De Clercqdataset.
On this dataset, we basically observe the same trends. Both settings result in better performance thanLCG(see Table 3).
Note that none of the parameters in this work is tuned on the datasets. One may get better perfor-mance by tuning the parameters. The results con-firm the intuition that the lexical coherence graph
LCGcaptures coherence and models lexical coher-ence appropriately.
Applying smoothing on graphs of EGraph+PRN
model increases the performance of this model. But this improvement is not as high as the improvement on theLCGgraph.
Coherence Patterns. In this part we check the Pearson correlation coefficient between LCG1 and human judgements of a few frequent subgraphs on theP&Ndataset. In order to be consistent with Mes-gar and Strube (2015), we use the exhaustive value of subgraph frequencies, i.e.LCG1for our work.
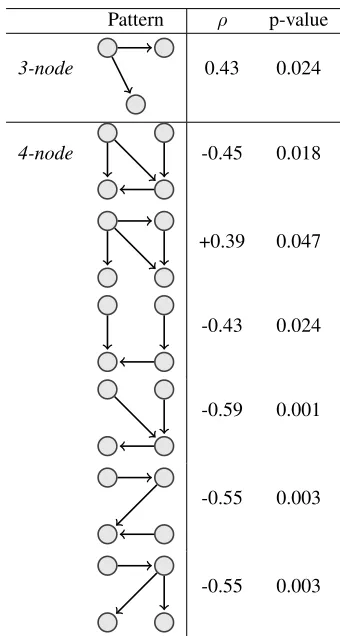
For the3-nodesubgraphs only one subgraph (Fig-ure 4) in the LCG1 representation is significantly
(and positively) correlated (p-value<0.05) with hu-man scores. For the4-node subgraphs, we find six subgraphs which are significantly correlated with readability. Only one is positively correlated, while four are negatively correlated. Interestingly, both positively correlated 3-node and4-node subgraphs have been determined as positively and significantly correlated by Mesgar and Strube (2015) as well. Both also capture a similar coherence pattern, indi-cating that our method is linguistically sound.
Pattern ρ p-value
3-node 0.43 0.024
4-node -0.45 0.018
+0.39 0.047
-0.43 0.024
-0.59 0.001
-0.55 0.003
-0.55 0.003
Figure 4:Pearson correlation between3-nodeand4-node sub-graphs and readability scores in theP&Ndataset.
6 Conclusions and Future Work
[image:8.612.340.510.197.515.2]While the entity grid works only on sequences of up to three adjacent sentences, we are able to model relationships of up to six non-adjacent sentences. We solve the sparsity problem of large subgraphs by adapting Kneser-Ney smoothing to graphs. Smooth-ing prevents LCG from losSmooth-ing performance with large subgraphs and leads to superior performance on the Pitler and Nenkova (2008) dataset and to a first reasonable state-of-the-art on the De Clercq et al. (2014) dataset.
In future work we want to apply LCG to essay scoring as well. Also, we see that our adaption of Kneser-Ney smoothing to graphs may be useful for research in subgraph mining in general.
Acknowledgments
This work has been funded by the Klaus Tschira Foundation, Heidelberg, Germany. The first author has been supported by a HITS Ph.D. scholarship. We would like to thank Orph´ee De Clercq who pro-vided theDe Clercqdataset. We also appreciate An-dreas Spitz’ comments on graph processing.
References
Regina Barzilay and Mirella Lapata. 2008. Modeling local coherence: An entity-based approach. Computa-tional Linguistics, 34(1):1–34.
Kurt Bollacker, Colin Evans, Praveen Paritosh, Tim Sturge, and Jamie Taylor. 2008. Freebase: A col-laboratively created graph database for structuring hu-man knowledge. In Proceedings of the 2008 ACM SIGMOD International Conference on Management of Data,Vancouver, B.C., Canada, 10–12 June 2008, pages 1247–1250.
Frantiˇsek Daneˇs. 1974. Functional sentence perspec-tive and the organization of the text. In F. Daneˇs, edi-tor,Papers on Functional Sentence Perspective, pages 106–128. Prague: Academia.
Orph´ee De Clercq, V´eronique Hoste, Bart Desmet, Philip Van Oosten, Martine De Cock, and Lieve Macken. 2014. Using the crowd for readability prediction. Nat-ural Language Engineering, 20(3):293–325.
Ludovic Denoyer and Patrick Gallinari. 2006. The Wikipedia XML corpus. ACM SIGIR Forum, 40(1):64–69.
Camille Guinaudeau and Michael Strube. 2013. Graph-based local coherence modeling. In Proceedings of the 51st Annual Meeting of the Association for Com-putational Linguistics (Volume 1: Long Papers),Sofia, Bulgaria, 4–9 August 2013, pages 93–103.
M. A. K. Halliday and Ruqaiya Hasan. 1976. Cohesion in English. London, U.K.: Longman.
Kenneth Heafield, Ivan Pouzyrevsky, Jonathan H. Clark, and Philipp Koehn. 2013. Scalable modified Kneser-Ney language model estimation. InProceedings of the 51st Annual Meeting of the Association for Compu-tational Linguistics (Volume 2: Short Papers), Sofia, Bulgaria, 4–9 August 2013, pages 690–696.
Johannes Hoffart, Fabian M. Suchanek, Klaus Berberich, and Gerhard Weikum. 2013. YAGO2: A spa-tially and temporally enhanced knowledge based from Wikipedia. Artificial Intelligence, 194:28–61. Matt J. Kusner, Yu Sun, Nicholas I. Kolkin, and Kilian Q.
Weinberger. 2015. From word embeddings to doc-ument distances. InProceedings of the 32nd Interna-tional Conference on Machine Learning,Lille, France, 6–11 July 2015, pages 918–927.
Heeyoung Lee, Angel Chang, Yves Peirsman, Nathanael Chambers, Mihai Surdeanu, and Dan Jurafsky. 2013. Deterministic coreference resolution based on entity-centric, precision-ranked rules. Computational Lin-guistics, 39(4):885–916.
Christopher D. Manning and Hinrich Sch¨utze. 1999. Foundations of Statistical Natural Language Process-ing. MIT Press, Cambridge, Mass.
Mohsen Mesgar and Michael Strube. 2014. Normalized entity graph for computing local coherence. In Pro-ceedings of TextGraphs-9: Graph-based Methods for Natural Language Processing, Workshop at EMNLP 2014,Doha, Qatar, 29 October 2014, pages 1–5. Mohsen Mesgar and Michael Strube. 2015. Graph-based
coherence modeling for assessing readability. In Pro-ceedings of STARSEM 2015: The Fourth Joint Confer-ence on Lexical and Computational Semantics, Den-ver, Col., 4–5 June 2015, pages 309–318.
Tomas Mikolov, Ilya Sutskever, Kai Chen, Gregory S. Corrado, and Jeffrey Dean. 2013. Distributed rep-resentations of words and phrases and their composi-tionality. InProceedings of Advances in Neural Infor-mation Processing Systems 26.Lake Tahoe, Nev., 5–8 December 2013, pages 3111–3119.
Jeffrey Pennington, Richard Socher, and Christopher D. Manning. 2014. GloVe: Global vectors for word rep-resentation. InProceedings of the 2014 Conference on Empirical Methods in Natural Language Processing, Doha, Qatar, 25–29 October 2014, pages 1532–1543. Emily Pitler and Ani Nenkova. 2008. Revisiting
Gerard Salton. 1971. The SMART Retrieval System – Experiments in Automatic Document Processing. En-glewood Cliffs, N.J.: Prentice Hall.
Nino Shervashidze, Tobias Petri, Kurt Mehlhorn, Karsten M. Borgwardt, and SVN Vishwanathan. 2009. Efficient graphlet kernels for large graph com-parison. InInternational Conference on Artificial In-telligence and Statistics, Clearwater Beach, Florida, 16–18 April 2009, pages 488–495.
Xifeng Yan and Jiawei Han. 2002. gSpan: Graph-based substructure pattern mining. In Proceedings of the International Conference on Data Mining, Maebashi City, Japan, 9–12 December 2002, pages 721–724. Muyu Zhang, Vanessa Wei Feng, Bing Qin, Graeme