Towards a standard evaluation method
for grammatical error detection and correction
Mariano FeliceandTed Briscoe
ALTA Institute, Computer Laboratory, University of Cambridge 15 JJ Thomson Avenue, Cambridge CB3 0FD, United Kingdom
{mf501,ejb}@cl.cam.ac.uk
Abstract
We present a novel evaluation method for grammatical error correction that addresses problems with previous approaches and scores systems in terms of improvement on the orig-inal text. Our method evaluates corrections at the token level using a globally optimal align-ment between the source, a system hypothesis, and a reference. Unlike the M2 Scorer, our method provides scores for both detection and correction and is sensitive to different types of edit operations.
1 Introduction
A range of methods have been applied to evaluation of grammatical error correction, but no entirely sat-isfactory method has emerged as yet. Standard met-rics (such as accuracy, precision, recall andF-score) have been used, but they can lead to different results depending on the criteria used for their computation (Leacock et al., 2014; Chodorow et al., 2012).
Accuracy, for example, can only be computed in cases where we can enumerate all true nega-tives, which is why it has been mostly used for article and preposition errors (De Felice and Pul-man, 2008; Rozovskaya and Roth, 2010). Extend-ing this approach to other error types involves the identification of all relevant instances or positions where an error can occur, which is not always easy and renders the evaluation process costly, language-dependent, and possibly inexact. Accuracy has also been criticised as being a poor indicator of predictive power, especially on unbalanced datasets (Manning and Sch¨utze, 1999).
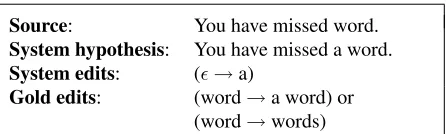
Source: You have missed word.
System hypothesis: You have missed a word.
System edits: (→a)
[image:1.612.315.538.243.310.2]Gold edits: (word→a word) or (word→words)
Figure 1: Mismatch between system and gold standard edits producing the same corrected sentence.
Alternatively, we can compute precision (P), re-call (R) andF-score by comparing system edits to gold-standard edits and thus circumvent the problem of counting true negatives. This was the official eval-uation scheme adopted for the HOO 2011 (Dale and Kilgarriff, 2011) and HOO 2012 (Dale et al., 2012) shared tasks. However, these metrics can fail when edits are not identical and therefore underestimate system performance (see Figure 1).
This problem was later addressed by the Max-Match or M2 Scorer (Dahlmeier and Ng, 2012),
which is able to identify equivalent edits by apply-ing a transitive rule (e.g. (→a) + (word→word) ⇒ (word → a word)). The scorer also allows for multiple gold standard annotations of each sentence, choosing the ones that maximise overallF-score. So far, the M2 Scorer has been the most reliable tool for evaluating error correction systems and has been used as the official scorer in the subsequent CoNLL 2013 (Ng et al., 2013), CoNLL 2014 (Ng et al., 2014) and EMNLP 2014 (Mohit et al., 2014) shared tasks. In 2014, system ranking was based onF0.5
-score, weighting precision twice as highly as recall. Nevertheless, this method also suffers from a number of limitations:
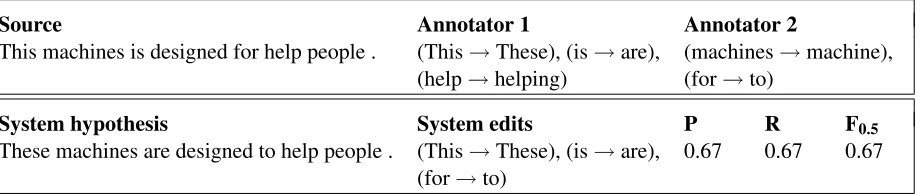
Source Annotator 1 Annotator 2 This machines is designed for help people . (This→These), (is→are),
(help→helping) (machines(for→to)→machine),
System hypothesis System edits P R F0.5
These machines are designed to help people . (This→These), (is→are),
[image:2.612.81.541.61.158.2](for→to) 0.67 0.67 0.67
Table 1: The M2Scorer is unable to mix and match corrections from different annotators.
Source Gold edits
Machine is design to help people . (Machine→Machines), (is design→are designed)
System hypothesis System edits P R F0.5
Machine is designed to help people . (design→designed) 0.00 0.00 0.00
Table 2: Partial matches are ignored by the M2Scorer.
(a) There is a limit to the number of unchanged words allowed in an edit (2 by default), whose value affects final results.
(b) Given that the computed metrics rely on true positive counts, a baseline system that does not propose any correct edits will not produce in-formative results (P = 1by definition,R = 0 and F = 0). The actual error rate and con-sequent potential for text improvement are not taken into account.
(c) It is not possible to discriminate between a ‘do-nothing’ baseline system and other systems that only propose wrong corrections, as they will all yieldF = 0.
(d) System performance is underestimated when using multiple annotations for a sentence, since the scorer will choose the one that maximises
F-score instead of mixing and matching all the available annotations (see Table 1).
(e) Partial matches are ignored (see Table 2). (f) Phrase-level edits can produce misleading
re-sults, as they may not always reflect effective improvements (see Table 3).
(g) The lack of a true negative count (i.e. the num-ber of non-errors) precludes the computation of accuracy, which is useful for discriminating be-tween systems withF = 0.
(h) There is no clear indicator of improvement on the original text after applying the suggested corrections, since an increase in P, R or F does not imply a reduction in the error rate (see Sec-tion 2.3.3).
(i) It is not clear how values of F should be in-terpreted (especially for F0.5), as there is no
known threshold that would signal improve-ment. Ranking byF-score does not guarantee that the top systems make the source text better.
(j) Detection scores are not computed.
In addition, Leacock et al. (2014) discuss key is-sues concerning system evaluation, such as the es-timation of true negatives and good practices for re-porting results, which are currently not addressed by the M2scorer.
2 Designing a new evaluation method
Source Gold edits
Machine is design to help people . (Machine→Machines), (is→are), (design→designed)
System hypothesis System edits P R F0.5
The machine is designed for helping
people . (Machine is(design→designed),→The machine is), (to help people→for helping people)
0.33 0.33 0.33
Machines is a design on the helping of
the people . (Machine(is design to help→Machines),→is a design on the helping of the)
0.50 0.33 0.45
Table 3: The M2Scorer evaluates systems based on the number of edits, regardless of their length and their effect on the final corrected sentence. The first hypothesis is better than the second despite having a lowerF0.5-score.
The following sections describe the three pillars of our method: a new annotation scheme, sentence alignment and metrics.
2.1 Annotation
We define a gold standard format where each sen-tence is annotated with a set of errors and their possi-ble corrections. A sentence can contain zero or more errors, each of which includes information such as type, a flag indicating whether a correction is re-quired, and a list of alternative corrections corsponding to each of the annotators. An error is re-quired to be corrected when all annotators provide a correction for it.
Unlike in other annotation schemes, each error is defined by its locus (regardless of the position of the incorrect tokens in the sentence) and all its alterna-tive corrections must be mutually exclusive. In other words, corrections are grouped whenever they refer to the same underlying error, even if the tokens in-volved are not contiguous. Listing 1 shows a sample XML annotation for the sentence in Table 1.
Because all the correction alternatives are mutu-ally exclusive, we can directly combine them to gen-erate all possible valid gold standard references. The annotation in Listing 1 would produce the following list of references:
Thesemachinesaredesigned forhelpingpeople . Thesemachinesaredesignedtohelp people . Thismachineis designed forhelpingpeople . Thismachineis designedtohelp people .
<sentence id="1" numann="2"> <text>
This machines is designed for help people .
</text> <error-list>
<error id="1" req="yes" type="SVA"> <alt ann="0">
<c start="0" end="1">These</c> <c start="2" end="3">are</c> </alt>
<alt ann="1">
<c start="1" end="2">machine</c> </alt>
</error>
<error id="2" req="yes" type="Vform"> <alt ann="0">
<c start="5" end="6">helping</c> </alt>
<alt ann="1">
<c start="4" end="5">to</c> </alt>
</error> </error-list> </sentence>
Listing 1: An example annotated sentence.
By mixing and matching corrections from differ-ent annotators, we avoid the performance underesti-mation described in 1.(d).
2.2 Alignment
are a special case of multiple sequence alignment, a well-known string matching problem in computa-tional biology (Mount, 2004).
We generate an exact (globally optimal) align-ment using a dynamic programming implealign-menta- implementa-tion of the Sum of Pairs (SP) alignment (Carrillo and Lipman, 1988), shown in Listing 2. Under this model, the score of a multiple alignment is the sum of the scores of each pairwise alignment, so that a globally optimal alignment has minimum SP score. Time and space complexity of the dynamic program-ming implementation for k strings of length n is
O(nk), which is acceptable for three average-length
sentences but can quickly become impractical for a larger number of sequences.
In computational biology, edit costs are defined in terms of mutation probabilities, which are irrelevant to our task. However, we can find new optimal costs by defining a set of constraints that are meaningful for error correction:
(a) Matches have zero cost (cmatch= 0).
(b) Gaps (insertions or deletions) are more costly than matches (cgap > cmatch).
(c) Mismatches (substitutions) are set to be more costly than gaps (insertions or deletions) so as to maximise matches (cmis> cgap).
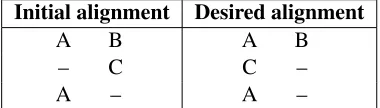
Given these constraints, we can set cgap = 1 and cmis = 2; however, they will not necessarily keep gaps aligned (see Table 4). To ensure this, we must place a new constraint on the SP algorithm so that a gap-aligned version (desired alignment) has a lower cost than a gap-unaligned version (initial alignment):
cost(A,–)+...+cost(B,–)>cost(A,C)+...+cost(B,–)
cgap+...+cgap > cmis+...+cgap 4cgap+cmis >2cmis+ 2cgap
2cgap > cmis
Therefore2cgap > cmis > cgap > cmatch. For our implementation, we adoptedcgap = 2andcmis= 3.
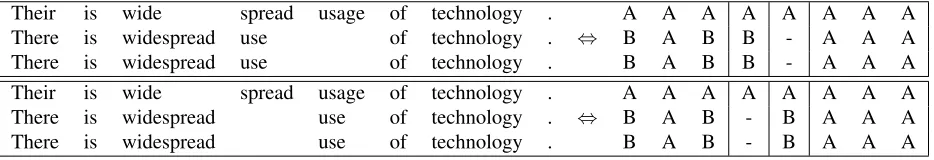
There can be more than one optimal alignment for a given set of strings. Some of these alignments will look more intuitive than others (see Table 5) but they are equally optimal for our evaluation method and will produce the same final results.
Initial alignment Desired alignment
A B A B
– C C –
[image:4.612.332.522.61.115.2]A – A –
Table 4: Initial and desired alignments showing differ-ences in the distribution of gaps.
/* Initialisation */ cmatch := cost of match
cmis := cost of mismatch
cgap := cost of gap
D[0, 0, 0] := 0
D1,2[i, j] := edit_distance(S1[1..i], S2[1..j])
D1,3[i, k] := edit_distance(S1[1..i], S3[1..k])
D2,3[j, k] := edit_distance(S2[1..j], S3[1..k])
/* Recurrences for boundary cells */ D[i, j, 0] := D1,2[i, j] + (i + j) * cgap,
D[i, 0, k] := D1,3[i, k] + (i + k) * cgap,
D[0, j, k] := D2,3[j, k] + (j + k) * cgap,
/* Recurrences for non-boundary cells */ for i := 1 to n1 do
for j := 1 to n2 do
for k := 1 to n3 do
begin
if (S1[i] = S2[j]) then cij := cmatch
else cij := cmis;
if (S1[i] = S3[k]) then cik := cmatch
else cik := cmis;
if (S2[j] = S3[k]) then cjk := cmatch
else cjk := cmis;
d1 := D[i-1, j-1, k-1] + cij + cik + cjk; d2 := D[i-1, j-1, k] + cij + 2 * cgap;
d3 := D[i-1, j, k-1] + cik + 2 * cgap;
d4 := D[i, j-1, k-1] + cjk + 2 * cgap;
d5 := D[i-1, j, k] + 2 * cgap;
d6 := D[i, j-1, k] + 2 * cgap;
d7 := D[i, j, k-1] + 2 * cgap;
D[i, j, k] := Min(d1,d2,d3,d4,d5,d6,d7); end;
Listing 2: The Sum of Pairs dynamic programming algo-rithm for the alignment of three sequences, S1, S2and S3 (adapted from Gusfield (1997)).
2.3 Metrics
Their is wide spread usage of technology . A A A A A A A A There is widespread use of technology . ⇔ B A B B - A A A There is widespread use of technology . B A B B - A A A Their is wide spread usage of technology . A A A A A A A A There is widespread use of technology . ⇔ B A B - B A A A There is widespread use of technology . B A B - B A A A
Table 5: Two equally optimal alignments under the SP alignment model.
Tokens Classification Source Hypothesis Reference Detection Correction
a a a TN TN
a a b FN FN
a a - FN FN
a b a FP FP
a b b TP TP
a b c TP FP, FN, FPN
a b - TP FP, FN, FPN
a - a FP FP
a - b TP FP, FN, FPN
a - - TP TP
- a a TP TP
- a b TP FP, FN, FPN
- a - FP FP
[image:5.612.82.261.594.661.2]- - a FN FN
Table 6: Our extended WAS evaluation scheme.
The limitation in 1.(j) is addressed by computing these metrics for both detection and correction.
We adopt an extended version of the Writer-Annotator-System (WAS) evaluation scheme (Chodorow et al., 2012) where each token align-ment is classified as a true positive (TP), true negative (TN), false positive (FP) or false negative (FN). As noted by Chodorow et al. (2012), cases where source 6= hypothesis 6= reference1 are both a FP and a FN for correction,2 so we introduce a new FPN class to count such cases and adjust our metrics accordingly. Our extended WAS scheme is shown in Table 6.
With these counts, we can computeP,RandFβ
using their standard definitions:
P = TPTP+FP R= TPTP+FN
Fβ = (1 +β2)·(β2P·P·) +R R
1Note that we use different terminology where source = writer,hypothesis=systemandreference=annotator.
2From a correction perspective, an alignment where a 6= b6=cgenerates a FP for thebclass and a FN for thecclass.
As mentioned in Section 1, theF measure does not shed light on the error rates in the data and is un-able to discriminate between a ‘do-nothing’ baseline and other systems unless TP>0. However, because we now have a TN count, we can address problems 1.(b) and 1.(c) by computing accuracy (Acc) as fol-lows:
Acc= TP+TNTP+FP++TNFN−FPN
Unlike in information retrieval, for example, where the whole document collection is usually un-known to the user so TNs are perhaps less relevant, the sentences fed into an error correction system will be provided by users. In this context, TNs are rele-vant because they indicate what parts of the text are already correct, allowing users to focus on problem-atic regions. For this reason, accuracy seems a more appropriate measure of text quality thanF-score.
2.3.1 Weighted accuracy
Accuracy treats all counts equally, which has two main side effects. A system that introduces the same number of TPs and FPs will have the same accuracy as the ‘do-nothing’ baseline, in which case we would prefer to keep the original text and rank the system lower, in accord with the choice ofF0.5 for
evaluat-ing the 2014 shared task. Accuracy is also unable to discriminate between systems with different TP and TN counts if their sum is the same.
It is clear that for error correction these counts should be weighted differently. In particular, we would like to:
• Reward correction more than preservation (i.e. weightTP>weightTN).
0.0 0.1 0.2 0.3 0.4 0.5 0.6 0.7 0.8 0.9 1.0
1 2 3 4 5 6 7 8 9 10 11 12 13 14 15
WA
cc
w
All correct
Above baseline
Baseline
Below baseline
[image:6.612.73.299.58.177.2]All incorrect
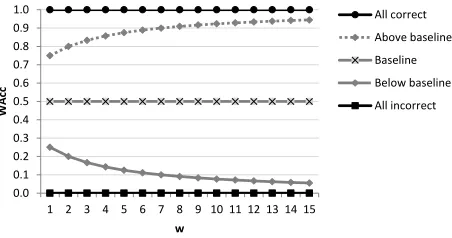
Figure 2: Effect ofwon weighted accuracy (WAcc).
We can reformulate accuracy to satisfy these con-ditions by including a weight factorw >1:
WAcc= w·TP+TN
w·TP+TN+w· FP−FPN 2
+ FN−FPN
2
= w·TP+TN
w·TP+TN+w·FP−w· FPN
2 +FN−FPN2
= w·TP+TN
w·(TP+FP) +TN+FN−(w+ 1)·FPN 2
Higher values ofwwill reward and penalise sys-tems more heavily, bringing those below the base-line closer to the lower bound and those above the baseline closer to the upper bound (see Figure 2). Aswincreases, differences betweenWAccsysand its bounds become less pronounced, which is why we adopt w = 2. Regardless of w, WAcc will always reduce toAccfor the ‘do-nothing’ baseline.
2.3.2 Metric behaviour
[image:6.612.313.541.60.127.2]Before we set out to evaluate and compare sys-tems, we must understand how metrics behave and to what extent they are comparable.
Table 6 indicates that the metrics will always pro-duce the same results for detection and correction unlesssource6=hypothesis 6=referencefor at least one position in the alignment. A ‘do-nothing’ base-line will always produce the same results for both aspects, sincesource=hypothesisfor all positions. Whenever a gold standard allows for alternative corrections, references that maximise the target met-ric should be chosen. Nevertheless, we note that the (maximum) score obtained by a system only applies to a given set of chosen references and is therefore only directly comparable to results on the same ref-erence set.
System Chosen references P R F0.5
S1 1.2, 2.1, 3.1 0.60 0.20 0.43 S2 1.2, 2.1, 3.1 0.80 0.05 0.20 S1 1.1, 2.1, 3.2 0.30 0.30 0.30
S2 1.1, 2.1, 3.2 0.30 0.40 0.32
Table 7: S1outperforms S2in terms of overallF0.5but S2 outperforms S1when evaluated on different references.
To illustrate this, consider two systems (S1 and S2) evaluated on a gold standard containing 3 sen-tences with 2 correction alternatives each (i.e. six possible references: 1.1, 1.2, 2.1, 2.2, 3.1 and 3.2 respectively). Table 7 shows that, while S1achieves a higher maximum score than S2, comparing their
F0.5 scores directly is not possible as they are
com-puted on a different set of references. In fact, S2 could outperform S1on other reference sets.
2.3.3 Measuring improvement
We know that whenever P > 0.5, the error rate decreases (and therefore Accincreases) so the text is improved.3 However, an increase in P, R orF alone does not necessarily imply an increase inAcc orWAcc, as illustrated in Table 8.
In order to determine whether a system improves on the source text, we must compare its performance (WAccsys) with that of the baseline (WAccbase). Be-cause eachWAccsysis computed from a different set of references, we must compute WAccbase individ-ually for each system using its chosen references. This is done by using the source sentence as the hy-pothesis in the existing alignment. Once we have WAccsysandWAccbasefor each system, we can com-pare them to determine if the text has improved. When these two values are equal, there is no ben-efit to deploying the system.
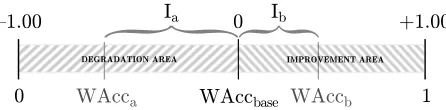
If we want to compare and rank systems, we need to measure how much the text has been improved or degraded. This can be done using a baseline-normalised metric that measures relative coverage of the area between the baseline andWAccbounds (see Figure 3). This metric, henceforthImprovement or
[image:6.612.72.298.263.345.2]System TP FP TN FN P R F0.5 Acc WAcc
Baseline 0 0 6 4 1.00 0.00 0.00 0.60 0.60
S1 4 1 5 0 0.80 1.00 0.83 0.90 0.87
S2 1 0 6 3 1.00 0.25 0.62 0.70 0.73
S3 1 1 5 3 0.50 0.25 0.42 0.60 0.58
S4 4 6 0 0 0.40 1.00 0.45 0.40 0.40
Table 8: An increase inP,RorF does not necessarily translate into an increase inAcc, assuming all systems are evaluated on the same set of references.
0 WAcca WAccbase WAccb 1
{
{
IMPROVEMENT AREA DEGRADATION AREA
[image:7.612.147.466.60.144.2]{1.00 Ia 0 Ib +1.00
Figure 3: Graphical representation of improvement for two hypothetical systems, a and b. Values ofIare shown at the top while values ofWAccare shown at the bottom.
Value Interpretation
1 100% improvement (100% correct text).
>0 Relative improvement.
0 Baseline performance (no change).
<0 Relative degradation.
-1 100% degradation (100% incorrect text).
Table 9: Interpretation ofIvalues.
I, is defined as:
I=
bWAccsysc ifWAccsys=WAccbase
WAccsys−WAccbase
1−WAccbase ifWAccsys>WAccbase
WAccsys
WAccbase −1 otherwise
Values of I lie in the[−1; 1]interval and should be interpreted as per Table 9. The use of this metric provides a solution to problems 1.(h) and 1.(i).
The I-measure should be computed after max-imising systemWAccat the sentence level, so as to ensure all the evaluated hypotheses are paired with their highest scoring references.
3 Experiments and results
We tested our evaluation method by re-ranking sys-tems in the CoNLL 2014 shared task on grammatical error correction. Re-ranking was limited to the 12
participating teams that made their system’s output publicly available.
For the gold standard, we used the shared task test set containing corrections from the two official an-notators as well as alternative corrections provided by three participating teams. This version allowed us to generate many more references than the origi-nal test set and thus reduce annotator bias.
The corrections extracted from the gold standard were automatically clustered into groups of inde-pendent errors based on token overlap. This means that overlapping corrections from different annota-tors are considered to be mutually exclusive (i.e. alternative) corrections of the same error and are therefore grouped together (the error elements in Listing 1). Provided the original annotations are cor-rect, the combination of alternatives will generate all possible valid references. Sentences containing cor-rections that could not be automatically clustered be-cause they require human knowledge were excluded, leaving a subset of 711 sentences (out of 1,312).
We restrict our analysis to correction, since that is the only aspect reported by the M2Scorer. Table 10
shows the results of the M2Scorer using the original
annotations as well as a modified version containing mixed-and-matched corrections. Results of our pro-posed evaluation method are included in Table 11.
As expected, rankings are clearly distinct between the two methods, as they use different units of evalu-ation (phrase-level edits vs tokens) and maximising metrics (F0.5 vsWAcc). Results show that only the
UFC system is able to beat the baseline (by a small but statistically significant margin), being also the one with consistently highestP (much higher than the rest).
These rankings are affected by the fact that sys-tems were probably optimised for F0.5 during
[image:7.612.74.297.191.246.2]System TP TN FP FN FPN P R F0.5 Acc WAcc WAccbase I↓ UFC 19 13062 7 665 2 73.08 2.78 12.06 95.13 95.09 95.03 1.35 BASELINE 0 13078 0 673 0 100.00 0.00 0.00 95.11 95.11 95.11 0.00 IITB 11 13057 26 668 4 29.73 1.62 6.65 94.98 94.82 95.06 -0.25 SJTU 54 12947 114 649 8 32.14 7.68 19.64 94.51 93.79 94.89 -1.16 CUUI 290 12697 337 553 34 46.25 34.40 43.27 93.82 91.86 93.91 -2.18 PKU 128 12800 283 625 66 31.14 17.00 26.70 93.89 92.28 94.53 -2.38 AMU 219 12761 322 556 41 40.48 28.26 37.26 93.94 92.06 94.39 -2.47 UMC 179 12761 314 603 26 36.31 22.89 32.50 93.56 91.67 94.35 -2.84 IPN 25 12848 251 680 40 9.06 3.55 6.91 93.53 92.00 94.88 -3.04 POST 231 12588 454 574 46 33.72 28.70 32.58 92.88 90.23 94.17 -4.18 RAC 147 12723 426 623 49 25.65 19.09 24.00 92.79 90.28 94.45 -4.41 CAMB 386 12402 641 502 78 37.59 43.47 38.63 92.31 88.77 93.59 -5.15 NTHU 196 12620 521 575 54 27.34 25.42 26.93 92.48 89.44 94.44 -5.29
Table 11: Results of our new evaluation method (in percentages). All values ofIare statistically significant (two-tailed paired T-test,p <0.01).
System Original annotationsP R F Mixed annotations
0.5↓ P R F0.5↓
CUUI 47.66 33.87 44.07 47.57 39.60 45.73 AMU 44.68 29.44 40.48 44.56 33.49 41.80 CAMB 39.22 41.65 39.69 39.04 48.72 40.66 POST 36.39 29.13 34.67 36.39 33.79 35.84 NTHU 33.56 28.10 32.31 33.62 31.52 33.18 UMC 34.86 20.86 30.73 34.86 23.31 31.71 RAC 33.67 19.08 29.21 33.67 21.59 30.28 PKU 32.17 19.60 28.51 32.42 21.63 29.48 SJTU 28.00 7.08 17.60 28.00 7.46 18.06 UFC 73.08 3.26 13.83 73.08 3.39 14.31 IPN 9.16 3.87 7.20 9.16 4.09 7.34 IITB 30.30 1.74 7.07 30.30 1.81 7.31 BASELINE 100.00 0.00 0.00 100.00 0.00 0.00
Table 10: M2Scorer results (in percentages).
for the shared task. Rankings by F0.5 are almost
identical for the two methods (Spearman’s rank cor-relation is0.9835 with p < 0.01), suggesting that there is a statistically significant difference between phrase-level edits and tokens, despite phrases being only1.12tokens on average in this dataset.
Spearman’s ρ between both scorers (F0.5 vs I)
is−0.5330, which suggests they generally produce inverse rankings. Pearson’s correlation between token-level F0.5 and I is −0.5942, confirming the
relationship between rankings and our intuition that
F0.5 is not a good indicator of overall correction
quality. While theI-measure reflects improvement,
F0.5indicates error manipulation. We argue thatIis
better suited to the needs of end-users (as it indicates whether the output of the system is better than the
original text) whereasF0.5 is more relevant to
sys-tem developers (since they need to analyseP andR
in order to tune their systems).
Lastly, we verify that mixing and matching cor-rections from different annotators improves R (see Table 10) and ensures systems are always assigned the maximum possible score.
4 Discussion
Automatic evaluation metrics that are based on com-parisons with a gold standard are inherently limited by the number of available references. Although this does not pose much problem for tasks such as part-of-speech tagging, it does constrain evaluation for text generation tasks (such as error correction, ma-chine translation or summarisation), where the num-ber of ‘correct answers’ goes beyond a few collected references.
Sentences can be corrected in many different ways and the fact that a given correction is not matched by any of the references does not neces-sarily mean that it is not valid. Therefore, we must accept that any metric used in such scenarios will not be perfect. However, it is worth noting that this limitation does not extend to evaluation of error de-tectionper seusing such metrics.
es-System hypotheses Best F0.5 I a. The son was died after one year ’s treatment and a couple got divorced later after that .
×
b. The son had died after one year ’s and the couple got divorced later after that .×
a. Although there might be a lot of challenges along the way in seeking medical attention ,such as a financial issues , everyone should be given right of knowing their family ’s
inherented medical conditions .
×
b. Although there might be a lot of challenges along the way in seeking medical attention , such as finance , everyone should be given the right of knowing their family ’s
inherented medical conditions .
×
a. Taking Angeline Jolie , for example , she is famous but she still reveal the truth about
her genetic testing to the development of her breast cancer risk .
×
b. Taking Angeline Jolie for example , she is famous but she still revealed the truth about [image:9.612.72.541.58.269.2]her genetic testing on the development of her breast cancer risk .
×
Table 12: Example hypotheses produced by two error correction systems (a and b). The last two columns indicate the highest-scoring hypothesis from each pair according to each evaluation metric.
sentially distance metrics, but judging between hy-potheses without looking at the source or reference sentences is a distinct task, which is more similar to sentence quality estimationfor machine translation output.
Our evaluation method overcomes many of the limitations of previous approaches by using a stable unit of evaluation, weighting edit operations in line with the goals of grammatical error correction and making the most of the available annotations. Val-ues ofF are always positive, with no clear interpre-tation or threshold that would indicate improvement of the original text whereas theI-measure provides meaningful indicators (I <0for degradation,I = 0 for no change and I > 0 for improvement). Table 12 shows a few examples where the M2 Scorer
dif-fers from our method, revealing how theI-measure is able to pick hypotheses in accord with (at least our) intuitions.
5 Conclusion
We have presented a new evaluation method for grammatical error detection and correction that overcomes many of the limitations of previous ap-proaches and provides more meaningful indicators of system performance.
The method is designed to evaluate improvement in correction of the input text by analysing
post-system error rate. Improvement is measured using a reformulation of accuracy where TPs and FPs are weighted higher than TNs and FNs, in an attempt to model desirable aspects of correction. We also combine individual corrections from different anno-tators, as this improves R and ensures systems get the maximum possible score from the available an-notations.
Experiments showI andF0.5 are inversely
corre-lated and account for different aspects of system per-formance. Choosing one metric over the other poses a fundamental question about the aims of error cor-rection, whether we prefer a system that tackles few errors but improves the original text or one that han-dles many more errors but degrades the original. We believe that, from a user perspective, a system that reliably improves text is more desirable.
Future work might usefully explore automated sentence quality estimation, as a component both of grammatical error correction systems and of their evaluation, in order to ameliorate the issue that any set of gold standard references will underspecify the set of possible corrections.
An open-source implementation of our evalua-tion method is available for download at https:
Acknowledgments
We would like to thank Øistein Andersen and Zheng Yuan for their constructive feedback, as well as the anonymous reviewers for their comments and sug-gestions. We are also grateful to Cambridge English Language Assessment for supporting this research via the ALTA Institute.
References
Humberto Carrillo and David Lipman. 1988. The mul-tiple sequence alignment problem in biology. SIAM J. Appl. Math., 48(5):1073–1082, October.
Martin Chodorow, Markus Dickinson, Ross Israel, and Joel Tetreault. 2012. Problems in evaluating gram-matical error detection systems. In Proceedings of COLING 2012, pages 611–628, Mumbai, India, De-cember. The COLING 2012 Organizing Committee. Daniel Dahlmeier and Hwee Tou Ng. 2012. Better
evalu-ation for grammatical error correction. InProceedings of the 2012 Conference of the North American Chap-ter of the Association for Computational Linguistics: Human Language Technologies, NAACL 2012, pages 568 – 572, Montreal, Canada.
Robert Dale and Adam Kilgarriff. 2011. Helping Our Own: The HOO 2011 Pilot Shared Task. In Pro-ceedings of the Generation Challenges Session at the 13th European Workshop on Natural Language Gener-ation, pages 242–249, Nancy, France, September. As-sociation for Computational Linguistics.
Robert Dale, Ilya Anisimoff, and George Narroway. 2012. HOO 2012: A Report on the Preposition and Determiner Error Correction Shared Task. In Proceedings of the Seventh Workshop on Building Educational Applications Using NLP, pages 54–62, Montr´eal, Canada, June. Association for Computa-tional Linguistics.
Rachele De Felice and Stephen G. Pulman. 2008. A Classifier-Based Approach to Preposition and Deter-miner Error Correction in L2 English. In Proceed-ings of the 22nd International Conference on Compu-tational Linguistics (COLING 2008), pages 169–176, Manchester, UK, August. COLING 2008 Organizing Committee.
Dan Gusfield. 1997. Algorithms on Strings, Trees and Sequences. Cambridge University Press.
Claudia Leacock, Martin Chodorow, Michael Gamon, and Joel Tetreault. 2014. Automated Grammatical Error Detection for Language Learners, Second edi-tion. Synthesis Lectures on Human Language Tech-nologies. Morgan & Claypool Publishers.
Christopher D. Manning and Hinrich Sch¨utze. 1999. Foundations of Statistical Natural Language Process-ing. The MIT Press, Cambridge, Massachusetts. Behrang Mohit, Alla Rozovskaya, Nizar Habash,
Wa-jdi Zaghouani, and Ossama Obeid. 2014. The First QALB Shared Task on Automatic Text Correction for Arabic. In Proceedings of the EMNLP 2014 Work-shop on Arabic Natural Language Processing (ANLP), pages 39–47, Doha, Qatar, October. Association for Computational Linguistics.
David W. Mount. 2004. Bioinformatics: Sequence and Genome Analysis, Second edition. Cold Spring Harbor Laboratory Press.
Hwee Tou Ng, Siew Mei Wu, Yuanbin Wu, Chris-tian Hadiwinoto, and Joel Tetreault. 2013. The CoNLL-2013 Shared Task on Grammatical Error Cor-rection. In Proceedings of the Seventeenth Confer-ence on Computational Natural Language Learning: Shared Task, pages 1–12, Sofia, Bulgaria, August. As-sociation for Computational Linguistics.
Hwee Tou Ng, Siew Mei Wu, Ted Briscoe, Christian Hadiwinoto, Raymond Hendy Susanto, and Christo-pher Bryant. 2014. The CoNLL-2014 Shared Task on Grammatical Error Correction. InProceedings of the Eighteenth Conference on Computational Natural Language Learning: Shared Task, pages 1–14, Balti-more, Maryland, June. Association for Computational Linguistics.