The Methodology of the Second Programme
for Economic Expansion
1By W J L RYAN
{Read before the Society on February 28th, I964)2
The purpose of the exercise described in this paper was to obtain a profile of the Irish economy m 1970 which reflected the highest growth rate which could be achieved in the light of policy possibilities, the probable development of the external environment and resource availability Two methods were used first the iterative method and second, a formalised and reasonably comprehensive model of the economy which would give a simultaneous solution for 1970 These two methods are complementary The first method was elaborated mainly by the Department of Finance, the work on the second method was carried out mainly by the Economic Research Institute There was frequent liaison between the two methods All calculations were maae at constant (i960) prices The Department and the Institute both intend to integrate possible price changes in their work, but the task of doing so is very difficult
I THE ITERATIVE METHOD
The iterative method proceeds by successive approximation It starts with a simple breakdown (e g of output or expenditure), and goes on to more and more detailed breakdowns At each stage, the breakdown of the figures is checked against past experience and future prospects The method is laborious because changes made at the level of the more detailed breakdown will require changes at the less detailed levels, and these in turn will require changes at the more detailed levels There is, therefore,
1 This paper records the work done m the Department of Finance in preparing the outline of the second programme I was involved in this work in my capacity as economic consultant to the Development Division in the Department I am indebted to Dr T K Whitaker, Mr C H Murray, Dr R C Geary, Dr M D McCarthy, Dr B Menton, Mr L Leonard and Professor R Barback for drawing attention to obscurities and inaccuracies in an earlier draft I alone am responsible, however, for any defects which may still remain in the record
a continuous piocess of checking and cross-checking between different levels of detailed breakdown for each aggregate (such as output or expen-diture) and between corresponding levels of breakdown for different aggregates The iterative method requires a large number of judgments, not all of which are of a narrow, economic kind It consists of much more, therefore, than a technical economic exercise The use of a formal model also requires the exercise of judgment if the judgments are fewer m number, they are much larger in magnitude In applying the iterative method, however, one cannot be sure that there are not inconsistencies between the assumptions made in relation to the growth of output and the corresponding demand for imports on one hand and in relation to the development of final demand in the categories of consumption, investment and exports on the other
The terminal date of the first programme was the end of the year 1963, and a second programme with the same currency as the first would have run to the end of the year 1968 In January 1962, when the work on the preparation of the second programme began, the latest year for which firm statistics were available was 1960 The year 1960 had the disadvantage that it was only the second year of the first programme It had the advan-tage, however, that by 1960 the economy in general, though not fixed capital formation, had recovered from the inertia of the later 50s and was substantially above the previous cyclical peak of 1955 It also meant that it was possible to exclude from the period of the projection the initial stages of the post-1958 recovery Given that the starting point had to be the calendar year 1960, and given also that the end of the transitional period for membership of the EEC was December 31st, 1969 (and in January 1962 it still seemed likely that Ireland would soon follow Britain into membership of the Community), there were good grounds for extending the currency of the second programme until 1970 so as to make it co-termmous with the period of the OECD collective target of 50 %
The iterative method can be developed only if some assumption is made about the growth rate in GNP Initially, three growth rates—3 % p a , 5% p a and 7% p a during 1960-70—were taken and breakdowns of the implications of each of these rates for the mam sectors were worked out The rate of 7 % p a was dropped fairly early in the exercise because both the Department of Finance and the Economic Research Institute concluded that its requirements were very unlikely to be met from the available resources and within reasonable ranges of external deficit Attention was then concentrated on the growth rates m the range 3 % to 5 % p a , and a more detailed elaboration along the lines described below was worked out for these growth rates From this, a growth rate of 4 % p a emerged as the highest rate which seemed possible in the light of the limitations imposed by the availability of internal and external resources This rate was rounded up to a 50% increase3 for the period 1960-70, I e to an average annual rate of 4 14%
The development of the iterative method is described below The
elaboration is based on the assumption of a 4 2 % p a growth rate m real GNP, so that it will be easier for the reader to relate the illustrative material to the contents of the Second Programme for Economic Expan-sion It must be remembered, however, that the choice of a growth rate, while it was conditioned by the desire to set it as high as possible, was made in. the light of these preliminary investigations
II PROJECTIONS OF EMPLOYMENT AND PRODUCTIVITY
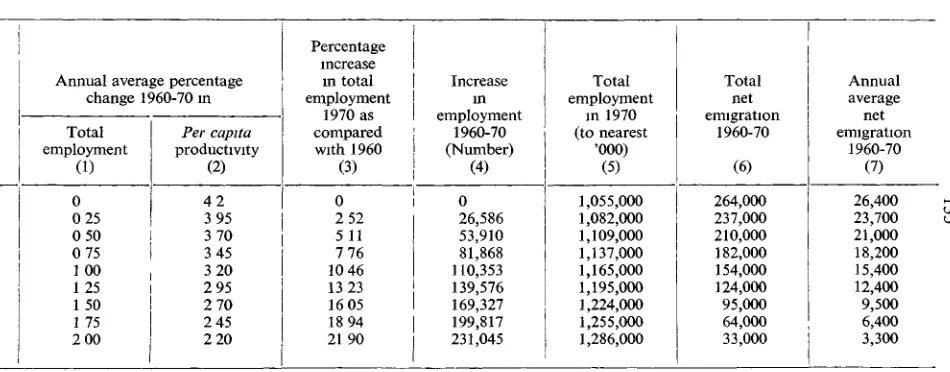
The first step was to examine the availability of labour and the implica-tions for productivity of different rates of change in employment The starting point was the preliminary results of the 1961 Census of Population which gave figures for the total popul?tion, population of working age (15-64), total labour force and total at work on the Census date Given these figures, it is possible to make an approximate estimate of the total population and of the numbers of those gainfully occupied in the age group 15-64 years m 1971, on the assumption that there would be no net emigration This, of course, involves an assumption as to the level of unemployment in 1971 and in making the estimate, it was also assumed that there were constant age-sex specific participation rates in the labour force By simple extrapolation these figures were converted to the period 1960-70 Table I illustrates some of the sets of combinations of changes in productivity, employment and net emigration consistent with these estimates In Column (1) various annual percentage rates of increase in employment are shown The implied annual average percentage changes m productivity per head are shown in Column (2) These two percentage figures in any instance add approximately to the percentage increase of 4 2 % per annum which is assumed lor the real GNP In Column (3) the aggregate percentage change over the ten-year period is shown for each of the assumed annual rates of increase of employment These percentages were applied to the 1960 figure to yield the total increases shown in Column (4), and these are added to the 1960 employment to give the aggregates m Column (5) The differences between these figures and the projected figure for the number of those gainfully occupied, on the assumption of zero net emigration, yield the aggregate net emigration figures for the decade as given m Column (6) and these have been converted to annual average figures of net emigration in Column (7) The Table shows that for any given overall growth rate, the smaller is emigration, the greater the increase m employment and the lower the required increase m output per person While the pattern is obvious, the orders of magnitude displayed by the figures is interesting
significantly to 1 educe the range of possibilities (of which a small sample is given in Table I) without making assumptions about the behaviour of employment and productivity The experience of the OECD countnes whose real GNPs grew at annual average rates exceeding 3% p a during the 1950s, shows that the rate of increase in productivity tended to be the higher, the higher was the rate of increase in employment There are some theoretical reasons why this might be expected to be so, but these are weakened by the possibility that changes m both employment and product-ivity are derivatives of the basic foices which determine the rate of growth in the GNP The prospect of freer trade during the 1960s meant that it was desirable that the rate of productivity increase here should be rather higher than in countries from which might come the imports with which our industries would have to compete The information which was then available about the probable development of output per person in the main OECD countries during the period to 1970 suggested that an annual average increase in productivity of at least 3% p a should be looked for in Ireland In considering the possibilities for 1960-70, account was taken of the productivity increases achieved since 1958 These were not mechani-cally projected into the future, however, because the amount of idle capacity in the economy immediately after 1958 meant that productivity rose rapidly as output was expanded
Many of the influences listed m the previous paragraph are vague and ambiguous in their effects It was felt, nevertheless, that they were strong enough to limit somewhat the range of possibilities for a 4 2% growth rate to possibilities such as 2 to 5 in Table 1 with similar limitations for the other growth rates considered
111 PROJECTIONS OF SECTORAL OUTPUTS
Table 11 shows the net national product at factor cost according to sectors of origin and the derivation of the gross national product at market prices by the inclusion of estimated depreciation and indirect taxes less subsidies The figures in the final column show the gross national product at factor cost arising in each sector The first sector includes agriculture, forestry and fishing, and the second covers manufacturing industry pJus mining, quarrying and turf production plus the services in-cluded in the Census of Industrial Production (I e building and con-struction, electricity, gas and water, and laundries, etc ) The third sector includes distribution and transport, public administration and defence and all the other domestic services The fourth sector, net foreign income, has three components, namely, net inflow of profits, etc , net inflow of wages, salaries and pensions and the net inflow of emigrants' remittances
sector and of zero for net foreign income Given the very simple assump-tions on which Table III is based, it merely illustrates the obvious fact that, other things remaining equal, the slower is the growth rate m agri-culture, the faster is the required growth rate for industry
The next step was to make a provisional choice of a set of sectoral growth rates The behaviour of indirect taxes less subsidies reflects policy decisions At 1960 rates ol tax and subsidy the behaviour of the total will reflect the sales of the taxed or subsidised commodities and services Rough projections, confirmed by more detailed work, indicated that the assump-tion of an increase of 50 % for this item was not unreasonable 4
The Department of Agriculture made a detailed breakdown of the likely expansion of output and exports of the mam agricultural products between 1960 and 1970 This was based on the assumption that by 1970 Irish agriculture would be benefiting from the agricultural policy of the EEC and on various assumptions about output potential and market prospects for particular commodities The Department of Agriculture calculations indicated that an annual average growth rate of 2 7 %5 p a would be appropriate and this rate was adopted for the sector agriculture, forestry and fishing
As was stated earlier, net foreign income has three components net inflow of profits, etc, net inflow of wages, salaries and pensions and net inflow of emigrants' remittances, etc , with values in 1960 of £15 3m, £5 7m , and £13 0m , respectively The level of the net inflow of emigrants' remittances in 1970 depends mainly on the levels of emigration during 1965-70, and will therefore reflect the precise assumption which is made about emigration To the extent that war pensions are an important element in the second component, it will tend io fall duimg the 1960s The behaviour of the net inflow of profits, etc , will depend partly upon what happens in Britain but mainly upon the extent to which foreign borrowing and foreign disinvestment are needed to help finance the investment targets of the second programme At a much later stage in the process of iteration a fall in net foreign income from £34m in 1960 to £18m in 1970 emerged as the figure which would be consistent with the matrix of assumptions which was by then being made
Two sectors remained, namely, industry and other domestic and an attempt was made to estimate each of these for 1970 The other domestic sector includes a vast variety of services Many of these services contribute to the generation of output m agriculture and industry (e g banking, insurance, wholesaling and retailing), while others are largely the result of what happens m the other sectors (e g catering) The behaviour of real output in the other domestic sector was measured for the 1950s as a residual by estimating (a) the aggregate national expenditure at constant
4 This was later increased to 51 %
prices and (b) the product of the agricultural and industrial sectors in quantum terms, and this provided a basis (admittedly slender) for pro-jection In addition, an attempt was made to allow for the various influences which were expected to affect the development of output m this sectoi during the 1960s—e g the growth of private and public road transport associated with different growth rates in GNP, the growth m public administration related to the assumptions made about the growth m public consumption, the growth m current expenditure on education and on tourism, etc It was not possible to quantify m any precise way the various influences affecting the growth of the whole sector There was general agreement, however, that the "other domestic" sector would grow at a slower rate than the GNP and a rate withm the range 3 %—4 % p a seemed the most likely
More information was available about the industrial sector A pie-limmary attempt was made to estimate the development of output in this sector to 1970 taking account of the following past experience in. the 1950s, the reports of the Committee on Industrial Organisation which had come to hand, general export prospects, recent experience in attracting new industry, an estimate of the additional output likely to come from new firms and industries m process of being established and, where relevant, experience and prospects of corresponding industries elsewhere At this stage it seemed that the industry growth rate should he within the range of 6%—8% p a This would compare with 3 35% p a during
1953-62 and 7 2% p a (provisional) during 1958-62
pessimism 6 The explanation may he m a tendency on the pait of economists to overestimate adverse influences and to relate future prospects too mechanically to past performance This detailed exercise was repeated
in an attempt to correct for this factor and the conclusion was reached that a growth rate of 7 % p a would be a reasonable expectation In doing this, the growth rates applied to individual industries varied from —6 % p a to + 1 8 % p a
At about this stage an attempt was made to estimate exports for each of the 52 transportable goods industries It is notoriously difficult to make export projections, but it was considered that some attempt must be made to provide a cross-check on the export figure which emerged from the iteration of expenditure on the GNP (see below) Initially, in fixing a level of exports for each of the fifty-two industries in 1970 regard was had to the following the past record of the industry and especially export performance since 1958, the CIO reports, Dr Leser's estimates of the income elasticity of demand for broad categories of consumer goods,7 the development of demand in Britain and in EEC (based on these coun-tries' projections), and the number of new grant-aided firms "m the pipeline", in prospect or in process of working up to full production The broad conclusion which emerged was that the export targets for individual industries, which seemed to be consistent with the net output targets described m the previous paragraph, appeared to be reasonable
It was recognised at the same time that the whole problem of industrial exports should be given much fuller study CTT have been projecting the exports to 1970 of a large number of industrial products using methods which were different from those used by the Department of Finance Recent discussions with CTT indicated that there was in general a close correspondence between their projections and those of the Depaitment of Finance These export projections are being used as a guide in preparing detailed profiles for each industry for 1970, which will be used as a basis for discussion with individual industries
IV PROJECTIONS OF SECTORAL EMPLOYMENT AND PRODUCTIVITY
Table 1 illustrated the range of possible combinations of growth rates in employment and in productivity per head, each of which was consistent with particular assumptions about the growth rate in GNP, emigration and unemployment Table III gave a sample of the range of possible sets
6 See, for example, Jan Tmbergen, The Design of Development, pp 67-8 "As far as programming is concerned, the experience so far has been that there is a tendency for statisticians engaged in this type of work to underestimate the changes that actually take place Qualitatively this is connected with the continuous occurrence of new factors, mostly technical, but also political or psychological Quantitatively it may be illustrated by the fact that the average rates of changes predicted to actual changes was 70 per cent for the Netherlands (and as low as 55 per cent for Scandmavian programmes) as far as annual official programming is concerned" The Economic Research Institute has had a similar experience with its short-term forecasts and when more experience has been gained, it plans to build in an "optimism factor"
of sectoial growth lates consistent with a particular assumption about the overall growth rate of GNP For any combination of a row from a table such as Table I with a column from a table such as Table III, there will be a very large number of changes in sectoral employments and product-ivities which will be consistent with it Some of these possible sets of changes in sectoral employment and productivity are shown in Tables IV, V and VI The employment figures which are shown for 1960 are the revised figures which became available in the early part of 1964 Since Tables IV, V and VI are intended merely to illustrate the method used, they have been simplified by the assumption of a given employment in-crease in the other domestic sector
The next step was to attempt to narrow the range of possibilities as set out in tables similar to Table IV-VI By this stage, as a result of the work described in the previous section and other work which is described later in this paper, growth rates for sectoral outputs which were very close to those subsequently published in the second programme were beginning to emerge In exploring how these increases in sectoral outputs might be generated—that is, the relative contributions of increases in employment and increases m output per person engaged—a few relatively simple guide lines were followed First, in the light of past experience both of Ireland and other countries, it was expected that the smallest increases in productivity were likely to be achieved in the other domestic sector This expectation is largely explained by the inherent characteristics of many service activities—e g the reliance on personal service, the difficulties in the way of mechanisation, etc Second, one aim of policy should be to narrow the gap between income per head in agriculture and in other activities and this required a rather faster rate of rise in output per person m agriculture than in the industry or other domestic sectors Third, changes in sectoral employment and productivity during the 1950s were examined, but because many special factors were at work great care had to be taken in using this experience as a basis for future projections
Despite all these difficulties, an attempt was made to separate the relative contributions of employment and productivity to growth in each sector, but it must be recognised that these estimates were based rather more on "feel" than on objective data As a result, the employment estimates m their detailed breakdown cannot be accorded the same degree of firmness as the estimates of output (described above) and of expenditure (see below)
V PROJECTIONS OF EXPENDITURE
In projecting expenditures, the simplest possible analytical framework was used In any year Y=C+I+G+X—M where
Y= Gross national product at market prices,
C=Personal expenditure on consumers' goods and services,
/ = Gross domestic capital formation,
G=Net expenditure by public authorities on current goods and services,
X= Receipts from the sale of goods and services to the rest of the
world,
M=Purchases of goods and services from the rest of the world,
so that
X—M=Net expenditure by the rest of the world,
—1 e , the balance of payments on current account
Given any overall growth target, the GNP in 1970 can be calculated, given its level in the base year 1960 If m addition any four of the items on the right-hand side of the above equation are estimated, the fifth can be determined residually In the attempt to estimate expenditures, exports
(X) were treated as the residual (for reasons indicated later) and the other
four heads of expenditure—namely, personal consumption, gioss invest-ment, public consumption and imports—were independently estimated
VI PROJECTIONS OF PUBLIC CONSUMPTION
In each of the years 1953-60, public consumption constituted between 10% and 11% of the real GNP The relationship between public con-sumption and GNP m the major OECD countries m the recent past and m the projections of these countries for the 1960s was studied One thing was clear, however—the ratio of G to GNP for Ireland was lower than that in any of the countries covered (save in the case of Italy for 1950-55) It must be remembered, however, that defence expenditure is relatively more important in these countries than in Ireland
development of policy, it was expected that an average mciease of 5 5% p a m public consumption would be required This meant that by 1970 public consumption expenditure would constitute 12% of the GNP as compared with 10 3% in 1960
VII PROJECTIONS OF GROSS INVESTMENT
Gross domestic capital formation has two components gross domestic fixed capital formation and the value of physical changes m stocks The values of these in 1960 were £88 0m and £10 4m respectively, representing 13 1 % and 1 5% of the 1960 GNP There probably exists some "normal" relationship between the level of stocks of materials etc and the level of national output—a relationship which is determined by the technical requirements of a given rate of output The physical changes in stocks between one year and the next is in part the result of an attempt to achieve or restore this "normal" relationship The dominant influences on stock changes, however, appear to be short term and largely unrelated to the current behaviour of non-agricultural output for example, between 1953 and 1961, stock changes varied from —1 07% of the real GNP m 1954 to + 3 89% m 1959 There are great difficulties m the way of predicting stock changes between 1969 and 1970 though there can be little doubt that the volume of stocks will rise m line with GNP Stock changes in 1970 were assumed to be zero and attention was concentrated on gross fixed capital formation 8
Various methods were used to estimate the rate of gross investment which would be required to achieve different rates of growth m GNP First, a crude attempt was made to project the growth of the mam com-ponents of gross fixed capital formation on the basis of experience m the 1950s This exercise suggested a ratio of gross investment to GNP m 1970 of almost 17 % Second, m theory one can posit a relationship between gross investment m any year and the increase in GNP m that year The gross incremental capital-output ratio (ICOR) is equal to the gross investment divided by the change in GNP If the gross ICOR were known, then the gross investment required to generate any particular rate of increase in GNP could be calculated by simple arithmetic Unfortunately, there appears to be relatively little stability in the gross ICORs either through time for each economy, or as between different industries m the same economy or the same industry m different economies This is to be expected if only because the investments which are made in any year differ m their productivity or "quality" and in their life span This second approach yielded relatively little of value It may be noted that a gross investment ratio of 18 % for 1970 and an overall growth rate of 4 2 % p a implies a gross ICOR of almost 4 5—I e , that almost £450 of gross in-vestment would be required to generate an increase of £100 in GNP Third, average capital output ratios for individual German industries in
the 1950s were applied for the 1960s to Irish industries of the same clas-sification The methodology was defensible but not the identification of, e g , the Irish metals and engineering industry with its German counter-part This exercise, for what it was worth, suggested a gross investment ratio in excess of 20 % Fourth, the relationships between gross domestic fixed capital formation and GNP, and between the rate of growth in gross domestic fixed capital formation and the rate of growth m GNP, m the major OECD countries were examined In virtually all these countries both for the 1950s and in the projections for the 1960s the rate of increase in gross fixed investment was higher than the growth rate m GNP These relationships provided a rough framework for thinking about the Irish projections Fifth, a recent study of the productivity of management consultants9 and a similar study by the Department of Industry and Commerce which related to Irish experience, were used as the basis for a (necessarily) rough estimate of the increases in output that might be achieved by organisational changes (as opposed to investment in fixed capital)
Each of these studies contributed something to the final choice of a rate of growth in gross investment during 1960-70 which would raise the gross investment ratio from 144%(13 1%if stock changes are excluded) of GNP in 1960 to over 18 % of a GNP (which was 50% larger) in 1970 In addition, this final choice took account of the role which policy might play in determining the composition of gross investment, and especially of the State capital programme The results obtained from the Economic Research Institute's Tnput-Output decision model (see below) when a gross investment ratio of 18% was used seemed to confirm that this ratio was reasonably realistic
VI LI PROJECTIONS OF PRIVATE CONSUMPTION
During the 1950s, real personal consumption was 75% of the real GNP The deviations from the average were relatively small, the per-centage ranged from 73 4 in 1957 to 77 03 in 1958 Both these were years, however, when rather special influences were at work The relationships between the rate of growth m real personal consumption and real GNP in the five major OECD countries were also studied for 1950-55 and 1955-60 No clear pattern emerged from the study of these relationships This, perhaps, was only to be expected because changes in GNP were only one of the forces at work on consumption during the years which were covered
The choice of a growth rate for personal consumption was made only at a relatively late stage The justification for doing so was that the behaviour of personal consumption can, within certain limits, be in-fluenced by policy Most of the work was carried out using a number of 9 J Johnston, "The Productivity of Management Consultants' , Journal of the
Royal Statistical Society, Vol 126, Part 2, 1963, pp 237-249
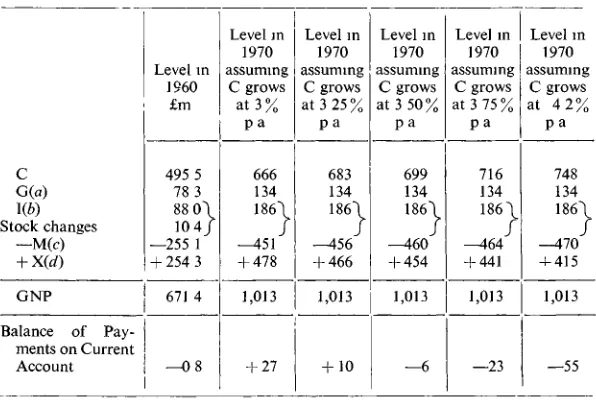
different assumptions about personal consumption The effects of a range of these assumptions is summarised in Table Vll The Table shows that on any given set of assumptions about public consumption and gross investment and about the relationship between imports and the other main heads of expenditure, the balance of payments deficit will be the greater the faster is the rate of increase in personal consumption The choice of a consumption growth rate was made later at the same time as the values for growth rates in related variables were chosen
IX PROJECTIONS OF IMPORTS
There are five main categories of imports materials for further pro-duction in agriculture and industry (Ml), consumption goods ready for use (M2), producers' capital goods ready for use (M3), unclassified commodity imports (M4), and other current items, consisting of the gross outflow of dividends and profits, tourist expenditure abroad and "other current" In the earlier stages of the exercise, assumptions were made on the basis of past experience modified to allow for the freeing of trade Ml imports were assumed to rise at the same rate as agricultural and industrial outputs, it was also assumed that M2 imports would rise at twice the rate of increase of personal consumption, that M3 imports would vary directly with the level of gross investment in plant and mach-inery and that M4 and M5 impoits would rise twice as fast as GNP The application of these assumptions to the various assumptions about growth rates in agricultural and industrial outputs, personal consumption, gross investment and GNP gave wide variations in the ratio of total imports to GNP Final decisions were made quite early in the work about M5—1 e invisible imports These gave a total of £69 8 million for 1970 as compared with £36 8 million for 1960
Jn the Spring of 1963 Dr Leser's detailed study on imports and economic growth during 1947-61 became available He concluded that "a state of affairs in which total imports amounted to about £43 for every £100 of gross national product would not be difficult to envisage" The Depart-ment of Finance thought that this conclusion rather underestimated the effects of the freeing of trade By this time the target growth rates in GNP, public consumption, gross investment, personal consumption and agri-cultural and industrial outputs were emerging, and the initial assumptions about the different categories of imports (see previous paragraph) were modified marginally so as to give a ratio of total imports to GNP in 1970 of almost 46 % 10 The difficulties m the way of estimating the behaviour of imports, especially during a period in which the degree of protection will be reduced, are very great The changes in the relative competitiveness of Irish goods and the reactions of households and business firms to the easier availability of imported goods mean that past relationships are not necessarily a good guide for the future
X PROJECTIONS OF EXPORTS
abroad and extern profits etc (XI), emigrants' remittances and legacies (X2), pensions and allowances (X3), commission earnings of import agents (X4), receipts from tourism, travel, etc (X5), other known current items (X6) and balance unaccounted for (X7) The probable behaviour of XI was discussed above m Section III m relation to the behaviour of net foreign income The assumption which was finally made was that this item would use from £30 8 million ±n 1960 to £35 8 million in 1970 The employment assumptions which were ultimately made envisaged a declining level of emigration during the 1960s Since emigrants' remittances m any year are related to the current and recent rates of emigration, it was finally assumed that X2 would fall from £13 3 million in 1960 to £10 million m 1970 It was assumed that X3 would be the same in 1970 as m 1960 I e , the implicit assumption was that the death of war pensioners would be just offset by the immigration of new pensioners or of persons in receipt of external social welfare payments The items X4 might be expected to move in step with imports it was finally assumed that it would double during 1960-70 The behaviour of the receipts from tourism and travel during the 1950s were broken down into three components receipts from tourism proper, visits to relatives, business, etc and the adjustment for transport costs Assumptions were made about the probable behaviour of each component during the 1960s and these gave a total of £84 8 million for 1970 as compared with £42 4 million in 1960 It was assumed that X6 and X7 would almost double during that period this assumption was based mainly on a crude projection of past experience These final assumptions gave a total for invisible exports of £163 5 million for 1970 as compared with £109 6 million m 1960 Given this figure for invisible exports the required level of visible exports was calculated as a residual
The required rate of visible exports as determined residually in the manner described above was cross-checked by an independent estimate of visible exports (see Section III above) The justification of using the residual method is that Irish exports (with the exception of live animals) constitute only a very small fraction of the total imports of the markets to which they are consigned In these circumstances the rate of growth in the markets to which our products are exported cannot be regarded as the only significant factor in determining the level of exports Other in-fluences, such as decisions by more Irish enterprises to seek export markets and policies to improve their competitiveness and promote exports, are much more important in their effects If our exports had constituted a significant proportion of foreign imports, then some attempt would have had to be made to relate the expected growth rates in external markets to Irish exports, as was done for France in the preparation of the Fourth Plan
XI THE FORMAL MODEL
allocation of output between sectors or m the assumptions about relation-ships such as income elasticities of demand) can have a significant effect on the results, and this is the more serious because such errors cannot generally be located and measured, second, the precision of the methods of the formal model are in marked contrast with the indeterminate character of much of the material to which the model must be applied u The iterative method which has been described above, however, suffers from one serious drawback, namely, it is impossible to be sure that the various conclusions which it yields are consistent with each other It is therefore desirable that both methods be used and their results continuous-ly cross-checked
Early in February 1962 the Department of Finance requested the Economic Research Institute to indicate the economic implications of assumed growth rates of 3%, 5% and 7% p a for the period 1962 to 1970 The first task facing the Institute was the very laborious one ol constructing a macro-economic model of the Irish economy
By the early summer of 1962 a number of important papers were being sent by the Institute to the Department of Finance which were of con-siderable help in the elaboration of the iterative method These papers were Dr Geary's papers on "A Simple Macro-Economic Growth Model", Dr Leser's papers entitled
"Trends in the Irish Consumption Pattern", "Economic Growth and Manpower",
"Some Observations on Irish Economic Structure and Growth", "A Further Note on Economic Growth and Manpower",
and Mr J McGilvray's paper "Projection of the Irish Economy to 1965" Dr Geary's paper on "An Experimental Input-Output Decision Model for Ireland" became available in November 1962 This model was based on 1956 data but was later modified by the inclusion of the inter-industry matrix for 1960 This model was designed to show m fairly considerable industrial detail the economic pattern m 1970 on the assumption of different rates of increase m GNP The model required that predetermined values be given to five of the variables, and any five could be selected as instrumental variables from the whole range of variables in the system Values were taken for the five instrumental variables from the stage then reached in the development of the iterative method withm the Department of Finance The model was then programmed for the Agricultural In-stitute computer The solution of the model yielded a large number of possible profiles for the economy m 1970 One of these12 accorded most closely with what were deemed to be the most realistic set of assumptions about the development of the economy to 1970, and this one was chosen as the basis for further work It was modified in a number of respects (e g the import ratio and the gross investment ratio were raised and the target growth rate was applied to the GNP rather than to the GDP)
The detailed projections of industrial output (see section III above) were then converted into the form appropriate for mput-output analysis and fed into the model This stage of the exercise can be regarded as an attempt to use the model to derive the assumptions about the behaviour of technical coefficients which were implicit in the work of the Department of Finance The model confirmed that the assumed target outputs for agncultuie, forestry and fishing, food, drink and tobacco and textiles and apparel were realistic, but showed that significant changes were being assumed in the technical coefficients for metals and engineering and m the sector "all other manufacturing industry" The required changes, for example in the ratio of gross to net output m these latter sectors, were neither impossible nor even improbable, bearing in mind the inflow of new industry, much of it of a kind which is different from that of the industry already established in the metals, engineering and all other manufacturing sectors The next stage will be to feed into the model the detail export projections for 1970 when the discussions which are now proceeding with individual industries have been completed
Much less space has been devoted to the role of the formal model m the preparation of the second programme than was given to the description of the iterative method, because Dr Geary, the Director of the Economic Research Institute, read a paper on this subject to the Statistical and Social Inquiry Society in January 1964
XII CONCLUSIONS
TABLE I
SETS OF "POSSIBLE" CHANGES I N EMPLOYMENT, PRODUCTIVITY AND LEVELS OF EMIGRATION 1960-70
Possibilities 1 2 3 4 5 6 7 8 9
Annual average percentage change 1960-70 in
Total employment (1) 0 0 25 0 50 0 75 1 00 1 25 1 50 1 75 2 00 Per capita productivity (2) 4 2 3 95 3 70 3 45 3 20 2 95 2 70 2 45 2 20 Percentage increase in total employment 1970 as compared with 1960 (3) 0 2 52 511 7 76 10 46 13 23 16 05 18 94 21 90 Increase in employment 1960-70 (Number) (4) 0 26,586 53,910 81,868 110,353 139,576 169,327 199,817 231,045 Total employment in 1970 (to nearest '000) (5) 1,055,000 1,082,000 1,109,000 1,137,000 1,165,000 1,195,000 1,224,000 1,255,000 1,286,000 Total net emigration 1960-70 (6) 264,000 237,000 210,000 182,000 154,000 124,000 95,000 64,000 33,000 Annual average net emigration 1960-70 (7) 26,400 23,700 21,000 18,200 15,400 12,400 9,500 6,400 3,300
Note In any year, the percentage increase in employment and the percentage increase in per capita productivity add up approximately to the
TABLE II
"GROSS" SECTORAL PRODUCTS AT FACTOR COST
Note The figures in the final column are the bases for the calculations of alternative
sets of sectoral growth rates in Table III
Sector
Agriculture, forestry and fishing Industry
Other domestic Net foreign income
Net NP at factor cost Depreciation
GNP at factor cost Indirect taxes less subsidies
GNP at Market Prices
Net Sectoral product at factor cost
1960 £m
133 2 154 3 226 2 33 7
547 4 37 9
585 3 861
6714
Depreciation
63 134 182
37 9
"Gross" sec-toral products
at factor cost 1960
139 5 167 7 244 4 33 7
585 3 861
EXAMPLES OF ALTERNATIVE SETS OF SECTORAL GROWTH RATES CONSISTENT WITH A 51(
MARKET PRICES 1960-70
i GROWTH IN REAL GNP AT
Possibilities Sector Agriculture, etc Industry Other domestic Net foreign
GNP at factor cost Indirect tax less subsidies
GNP at market prices
Assumptions 0 50% p a increase in Employment 1960-70 and total employment in 1970 of 1,109,000
Increases in GSP agriculture 1 5 % p a , industry 6 63 % p a , and other domestic 4 2 % p a Increase in GNP 4 2% p a
Sector Agriculture Industry Other domestic TOTAL Empl o-ment in I960 000s 390 248 417 1 055 (a) Annual average % change in
Employ ment 0 (0) —1 60 (—14 92) 2 00 (21 90) Produc tivity
+ 1 5 (+16 05)
+ 8 36 (+123 20) 2 2 (24 3) Employ-ment in 1970 000s 390 211 508 1 109 (b) Annual average % change in
Employ ment
— 1 0 (—9 6) 00 (+0 0) 2 00 (21 90) Produc tivity +2 5 (+28 01)
+ 6 63 ( + 90 02)
22 (24 3) Employ ment in 1970 000s 353 248 508 1 109 (c) Annual average % change in
Employ ment
— 1 5 (—14 0)
+0 70 ( + 7 26)
2 00 (21 90) Produc tivity + 30 (+34 39)
+ 5 89 (+77 23) 2 2 (24 3) Employ ment in 1970 000s 335 266 508 1 109 (d) Annual average % change in
Employ ment
— 2 0
(-18 3)
+ 1 29 (+1371)
2 00 (21 90)
Produc-tivity
+ 3 6 ( + 42 43)
+ 5 27 ( + 67 13)
22 (24 3) Employ ment in 1970 000s 319 282 508 1 109 (e) Annual average % change in
Employ-ment
—25 (—22 4)
+ 1 85 (+20 16)
2 00 (21 90)
Produc-tivity
+ 4 1 (+49 45)
+4 69 ( + 58 14)
2 2 (24 3) Employ-ment in 1970 000s 303 298 508 1 109
Assumptions 0 50% p a increase in Employment 1960-70 and total employment tn 1970 of 1,109,000
Increases in GSP agriculture 2 0% p a , industry 6 35 % p a and other domestic 4 2% p a Increase in GNP 4 2 % p a
Sector Agriculture Industry Other domestic TOTAL Employ ment in I960 000s 390 248 417 1 055 (a) Annual average % change in
Employ ment
0 (0)
— 1 60 (—14 92) 2 00 (21 90) Produc-tivity + 20 ( + 21 9)
8 08 ( + N 7 50)
2 2 (24 3)
Employ ment i n
1970 000s 390 21 1 508 1 109 (b) Annual average °/o change in
Employ ment
— 1 0 (—9 6) 00 (0 0) 2 00 (21 90) Produc tivity
+ 3 0 ( + 34 39)
6 35 ( + 85 09)
2 2 (24 3) Employ-ment in 1970 000s 353 248 508 1 109 (c) Annual average % change in
Employ ment
— 1 5 (—14 0)
+ 0 70 ( + 7 26)
2 00 (21 90)
Produc tivity
+ 3 6 ( + 42 43)
+ 561 (+72 60) 2 2 (24 3) Employ ment in 1970 000s 335 266 508 1 109 (d) Annual average % change in
Employ ment
— 2 0 (—18 3)
+ 1 29 (+1371)
2 00 (21 90)
Produc-tivity
+ 4 1 (+49 45)
5 00 ( + 62 89)
2 2 (24 3) Employ-ment in 1970 000s 319 282 508 1 109 (e) Annual average % change in
Employ ment
—25 (—22 4)
+ 1 85 ( + 20 16)
2 00 (21 90)
Produc tivity
+ 4 6 ( + 56 79)
+ 4 42 ( + 54 II)
2 2 (24 3) Employ ment in 1970 000s 303 298 508 1 109
Assumptions 1 00% p a increase in employment 1960-70 and total employment in 1970 of 1,165,000
Increases in GSP agriculture 1 5 % p a , industry 6 63 % p a , and other domestic 4 2 % p a Increase in GNP 4 2 % p a
Sector Agriculture Industry Other domestic TOTAL Employ ment in I960 000s 390 248 417 1 055 (a) Annual average % change in
Employ-ment 0 (0) +0 74 (+7 66) 2 00 (21 90) Produc tivity
+ 1 5 (+16 05)
+ 5 85 (+76 57) 2 2 (24 3^ Employ ment in 1970 000s 390 267 508 1 165 (b) Annual average % change in
Employ-ment
— 1 0 (—9 6)
+2 06 ( + 22 58)
2 00 (21 90)
Produc tivity
+ 2 5 (+2801)
+ 4 48 ( + 55 00)
22 (24 3) Employ-ment in 1970 000s 353 304 508 1 165 (c) Annua average % change in
Employ ment
— 1 5 (—14 0)
+ 2 65 ( + 29 84)
2 00 (21 90)
Produc tivity
+ 3 0 (+34 39)
+ 3 88 (+46 33) 2 2 (24 3) Employ ment in 1970 000s 335 322 508 1 165 id) Annual average % change in
Employ-ment
— 2 0 (—18 3)
+ 3 14 ( + 36 29)
2 00 (21 90) Produc tivity + 36 (+42 43)
+ 3 38 ( + 39 43)
22 (24 3) Employ-ment in 1970 000s 319 338 508 1 165 (e) Annual average % change in
Employ ment
—25 (-22 4)
+ 3 62 (+42 74)
2 00 (2190)
Produc-tivity
+ 4 1 ( + 49 45)
+ 2 90 ( + 33 09)
2 2 (24 3) Employ ment in 1970 000s 303 354 508 1 165
TABLE VII
EFFECTS OF DIFFERENT ASSUMPTIONS ABOUT GROWTH OF C GIVEN CERTAIN ASSUMPTIONS ABOUT EACH OF THE OTHER ITEMS
(For these, see notes below)
c
G(a) Kb) Stock changes —M(c) + X(d) GNPBalance of Pay-ments on Current Account Level in 1960 £m 495 5 78 3 88 0 \ 104/
—255 1 + 254 3
671 4 —08 Level in 1970 assuming C grows at 3 %
P a
666 134 186\ / —451 + 478 1,013 + 27 Level in 1970 assuming C grows at 3 25 %
p a 683 134 186\ / —456 + 466 1,013 + 10 Level in 1970 assuming C grows at 3 50%
p a 699 134 186\ —460 + 454 1,013 —6 Level in 1970 assuming C grows at 3 75%
p a 716 134 186\ —464 + 441 1,013 —23 Level in 1970 assuming C grows at 4 2 %
p a 748 134 186\ / -^70 -4-415 1,013 —55
Notes (a) It is assumed that G is 13 2% of GNP in 1970 (b) A gross investment ratio of 18 4 % is assumed for 1970
(c) For Ml sectoral growth rates in agriculture of 2 % p a and in industry
of 6 35 % p a are assumed
M2 depends on the assumption made about C M3 is determined by the investment ratio of 18 4 %
M4 and M5 are calculated on one assumption only and are £21 0m and £73 6m respectively
(d) X —"required" rate of exports
DISCUSSION
Dr C E V Leser I have great pleasure in seconding the vote of thanks
to Professor Ryan for his paper The importance of the subject with which it deals is obvious and evidenced by the large attendance at this meeting We must be grateful not only for a fascinating account of what goes on behind the scenes, but also for showing that academic economists do not all live in ivory towers and can deal with practical problems
I have few criticisms to make beyond the criticism made by the speaker himself, namely that the method may lead to inconsistencies This indeed seems a serious matter to me, more serious than wrong results All fore-casting leads to errors of one kind or another, but one can ensure that the results are consistent with each other and with the assumptions
sector will grow less fast than the economy as a whole The general im-pression is a shift towards services with increasing national income Between 1953 and 1962, the share of this sector increased from 38% to 42 % of the national income Admittedly this is at current prices, but one would expect the output of the services sector in constant prices to grow at least at the same rate as the average of the other sectors
I agree that the behaviour of imports presents difficult problems However, the implication of the assumptions seems to be that consumption goods imports will rise faster than imports of materials This is in contrast to recently-observed trends, between 1947 and 1962 the value of imports of consumer goods increased from £40 million to £56 million, by about 40%, but imports of materials rose from £75 million to £169 million, a more than 100% increase One would expect this tendency to continue with increasing industrialisation of the country
I feel there is too little emphasis on the role of final demand, particulaily with regard to exports Whilst it is true that Ireland may well increase its share in overseas markets, this will undoubtedly be easier m expanding than in stagnant or shrinking markets
The drawbacks of the formal model seem to be somewhat overstated Precision of mathematical methods with imprecise data is a fault only if too much precision is claimed for the results Tt is not clear in which sense one can say that errors in the model cannot be located and measured, it is always possible to modify the assumptions if the results appear un-realistic
An input-output model does not necessarily assume constant technical coefficients Dr Geary has shown how variations in these coefficients may affect trie results If che iteiative method is used, then it seems important to ascertain the assumed changes in technical coefficients which are implied If this is done, then there is no fundamental difference between the two methods
At one time there was a controversy between economists as to whether the deductive or the inductive method was appropriate in economics, now we are quite happy m using both In the same way, there is no need to argue whether to use input-output analysis or judgment, both have their rightful place
With these observations, I should like to second the vote of thanks to Professor Ryan
Mr G FitzGerald, having congratulated Dr Ryan on his paper and
considering the targets, but he pointed out that this was not clarified either in the paper, or indeed in the Second Programme itself
Mr FitzGerald asked at what point the final decision on a 4 14% growth rate for national output was taken, adding that he was not quite clear from the paper whether this was the result of a preliminary study If it were the result of such a preliminary study, was it simply a coincidence that the output targets eventually added up to this, as there was nothing in the paper to suggest that any individual component was a residual, although the range of 3-4% suggested for the growth rate for the other domestic sector might perhaps indicate that it, in fact, was a residual He stressed the importance of clarifying this question of the basic growth rate for output, which had unfortunately become a subject of controversy as a result of suggestions that it was no more than a transposition of the OECD growth target to Irish conditions
Mr FitzGerald asked why, in the paper, allowance was made for the built-in pessimism of the economist in relation to the industrial targets, and not in relation to the agricultural targets, which appeared to have been taken more or less without question from the Department of Agri-culture, in contrast to the targets for other sectors, which were devised in the Department of Finance itself He also enquired what provision was made for the growth of that sector of industry not covered by Census of Industrial Production, employment in which appeared to have declined sharply between the 1951 and 1961 Censuses
He also asked whether the proposed investment ratio of 18% might not be too low, in view of the fact that it had almost been attained already, after only three years of the decade had elapsed He sought clarification of the export forecast and, in particular, of the reference to "industrial exports" in the Programme itself If this reference was to manufactures only, then the 150% growth target for these industrial exports was almost certainly too low, as it now appeared likely that an increase of almost two-thirds in these exports would have been achieved by the end of 1964, before the bulk of the new grant-aided industries had come into production The interim report of NIEC had indicated that one-third of the increase in industrial output during the Second Programme would be contributed by these new industries, 90-100% of whose production would, in almost all cases, be for export—which, by itself, should be almost sufficient to achieve the target increase in industrial exports, even if established in-dustries did not increase their exports at all He added that the estimated increase in imports might also turn out to be too low, and he challenged the assumption that the rate of growth of imports of materials for further production would be the same as the rate of growth of output, in view of the high degree of protection at present afforded to intermediate products, and the evident desire of manufacturers of final products to substitute imported materials rather than home-produced ones
of genuine tourism This represented a rate of growth of genuine tourism? which had certainly not been attained in the early 1960s, and which might involve massive investment in hotels, etc
Mr FitzGerald also suggested that the incorporation in the Programme of some broad conclusion as regards the trend of population might have been helpful in connection with the consultations, currently proceeding on the basis of the outline Programme, and he added that many of the criticisms of the methodology and assumptions of the outline Second Programme should be seen in the context of the fact that the outline Programme was intended only as a basis for consultations, out of which would emerge a more firmly-based picture, whose consistency could then again be checked by reference to the Economic Research Institute model
Mr A Tait At the end of Section VIII, "Projections of Private