Original Article
Identification of potential genes and microRNAs
related to recurrence risk of osteosarcoma
by miRNA and mRNA integrated analysis
Song Luo1*, Zhaoyang Deng2*, Wenzhi Bi1, Yun Wang3, Meng Xu1, Yan Wang1
Departments of 1Orthopaedics, 3Pathology, General Hospital of Chinese People’s Liberation Army, Beijing
100853, China; 2Clinical Department of Surgery, General Hospital of Chinese People’s Liberation Army, Beijing
100853, China. *Equal contributors.
Received November 12, 2016; Accepted December 30, 2016; Epub March 15, 2017; Published March 30, 2017
Abstract: Objective: This study aimed to identify potential risk genes and microRNAs (miRNAs) related to the recur-rence risk of osteosarcoma (OS) using support vector machine (SVM) algorithm. Methods: Based on the mRNA
expression profiling dataset GSE39055 and the miRNA expression profiling dataset GSE39040, differentially ex
-pressed genes (DEGs) and differentially ex-pressed miRNAs (DE-miRNAs) indiagnostic biopsy specimens between OS patients with and without recurrence were identified. Subsequently, an integrated network of DE-miRNAs and DEGs was constructed, and the modules were identified from the network. Afterwards, the significant genes and miRNAs in the modules were identified using the neighborhood scoring algorithm. Additionally, SVM was used to establish a prediction model of recurrence risk. Another independent mRNA expression profiling dataset GSE39057 and the miRNA expression profiling dataset GSE39052 were used to evaluate the efficiency of the prediction model. Results: In total, 1118 DEGs and 63 DE-miRNAs were identified between the recurrence group and non-recurrence group. Eleven modules were identified from the integrated network. Genes and miRNAs in the modules 1, 5, 6 and 10 were predicted to be significantly associated with the survival time of OS patients. Based on the neighborhood
scoring algorithm, 14 genes belonging to the four network modules with a higher score were used to establish the
prediction model. Finally, five feature genes in the prediction model were identified, including NUDT21, PPP2R5A,
PLK4, RPS9 and MX1. The total precision of the model was 81%. Conclusion: The genes in the prediction model were new-found to be potentially associated with the recurrence risk of OS.
Keywords: Osteosarcoma, gene, microRNA, support vector machine, network
Introduction
Osteosarcoma (OS), the most frequent primary malignancy of bone, is defined by the presence
of malignant mesenchymal cells which produce osteoid and/or immature bone [1]. The annual incidence of OS in the general population is 2- 3 million, while it peaks at 8-11 million in ado-lescence [2]. OS accounts for 15% of all solid extracranial cancers in 15-19 years of age [3]. Specially, despite current therapeutic strate-gies, including surgery, adjuvant chemotherapy and radiotherapy, the prognosis of OS patients is still poor, since about 80% of patients even-tually develop recurrent metastatic OS follow-ing surgical treatment, which greatly reduces the survival rate of patients [4, 5]. Therefore, it is imperative to reveal the molecular
mecha-some molecular methods that can predict the recurrence risk in OS.
In the past years, remarkable achievements have been made in the study on the molecular mechanisms associated with the recurrence in OS. For instance, APEX1 gene was found to be
amplified in osteosarcomas and its expression
was an independent predictor of the osteosar-coma local recurrence and/or metastasis [6]. High expression of the membrane-cytoskeleton linker EZRIN (ezrin) in primary tumors is asso-
ciated with a significantly shorter disease-free
interval and higher risk of recurrence in pediat-ric OS patients [7]. Furthermore, the combined miR-183 downregulation and ezrin upregulation
was previously discovered to be significantly
recur-also demonstrated to be significantly associat -ed with tumor recurrence, metastasis and poor prognosis in OS patients [9]. Additionally, the combination of low miR-223 expression and
high epithelial cell transforming sequence 2
(Ect2) expression (miR-223-low/Ect2-high) is
significantly correlated with positive metasta -sis and recurrence of OS [10]. However, more genes and miRNAs that are involved in the recurrence of OS have not been found.
Support vector machine (SVM) is a novel machine learning method based on statistical learning theory, and it has been used to select genes for disease diagnosis [11], survival pre-diction [12], pathologic grade prepre-diction [13]
and classification of cancer types [14].
Never-theless, SVM has not been used to identify genes and miRNAs for the prediction of recur-rence risk of OS. In this study, in order to iden-tify gene/miRNA signature that is able to clas-sify OS patients with recurrence and non-recur-rence risk, we utilized SVM to identify genes and miRNAs associated with the recurrence risk of OS based on the mRNA and miRNA ex-
pression profiling. The results were expected
to enrich the information of molecular mecha-nisms underlying the recurrence of OS, and provide potential novel genes and miRNAs for the prediction of recurrence risk of OS.
Materials and methods
Data acquisition and preprocessing
Two mRNA expression profiling datasets (GS-E39055 [15] and GSE39057 [15]), and two miRNA expression profiling datasets (GSE39-040 [15] and GSE39052 [15]) were download
-ed from the Gene Expression Omnibus (GEO,
http://www.ncbi.nlm.nih.gov/geo/). GSE39055 and GSE39040 were used as training sets for mRNA and miRNA, respectively. GSE39057 and GSE39052 were used as test sets for
mRNA and miRNA, respectively. A total of 37
unique diagnostic biopsy specimens from OS patients were included in GSE39055, 5 unique
pairs of OS diagnostic biopsy and surgical re-
section specimens in GSE39057. The mRNA
expression data in these two datasets were
produced by the platform of GPL14951 (Illumi-na HumanHT-12 WG-DASL V4.0 R2 expression beadchip). Furthermore, 65 unique diagnostic
biopsy specimens from OS patients were in-
cluded in GSE39040, 26 unique pairs of OS biopsy and surgical resection specimens in
GS-E39052. The miRNA expression data in these two datasets were produced by the platform
of GPL15762 (Illumina Human v2 MicroRNA
Expression BeadChip).
The downloaded raw gene expression data
in TXT files were preprocessed. Probes were
transformed into the corresponding gene sym-bols based on the annotation information of the platforms. If one probe corresponded to multiple genes, the expression value of this probe would be removed. On the contrary, the
mean expression value was defined as the final expression value of the gene if multiple
probes corresponded to one given gene. After- wards, the data were normalized by the me- dian standardization method.
Identification of differentially expressed genes (DEGs) and differentially expressed miRNAs (DE-miRNAs)
According to the recurrence information, the OS patients were divided into recurrence group and non-recurrence group. Based on the
mRNA and miRNA expression data, DEGs and
DE-miRNAs between the two groups were
iden-tified using limma package [16]. P-value and log2FC (fold change) of each gene was tested by t-test. Only the genes and/or miRNAs with |log2FC|>1 and P-value <0.05 were identified as DEGs and/or DE-miRNAs.
Construction of an integrated network of DE-miRNAs and DEGs
Firstly, the regulatory relationships between
DE-miRNAs and DEGs were identified. Briefly,
the data of regulatory relationships between miRNAs and mRNAs were downloaded from the microRNAorg (http://www.microrna.org/), PITA (http://genie.weizmann.ac.il/pubs/mir07/ mir07_data.html) and TargetScan (http://www. targetscan.org/) databases. The intersection regulatory relationships in the three databases were used to match and identify the regulatory
relationships between DE-miRNAs and DEGs.
Meanwhile, the protein-protein interactions
(PPIs) of the above identified DEGs were sear-ched in the STRING database (http://string-db.
org/), which contained information of numer-ous human PPIs. Furthermore, the co-expres-sion relationships of DE-miRNAs were also
Afterwards, the identified PPIs of DEGs and the
regulatory relationships between DE-miRNAs
and DEGs were used to construct an
integra-ted network, which consisintegra-ted of DE-miRNAs
and DEGs, as well as the PPIs and regulatory
relationships. The MCODE plug-in of the Cyto- scape software (available at http://baderlab. org/Software/MCODE) detects densely con-nected regions in large protein-protein interac-tion networks that may represent molecular complexes [17]. Here, the topology modules in
the network were identified using MCODE. The
parameters were set as follows: Degree Cutoff =3, Node Score Cutoff =0.2, Haircut = true, Fluff = false, K-Core =2, and Max. Depth from Seed =100.
Functional enrichment analysis of genes in the topology modules
Gene Ontology (GO) functional and KEGG (Kyoto Encyclopedia of Genes and Genomes) path-way enrichment analyses of the DEGs in the
topology modules were performed using the online tool DAVID (the Database for Annotation, Visualization and Integrated Discovery, https:// david.ncifcrf.gov/). The P-value of each GO or
pathway term was calculated by the Fisher’s
exact test. Only the GO terms and KEGG path -ways with P-value <0.05 were considered
sig-nificant. The calculation formula is as follows:
m 1 i 0
P 1
Nn M
i N Mn i = -=
^
^
^
h
h
h
/where N is the total number of genes
(non-DEGs and (non-DEGs) enriched in all GO terms or
pathways; n is the number of DEGs enriched in all GO terms or pathways; M is the number of
genes (non-DEGs and DEGs) in a certain GO
term or pathway; and m is the number of DEGs in a certain GO term or pathway.
Prediction of the recurrence-related DEGs and DE-miRNAs
The neighborhood scoring algorithm was used
to identify the DEGs and DE-miRNAs that were significantly associated with the recurrence
risk of OS. The calculation formula is shown as follows:
n N (i)
Score(i) 21 FC(i) 21
N(i) FC(n)
= # + #/ !
where i is the node in the network; FC(i) is the fold change of the node i; N(i) is the number
of the neighboring nodes of the node i; and score(i) represents the correlation of the node i and OS. When the node i and its neighbor- ing nodes were highly expressed, the neighbor-hood score is more than 0; when the node i and its neighboring nodes were lowly express- ed, the neighborhood score is less than 0.
Here, the DEGs and DE-miRNAs with the top
100 genes and miRNAs with the highest |nei-
ghborhood score| were identified as the ge-nes and miRNAs that were significantly
cor-related with the recurrence risk of OS. Establishment of the prediction model of re-currence risk
Based on the above identified recurrence-relat
-ed DEGs and DE-miRNAs, SVM algorithm was
used to establish a prediction model of the OS recurrence risk. The training set was used for the model establishment, and the cross-validation evaluation model was used to eva-
luate the efficiency of the established predic -tion model. Addi-tionally, the test set was used for the model validation.
Results
Identified DEGs and DE-miRNAs
After the preprocessing of the training and test sets, a total of 20393 genes and 37 samples (18 recurrent samples and 19 non-recurrent samples) were obtained in the mRNA training
set GSE39055, 873 miRNAs and 65 samples
(23 recurrent samples and 42 non-recurrent
samples) in the miRNA training set
GSE390-40, 20820 genes and 5 samples (2 recurrent samples and 3 non-recurrent samples) in the
mRNA test set GSE39057, and 873 miRNAs
and 26 samples (15 recurrent samples and 11 non-recurrent samples) in the miRNA test set
GSE39052.
Based on the criteria, a total of 1118 DEGs in GSE39055 and 63 DE-miRNAs GSE39040 were identified between the recurrence group
and the non-recurrence group.
Analysis of the integrated network of DE-miRNAs and DEGs
To further investigate the interactions of DEGs
and the regulatory relationships between DE-
analysis was carried out. The DEGs in four mod
-ules were significantly enriched in some GO terms and KEGG pathways. The genes in mod -ule 1 (e.g. RPL23, RPS9 and RPL5) were main- ly enriched in the functions of translation. The
genes in module 5 were significantly
enrich-ed in the functions of mitosis (e.g. ANAPC1, RCC2, CENPE, AURKA and CDC16) and regula-tion of protein metabolic process (ANAPC1, PSMB10, PPP2R4 and CDC16). Moreover, the genes in module 6 were markedly enriched in the cell cycle pathway (e.g. E2F1, CCNB1 and YWHAG), and positive regulation of protein met-abolic process (e.g. CCNB1, DLC1, CCND1 and IL6). In addition, the genes in module 10 (e.g. STAT6, EP300, ETS1, JUN and MAML3) were mainly enriched in the positive regulation of transcription (Supplementary Table 1).
Identification of the recurrence-related DEGs and DE-miRNAs
Based on the neighborhood scoring algorithm, the top 100 genes and miRNAs with the
high-est |neighborhood score| were identified to be significantly associated with the recurrence
risk of OS, such as SNX1, hsa-miR-200c, and MYO7A (Supplementary Table 2).
Analysis of the prediction model of recurrence risk
Among the above identified 100 genes and
miRNAs, 14 genes belonged to the four net-work modules. Due to their high correlations with the recurrence risk of OS, and the
topologi-cal modularity, these 14 genes were
defin-ed as core genes, and usdefin-ed to establish the prediction model.
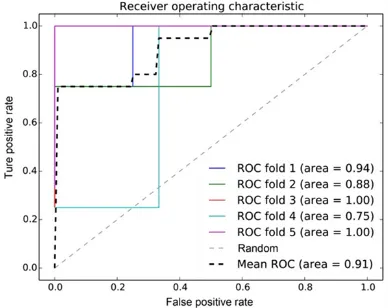
False positive rate and true positive rate of each cycle were calculated by the cross-vali- dation evaluation model. Based on the fea- ture optimization by the tree based method,
five feature genes were identified, including
NUDT21, PPP2R5A, PLK4, RPS9 and MX1. The receiver operating characteristic (ROC) curve showed that the mean area under the ROC
curve (AUC) of the five feature genes reached
91% (Figure 5). Subsequently, the test set
Figure 2. The integrated network of differentially expressed genes (DEGs) and differentially expressed microRNAs (DE-miRNAs). The green nodes represent DEGs; the purple nodes represent the DE-miRNAs; the red nodes repre
[image:6.612.90.290.184.339.2]-sent the target genes (non-DEGs) of miRNAs. The purple lines repre-sent the correlations between DE-miRNAs; the blue lines represent the regulatory relationships between miRNAs and their targets (non-DEGs); the yellow lines represent the regulatory relationships between DE-miRNAs and DEGs.
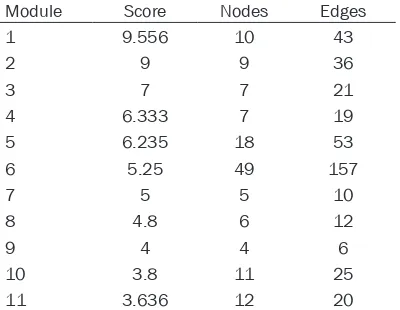
Table 1. The 11 topology modules identified form the integrated network of DEGs and
DE-miRNAs
Module Score Nodes Edges
1 9.556 10 43
2 9 9 36
3 7 7 21
4 6.333 7 19
5 6.235 18 53
6 5.25 49 157
7 5 5 10
8 4.8 6 12
9 4 4 6
10 3.8 11 25
11 3.636 12 20
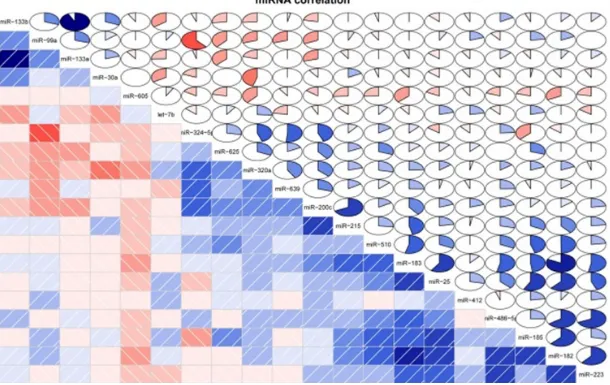
constructed. The co-expression correlation dia-gram showed that there were 20 DE-miRNAs that had co-expression correlations. For exam-ple, miR-99a had a positive correlation with miR-324-5p; miR-183 had a negative correla-tion with miR-182 (Figure 1).
In the integrated network, there were 63 DE-
miRNAs, 1118 DEGs and 369 miRNA target
genes that were not differentially expressed (Figure 2).
Analysis of the network modules
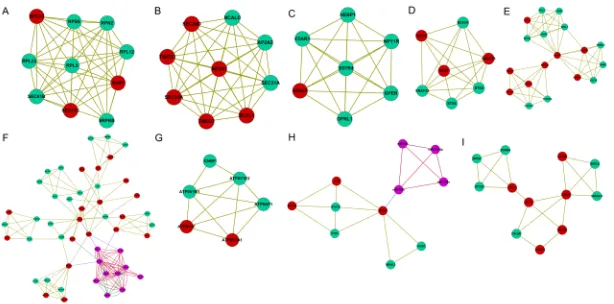
In total, 11 modules with the top 10 score were
identified from the integrated network (Table 1; Figure 3). Among the modules, nodes in the modules 7 and 9 were relatively less than others.
To further identify genes and miRNAs that were
significantly related to the recurrence risk of
OS from the modules, the survival analysis of genes and miRNAs in the 11 modules was per-formed. The Kaplan-Meier (KM) curve showed that genes and miRNAs in modules 1, 5, 6 and
10 were significantly associated with the sur -vival time of OS patients (Figure 4).
Furthermore, to reveal the potential biological
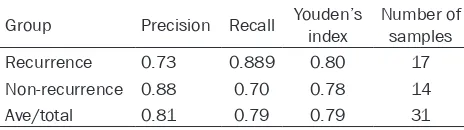
was used to assess the efficiency of the
es-tablished model. The test set data of mRNA and miRNA were pooled, and 17 recurrent samples and 14 non-recurrent samples were
identified by the prediction model. The total
precision was 81% (Table 2). Discussion
In the present study, a total of 1118 DEGs and 63 DE-miRNAs were identified between
the recurrence group and the non-recurrence group. Based on the analysis of the integrated
[image:9.612.92.286.116.270.2]network of DE-miRNAs and DEGs, 11 network modules were identified. Based on the neigh -borhood scoring algorithm, the top 100 genes and miRNAs in the network with the highest
|neighborhood score| were identified to be sig
-nificantly associated with the recurrence risk of OS. Additionally, five genes were identified as
the genes in the prediction model, including NUDT21, PPP2R5A, PLK4, RPS9 and MX1. NUDT21 protein (nudix, nucleoside diphosph- ate linked moiety X-type, motif 21), also known as CPSF5 or CFIM25, is one subunit of a
cleav-age factor required for 3’ RNA cleavcleav-age and
polyadenylation processing [18]. In a previous study, NUDT21 was predicted to be
significant-ly downregulated in OS tumor-initiating cells compared with the bulk of OS cells, indicating that it may be associated with the develop- ment of OS. PPP2R5A protein (Protein phos-phatase 2 regulatory subunit B’, alpha) is a
member of the phosphatase 2A regulatory subunit B family. Protein phosphatase 2A is one of the four major Ser/Thr phosphatases, and it is implicated in the negative control of cell growth and division [19]. PPP2R5A has
been identified as a nucleostemin
(NS)-inter-active protein [20]. NS is a nucleolar protein
required for embryogenesis and cell cycle pro -gression [21]. In human OS tumor cells, NS interacts with the oncogenic protein nucleo-phosmin in the cell nucleolus [22]. In this study, PPP2R5A was predicted to be implicated in oocyte meiosis. These studies suggest that PPP2R5A may be involved in the recurrence of OS, via participating in the tumor cell cycle. Furthermore, PPP2R5A was a member in mod-ule 5, genes of which were predicted to be
significantly associated with the survival time
of OS patients.
PLK4 protein (Polo like kinase 4) is a member of the polo family of serine/threonine protein kinases, which plays a central role in centriole duplication [23]. A recent study has demon-strated that the homolog of PLK4, Plk3, is downregulated in OS cell lines and tissues, and increased expression levels of Plk3 are associated with improved rates of overall sur-vival of patients [24]. Also, Plk3 is involved in the inhibition of cell proliferation and tumori-genesis [24]. Furthermore, another homolog of PLK4, PLK1, was previously confirmed to be
involved in the mitotic cell cycle of a variety of OS cell lines, and small interfering RNA (siRNA) targeting PLK1 also suppressed the growth of OS [25]. Although there is no any study to prove the association of PLK4 with the recurrence risk of OS, the above studies indicate that PLK4 may be correlated with the recurrence of OS, via participating in OS cell cycle.
Furthermore, RPS9 encodes ribosomal protein S9, which is a component of the 40S subunit of ribosomes [26]. It has been demonstrated that depletion of RPS9 provokes activation of the p53 tumor suppressor pathway, and decreased levels of RPS9 can lead to growth inhibition in OS cell lines [27]. MX1 protein (MX dynamin like
GTPase 1) is a guanosine triphosphate
(GTP)-metabolizing protein that participates in the cellular antiviral response [28]. In the network module 6, MX1 was predicted to interact with
Figure 4. The survival curve of the four network modules. A. Module 1; B. Module 5; C. Module 6; D. Module 10. Red curve represents the high-recurrent risk group, and blue represents the low-recurrent risk group.
Figure 5. The receiver operating characteristic (ROC)
curve of the five feature genes. AUC, area under the
XAF1, which encodes a protein that binds to and counteracts the inhibitory effect of a mem-ber of the IAP (inhibitor of apoptosis) protein family. In the OS cell line Saos-2, Xaf1 activates the mitochondrial apoptotic pathway to facili-tate cytochrome c release, thus amplifying apoptotic signals from death receptors, indicat-ing the role of XAF1 in the apoptosis of OS. Although there is no any study to prove the associations of RPS9 and MX1 with the recur-rence risk of OS, the above studies indicate that these two genes may be involved in the recurrence of OS, via regulating the cell growth of OS.
Despite the five genes discussed above, sever -al miRNAs were predicted to have a higher neighborhood score in the network, such as hsa-miR-200c. A previous study has reported that busulfan has its anti-OS effect by upregu-lating the miR-200 family [29], indicating the key role of the miR-200 family in OS. In the net-work module 6, miR-183 targeted three genes, such as SRSF2, which interacted with NUDT21. SRSF2 encodes a member of the serine/argi-nine (SR)-rich family of pre-mRNA splicing fac-tors. A recent study has discovered that the homolog of SRSF2, SRSF3, significantly regu -lates the expression of 60 genes and at least 20 miRNAs in human OS cells, indicating that SRSF3 affects a global change of gene expres-sion to maintain cell homeostasis [30]. Thus, SRSF2 may also have a similar function to regu-late gene expression in OS. For miR-183, mul-tiple studies have indicated its critical role in OS. For example, downregulation of miR-183 promotes the migration and invasion of OS by targeting ezrin [31]. The combined miR-183 downregulation and ezrin upregulation was
pre-viously discovered to be significantly associat -ed with positive metastasis and recurrence in OS (7). Collectively, the pathway of miR-183/ SRSF2/NUDT21 may be a potential new mech-anism underlying the recurrence of OS.
rent samples with a high precision. These five
genes were new-found to be potentially associ-ated with the recurrence risk and sur- vival time in OS. They will be further investigat-ed in animal models. Additionally, the pathway of miR-183/SRSF2/NUDT21 may be also cor-related with the recurrence of OS. These re- sults provide new information for the further experimental studies.
Acknowledgements
This study was supported by Beijing Nova Program (grant number: xx2014097) and Natural Science Foundation of China (grant number: 81402216).
Disclosure of conflict of interest
None.
Address correspondence to: Meng Xu and Yan
Wang, Department of Orthopaedics, General
Hos-pital of Chinese People’s Liberation Army, Hai- dian District, Beijing 100853, China. Tel: +86-10-66936619; E-mail: 13501175839@163.com (MX); wangyanyyyy12@hotmail.com (YW)
References
[1] Sobin LH, Gospodarowicz MK and Wittekind C. TNM classification of malignant tumours. John
Wiley & Sons, 2011.
[2] Ritter J, Bielack SS. Osteosarcoma. Ann Oncol 2010; 21 Suppl 7: 320-325.
[3] Stiller C, Bielack S, Jundt G and
Steliarova-Foucher E. Bone tumours in European children and adolescents, 1978-1997. Report from the automated childhood cancer information sys-tem project. Eur J Cancer 2006; 42: 2124-2135.
[4] Bacci G, Forni C, Longhi A, Ferrari S, Mercuri M,
[image:10.612.90.322.97.162.2]Bertoni F, Serra M, Briccoli A, Balladelli A and Picci P. Local recurrence and local control of non-metastatic osteosarcoma of the extremi-ties: a 27-year experience in a single institu-tion. J Surg Oncol 2007; 96: 118-123.
Table 2. The assessment result of the established prediction model by the test set
Group Precision Recall Youden’s index Number of samples Recurrence 0.73 0.889 0.80 17 Non-recurrence 0.88 0.70 0.78 14 Ave/total 0.81 0.79 0.79 31 AVE, Average variance extracted values.
Conclusions
In conclusion, a total of 1118 DEGs and 63 DE-miRNAs were identified between
the recurrence group and the non-recur-rence group. Based on the SVM algorithm,
the combination of five DEGs (NUDT21, PPP2R5A, PLK4, RPS9 and MX1) were
identified as a prediction model that was
non-recur-[5] Marina N, Gebhardt M, Teot L and Gorlick R.
Biology and therapeutic advances for pediatric osteosarcoma. Oncologist 2004; 9: 422-441. [6] Yang J, Yang D, Cogdell D, Du X, Li H, Pang Y,
Sun Y, Hu L, Sun B, Trent J, Chen K and Zhang
W. APEX1 gene amplification and its protein
overexpression in osteosarcoma: correlation with recurrence, metastasis, and survival. Technol Cancer Res Treat 2010; 9: 161-169. [7] Khanna C, Wan X, Bose S, Cassaday R, Olomu
O, Mendoza A, Yeung C, Gorlick R, Hewitt SM
and Helman LJ. The membrane-cytoskeleton linker ezrin is necessary for osteosarcoma me-tastasis. Nat Med 2004; 10: 182-186. [8] Mu Y, Zhang H, Che L and Li K. Clinical signifi
-cance of microRNA-183/Ezrin axis in judging the prognosis of patients with osteosarcoma. Med Oncol 2014; 31: 013-0821.
[9] Song QC, Shi ZB, Zhang YT, Ji L, Wang KZ, Duan DP and Dang XQ. Downregulation of mi-croRNA-26a is associated with metastatic po-tential and the poor prognosis of osteosarco-ma patients. Oncol Rep 2014; 31: 1263-1270. [10] Zhang H, Yin Z, Ning K, Wang L, Guo R and Ji Z.
Prognostic value of microRNA-223/epithelial
cell transforming sequence 2 signaling in pa -tients with osteosarcoma. Hum Pathol 2014; 45: 1430-1436.
[11] Sartakhti JS, Zangooei MH and Mozafari K. Hepatitis disease diagnosis using a novel hy-brid method based on support vector machine and simulated annealing (SVM-SA). Comput Methods Programs Biomed 2012; 108: 570-579.
[12] Lee HS, Cho SB, Lee HE, Kim MA, Kim JH, Park DJ, Kim JH, Yang HK, Lee BL and Kim WH.
Protein expression profiling and molecular classification of gastric cancer by the tissue ar -ray method. Clin Cancer Res 2007; 13: 4154-4163.
[13] Stoean R, Stoean C, Lupsor M, Stefanescu H and Badea R. Evolutionary-driven support vec-tor machines for determining the degree of
liv-er fibrosis in chronic hepatitis C. Artif Intell
Med 2011; 51: 53-65.
[14] Meding S, Nitsche U, Balluff B, Elsner M, Rauser S, Schöne C, Nipp M, Maak M, Feith M
and Ebert MP, Friess H, Langer R, Höfler H,
Zitzelsberger H, Rosenberg R, Walch A. Tumor
classification of six common cancer types based on proteomic profiling by MALDI imag -ing. J Proteome Res 2012; 11: 1996-2003. [15] Kelly AD, Haibe-Kains B, Janeway KA, Hill KE,
Howe E, Goldsmith J, Kurek K, Perez-Atayde
AR, Francoeur N, Fan JB, April C, Schneider H,
Gebhardt MC, Culhane A, Quackenbush J and Spentzos D. MicroRNA paraffin-based studies
in osteosarcoma reveal reproducible
indepen-dent prognostic profiles at 14q32. Genome
Med 2013; 5: 2.
[16] Smyth GK. Linear models and empirical bayes
methods for assessing differential expression
in microarray experiments. Stat Appl Genet
Mol Biol 2007; 3: 1-28.
[17] Bader GD and Hogue CW. An automated meth
-od for finding molecular complexes in large
protein interaction networks. BMC Bioinfor- matics 2003; 4: 2.
[18] Kubo T, Wada T, Yamaguchi Y, Shimizu A and Handa H. Knock-down of 25 kDa subunit of cleavage factor Im in Hela cells alters alterna-tive polyadenylation within 3’-UTRs. Nucleic Acids Res 2006; 34: 6264-6271.
[19] McCright B and Virshup DM. Identification of a
new family of protein phosphatase 2A regula-tory subunits. J Biol Chem 1995; 270: 26123-26128.
[20] Yang HX, Jin GL, Meng L, Zhang JZ, Liu WB and Shou CC. Screening and identification of pro -teins interacting with nucleostemin. World J
Gastroenterol 2005; 11: 4812-4814.
[21] Beekman C, Nichane M, De Clercq S, Maetens
M, Floss T, Wurst W, Bellefroid E and Marine JC. Evolutionarily conserved role of nucleoste-min: controlling proliferation of stem/progeni-tor cells during early vertebrate development. Mol Cell Biol 2006; 26: 9291-9301.
[22] Ma H and Pederson T. Nucleophosmin is a binding partner of nucleostemin in human os-teosarcoma cells. Mol Biol Cell 2008; 19: 2870-2875.
[23] Rosario CO, Ko MA, Haffani YZ, Gladdy RA, Paderova J, Pollett A, Squire JA, Dennis JW and Swallow CJ. Plk4 is required for cytokinesis
and maintenance of chromosomal stability. Proc Natl Acad Sci U S A 2010; 107: 6888-6893.
[24] Lv H, Gao G, Zhang L and Sun Y. Pololike ki -nase 3 inhibits osteosarcoma cell proliferation and tumorigenesis via cooperative interaction with p21. Mol Med Rep 2015; 12: 6789-6796. [25] Yamaguchi U, Honda K, Satow R, Kobayashi E,
Nakayama R, Ichikawa H, Shoji A, Shitashige M, Masuda M, Kawai A, Chuman H, Iwamoto Y, Hirohashi S and Yamada T. Functional genome screen for therapeutic targets of osteosarco-ma. Cancer Sci 2009; 100: 2268-2274. [26] Kenmochi N, Kawaguchi T, Rozen S, Davis E,
Goodman N, Hudson TJ, Tanaka T and Page
DC. A map of 75 human ribosomal protein
genes. Genome Res 1998; 8: 509-523.
[27] Lindstrom MS and Nister M. Silencing of ribo-somal protein S9 elicits a multitude of cellular responses inhibiting the growth of cancer cells
subsequent to p53 activation. PLoS One 2010;
5: 0009578.
[28] Haller O, Staeheli P and Kochs G.
[29] Mei Q, Li F, Quan H, Liu Y and Xu H. Busulfan inhibits growth of human osteosarcoma th- rough miR-200 family microRNAs in vitro and in vivo. Cancer Sci 2014; 105: 755-762. [30] Ajiro M, Jia R, Yang Y, Zhu J and Zheng ZM. A
genome landscape of SRSF3-regulated splic-ing events and gene expression in human os-teosarcoma U2OS cells. Nucleic Acids Res 2016; 44: 1854-1870.
Supplementary Table 1. The Gene Ontology functional and KEGG pathway enrichment analyses of the genes in the network modules
Module Functional term p-value Gene count Genes
Module 1 GO:0006414~translational elongation 2.93E-05 4 RPL23, RPS9, RPL5, RPL12
hsa03010:Ribosome 4.72E-05 4 RPL23, RPS9, RPL5, RPL12
GO:0044267~cellular protein metabolic process 6.27E-05 8 SEC61B, RPL23, SEC11C, SPCS3, RPS9, RPL5, RPL12, RPN2
GO:0006412~translation 9.80E-04 4 RPL23, RPS9, RPL5, RPL12
GO:0006465~signal peptide processing 0.005196 2 SEC11C, SPCS3
Module 5 GO:0007067~mitosis 4.75E-08 7 ANAPC1, RCC2, CENPE, AURKA, CDC16, AURKB, NUP43
GO:0000087~M phase of mitotic cell cycle 5.28E-08 7 ANAPC1, RCC2, CENPE, AURKA, CDC16, AURKB, NUP43
hsa04114:Oocyte meiosis 2.30E-07 6 ANAPC1, PPP2R5A, PPP3R1, AURKA, CDC16, PPP3CA
GO:0000279~M phase 5.14E-07 7 ANAPC1, RCC2, CENPE, AURKA, CDC16, AURKB, NUP43
GO:0031400~negative regulation of protein modification process 5.58E-06 5 ANAPC1, PSMB10, PSMD1, PPP2R4, CDC16
Module 6 hsa04110:Cell cycle 2.35E-09 10 E2F1, CCNB1, CCND1, YWHAG, HDAC2, E2F5, CCND2, TP53, CDC25A, TFDP1
GO:0032270~positive regulation of cellular protein metabolic process 3.75E-05 7 CCNB1, DLC1, CCND1, IL6, HDAC2, CCND2, BTRC
GO:0051247~positive regulation of protein metabolic process 4.74E-05 7 CCNB1, DLC1, CCND1, IL6, HDAC2, CCND2, BTRC
GO:0031399~regulation of protein modification process 1.39E-04 7 CCNB1, DLC1, CCND1, IL6, CCND2, BTRC, HIPK3
GO:0031401~positive regulation of protein modification process 1.50E-04 6 CCNB1, DLC1, CCND1, IL6, CCND2, BTRC
Module 10 GO:0045893~positive regulation of transcription 3.16E-05 5 STAT6, EP300, ETS1, JUN, MAML3
GO:0051254~positive regulation of RNA metabolic process 3.26E-05 5 STAT6, EP300, ETS1, JUN, MAML3
GO:0045941~positive regulation of transcription 6.11E-05 5 STAT6, EP300, ETS1, JUN, MAML3
GO:0010628~positive regulation of gene expression 6.87E-05 5 STAT6, EP300, ETS1, JUN, MAML3
Supplementary Table 2. The top 100 genes or miRNAs with the highest |neighborhood score| in the network
Node Top score Node Tail score
SILV 0.819811 MYO7A -0.7369
SNX1 0.768094 GIMAP4 -0.73807
SNX15 0.768094 ATF5 -0.73882
OR9Q1 0.750396 EGLN3 -0.74195 hsa-miR-200c 0.728825 NCSTN -0.7426
OR5P3 0.721784 DYNC1LI2 -0.74512
OR56B4 0.711063 DPYSL4 -0.74875
RASD1 0.696537 RAI14 -0.74985
WBSCR16 0.671904 ZNF830 -0.7553
CCT6A 0.52915 MZF1 -0.75722
KIF25 0.504924 ZC3HC1 -0.75785
KIF15 0.493679 HARS2 -0.75929 hsa-miR-629 0.448951 HARS -0.75929
UTS2D 0.440907 NDUFS3 -0.76116
PPP2R5A 0.426869 DUSP3 -0.76907
DYSF 0.422086 F7 -0.77173
hsa-miR-99a 0.403762 EML3 -0.77229
SLC17A5 0.393557 ATAD5 -0.77275
WDR5B 0.391565 RPL19 -0.77442
HS2ST1 0.388349 OSBPL1A -0.77493
ICAM3 0.384788 PCSK1 -0.77537
NTN1 0.381063 FRYL -0.77616
FAM96A 0.380185 ZNF24 -0.77619
HIST4H4 0.377704 NDUFA5 -0.77898
GNG10 0.372212 hsa-miR-662 -0.77967
PRDM5 0.370654 EDC3 -0.78036
YY2 0.364994 OSBPL3 -0.78127
KLC2 0.364909 BCLAF1 -0.78187
TRIM71 0.36488 INO80B -0.79045
OPN4 0.363511 NDUFB4 -0.79493
SLC7A11 0.3635 ST3GAL3 -0.79603
ACE 0.363499 IMP4 -0.81044
GLUL 0.361503 CNBP -0.81341
AGR2 0.359536 COL4A2 -0.82748
CRX 0.356829 hsa-miR-491-3p -0.82748
PARD6B 0.355934 ATP1A1 -0.82789
KLHL9 0.355009 FXYD1 -0.82789
KCNC3 0.354948 IMPDH1 -0.8317
KRT85 0.35466 MAGOHB -0.83186
CCR10 0.353938 LIMK2 -0.83728
RPS6KA5 0.351023 NDUFS7 -0.83967
CREB3L4 0.34943 PNN -0.84911
RLN2 0.348825 RAB5A -0.86335
AP2A2 0.347025 PEBP1 -0.86434
HAS2 0.346543 SSPO -0.86492
CD27 0.343536 RECK -0.87626
TBPL2 0.343053 hsa-miR-662 -0.89784
DCT 0.342586 METAP2 -0.95319
MEOX1 0.34091 LIAS -0.96248