COMMIT-P1WP3: A Co-occurrence Based Approach
to Aspect-Level Sentiment Analysis
Kim Schouten1,2
[email protected] Flavius Frasincar 1 [email protected]
1Econometric Institute, Erasmus University Rotterdam, The Netherlands 2Erasmus Studio, Erasmus University Rotterdam, The Netherlands
Franciska de Jong2 [email protected]
Abstract
In this paper, the crucial ingredients for our submission to SemEval-2014 Task 4 “Aspect Level Sentiment Analysis” are discussed. We present a simple aspect de-tection algorithm, a co-occurrence based method for category detection and a dic-tionary based sentiment classification al-gorithm. The dictionary for the latter is based on co-occurrences as well. The fail-ure analysis and related work section focus mainly on the category detection method as it is most distinctive for our work.
1 Introduction
In recent years, sentiment analysis has taken flight and is now actively used, on the Web and be-yond (Liu, 2012). To provide users of sentiment tools with more detailed and useful information, a number of innovations have been introduced, and among others a switch from document-level sen-timent analysis towards fine-grained, aspect-level sentiment analysis can be seen (Feldman, 2013). In line with the many challenges associated with this, SemEval-2014 Task 4 “Aspect Level Senti-ment Analysis” (Pontiki et al., 2014) is split into four sub-tasks: Aspect Detection, Aspect Senti-ment Classification, Category Detection, and Cat-egory Sentiment Classification.
The main focus of this paper is on the category detection algorithm we developed, but a method for aspect detection and a sentiment classifica-tion algorithm (both for aspects and categories) are also included. The aspect detection algorithm will be presented first, followed by the category de-tection algorithm and the sentiment classification
This work is licenced under a Creative Commons Attribution 4.0 International License. Page numbers and proceedings footer are added by the organizers. License details: http: //creativecommons.org/licenses/by/4.0/
method. Next, the benchmark results for all algo-rithms are presented, plus a discussion and failure analysis of the category detection method. Finally, conclusions are drawn and some suggestions for future work are presented.
2 Related Work
Because the focus of this paper lies on the cat-egory detection method, only for that method a short snippet of related work is given. That algo-rithm, being an adapted version of Schouten and Frasincar (2014), is inspired by the work of Zhang and Zhu (2013) and Hai et al (2011). In these works, a co-occurrence matrix is created between words in the sentence and aspects in order to find implicit aspects (i.e., aspects that are not literally mentioned, as opposed to the explicit aspects used in this task).
While implicit aspects are similar to aspect cat-egories to some extent, these methods do not work when a fixed, limited set of possible aspect cat-egories is used that is, most importantly, not a subset of the set of aspects. The above meth-ods could never, for instance, identify the ‘anec-dotes/miscellaneous’ category, as this word never appears as an aspect in the data set. This is the main reason why we have chosen to count the co-occurrences between words and the annotated as-pect categories.
3 Aspect Detection Method
In the work reported here, the aspect detection method plays the role of a baseline method rather than a full-fledged algorithm. In its most basic form, it annotates all noun phrases as aspects. However, by using the training set to count how often each word appears within an aspect, a sim-ple probability can be computed representing the chance that this word is an aspect word or not. This probability is used to filter the set of noun phrases, such that only noun phrases remain that
have at least one word for which the aspect proba-bility≥0.05 and for those noun phrases, all lead-ing words in the noun phrase with a probability below 0.05 are removed. This will remove words like determiners from the initial noun phrase, as those are not included in the aspect term. Because this filtering is strict, the result is a typical high precision, low recall algorithm for aspect detec-tion.
4 Category Detection Method
To find the aspect categories, the co-occurrence based algorithm from Schouten and Frasin-car (2014) is used and improved upon. The cen-tral construct in this algorithm is a co-occurrence matrix that captures the frequency of the co-occurrences between words (i.e., the lemmas of the words) in the sentence and the annotated as-pect category. This gives a mapping from words to aspect categories. When processing an unlabelled sentence, a score is computed for each aspect cat-egory as shown in Eq. 1.
scoreai =
1 v
v
X
j=1
ci,j
oj , (1)
where v is the number of words in the sentence, aiis theith aspect category in the list of possible
aspect categories for which thescoreis computed, jrepresents thejth word in the sentence,ci,jis the
co-occurrence frequency of aspect categoryiand lemmajin the data set, andojis the frequency of
lemmajin the data set.
Whereas in Schouten and Frasincar (2014), the highest scoring category was chosen on the con-dition that its score exceeded a threshold, our method is now able to choose more than one as-pect category per sentence. This is done by train-ing a separate threshold for each of the five aspect categories using all training data. When the score for some aspect category is higher than its associ-ated threshold (i.e., scoreai > thresholdai), the
sentence is annotated as having that aspect cate-gory.
Since we assume the five threshold values to be independent of each other, a simple linear search is performed separately for all five of them to find the optimal threshold value by optimizingF1 (cf.
Sec. 6). As a default option, the fifth category (‘anecdotes/miscellaneous’) is associated to any sentence for which none of the five categories
ex-ceeded their threshold. The trained threshold val-ues for the five categories are:
ambience price food service misc
0.042 0.024 0.211 0.071 0.143
The pseudocode for the creation of the co-occurrence matrix can be found in Algorithm 1, and Algorithm 2 describes the process of annotat-ing a sentence with aspect categories.
Algorithm 1Aspect category detection training. Initialize set of word lemmas with frequencies O
Initialize set of aspect categoriesA Initialize co-occurrence matrixC
forsentences∈training datado forwordw∈sdo
O(w) =O(w) + 1
end for
foraspect categorya∈sdo
addatoA
forwordw∈sdo
C(w, a) =C(w, a) + 1
end for end for end for
foraspect categoryainAdo
thresholda=0
bestF1= 0
fort= 0to1step 0.001do
Execute Algorithm 2 on training data
ComputeF1
ifF1 > bestF1thenthresholda=t end if
end for end for
5 Sentiment Classification Method
Algorithm 2Aspect category detection execution.
forsentences∈test datado foraspect categorya∈Ado
score= 0
forwordw∈sdo ifO(w)>0then
score=score+C(w, a)/O(w)
end if end for
score=score/length(s)
ifscore > thresholdathen
Assign aspect categoryatos
end if end for
ifshas no assigned aspect categoriesthen
Assign ‘anecdotes/miscellaneous’ tos
end if end for
negative aspects are likely to have the same polar-ity. Since sentiment is also carried by expressions, rather than single words only, the constructed sen-timent lexicon has entries for encountered uni-grams, biuni-grams, and trigrams. In each sentence, the distance between each n-gram and each aspect is computed and the sentiment of the aspect, dis-counted by the computed distance, is added to the sentiment value of the n-gram, as shown in Eq. 2.
sentimentg =
1 freqg ·
X
s∈Sg
p·torder(g)· X
a∈As
polaritya
(distanceg,a)m,
(2) wheregis the n-gram (i.e., word unigram, bigram, or trigram), freqg is the frequency of n-gram g
in the data set, s is a sentence in Sg, which is
the set of sentences that contain n-gramg, p is a parameter to correct for the overall positivity of the data set, tis a parameter that corrects for the relative influence of the type of n-gram (i.e., dif-ferent values are used for t1, t2, andt3), ais an
aspect in As, which is the set of aspects in
sen-tences, polaritya is 1 when aspect ais positive
and −1 when ais negative, and m is a parame-ter that deparame-termines how strong the discounting by the distance should be. The distance computed is the shortest word distance between the aspect and the n-gram (i.e., both an n-gram and an as-pect can consist of multiple words, in which case
the closest two are used to compute the distance). Note that essentially, dictionary creation is based on how often an n-gram co-occurs with positive or negative aspects. In our submitted run on the restaurant data, we settorder(g) to 1, 5, and 4 for unigrams, bigrams, and trigrams, respectively, and p= 2and for the laptop data we settorder(g)to 1, 0, and 3 for the n-grams andp= 1. In both cases, mwas kept at 1. These values were determined by manual experimentation.
To compute the sentiment of an aspect, the sen-timent value of each n-gram is divided by the dis-tance between that n-gram and the aspect, com-puted in a similar fashion as in the above formula) and summed up, as shown in Eq. 3.
sentimenta,sa =
X
g∈sa
sentimentg
(mindistanceg,a)m, (3)
where, in addition to the definitions in the previ-ous equation, g is an n-gram in sa, which is the
sentence in which aspectaoccurs. Note that for each occurrence of a term, its sentiment value is added to the total score. If the result is above zero, the class will be ‘positive’, and if the result is be-low zero, the class will be ‘negative’. In the rare event of the sentiment score being exactly zero, the ‘neutral’ class is assigned.
For category sentiment classification, the for-mula of Eq. 3 remains the same, except that the distance term mindistancem
g,a is set to 1, since
aspect categories pertain to the whole sentence in-stead of having specific offsets.
6 Evaluation
All three algorithms presented above were evalu-ated through a submission in the SemEval-2014 Task 4 “Aspect Level Sentiment Analysis”. Two data sets have been used, one consisting of sen-tences from restaurant reviews, the other consist-ing of sentences from laptop reviews. Both sets have been annotated with aspects and aspect senti-ment, but only the restaurant set is also annotated with aspect categories and their associated senti-ment class. Both data sets are split into a training set of roughly 3000 sentences and a test set of 800 sentences.
Table 1: Official results for both algorithms.
aspect detection(subtask 1)
precision recall F1
laptop 0.836 0.148 0.252
restaurant 0.909 0.388 0.544
category detection(subtask 3)
precision recall F1
restaurant 0.633 0.558 0.593
aspect sentiment classification(subtask 2)
laptop accuracy 0.570
restaurant accuracy 0.660
category sentiment classification(subtask 4)
restaurant accuracy 0.677
the Stanford CoreNLP framework1. Furthermore, the OpenNLP2chunker was used to provide basic phrase chunking in order to retrieve noun phrases for instance.
The official scores, as computed by the task or-ganizers are shown in Table 1. Note that the senti-ment classification algorithm is used for subtasks 2 and 4, so two scores are reported, and that subtasks 3 and 4 can only be performed with the restaurant data set.
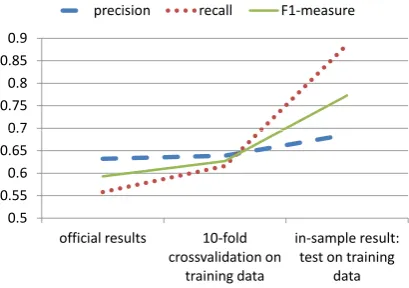
As the performance of the category detection method was lower than anticipated, a failure anal-ysis has been performed. This led to the observa-tion that overfitting is one of major factors in ex-plaining the lower performance . This is shown in Figure 1, in which one can easily notice the great difference in in-sample performance, and the per-formance on unseen data. Notice that by using 10-fold cross-validation, better results are achieved than on the official test set. This indicates that there are factors other than overfitting that influ-ence the performance.
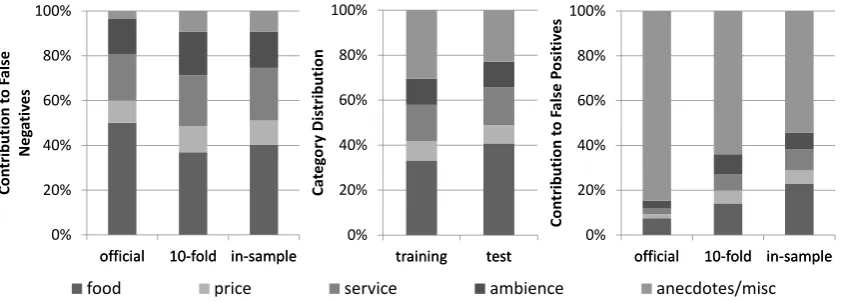
Interestingly, especially recall is influenced by the overfitting problem: precision is almost the same for the 10-fold cross-validation and even with the in-sample performance it increases only a little bit. To gain more insight into the difference in recall, a graph showing the relative contribution to false negatives of the five categories is shown in Figure 2. For completeness, the same graph but for false positives is also shown, together with the fre-quency distribution of the categories in both train-ing and test set.
Immediately visible is the effect of defaulting to 1http://nlp.stanford.edu/software/corenlp.shtml
2https://opennlp.apache.org/
0.7 0.75 0.8 0.85 0.9
precision recall F1-measure
0.5 0.55 0.6 0.65 0.7
official results 10-fold crossvalidation on
training data
in-sample result: test on training
[image:4.595.313.518.68.212.2]data training data data
Figure 1: Performance measure of category detec-tion on different parts of data.
the ‘anecdotes/miscellaneous’ when no category is assigned to that sentence: many false positives are generated by this rule, but there are almost no false negatives for this category. Note that without this default, F1-measure would drop by roughly 3
per-centage points.
Also notable is the difference between the in-sample bar and the official results bar: two cat-egories, namely ‘anecdotes/miscellaneous’ and ‘food’ show large differences in contribution to false positives and false negatives. The algo-rithm finds fewer ‘food’ categories in the test set, than in the training set, while for ‘anec-dotes/miscellaneous’, the reverse is the case. This can at least be partly explained by the change in data statistics: in the training set, 33% of the an-notated categories are ‘food’ and 30% are ‘anec-dotes/miscellaneous’, whereas in the test set, these numbers are 40% and 22%, respectively. With much more sentences having the ‘food’ category, false positives will be lower but false negatives will be higher. For ‘anecdotes/miscellaneous’, the reverse is true: with less sentences in the test set having this category, false positives will by higher, but false negatives will be lower, a change rein-forced by ‘anecdotes/miscellaneous’ being the de-fault.
[image:4.595.74.290.76.241.2]0% 20% 40% 60% 80% 100%
training test
C
a
te
g
o
ry
D
is
tr
ib
u
ti
o
n
food price service ambience anecdotes/misc
0% 20% 40% 60% 80% 100%
official 10-fold in-sample
C
o
n
tr
ib
u
ti
o
n
t
o
F
a
ls
e
N
e
g
a
ti
v
e
s
0% 20% 40% 60% 80% 100%
official 10-fold in-sample
C
o
n
tr
ib
u
ti
o
n
t
o
F
a
ls
e
P
o
si
ti
v
e
s
training test
food price service ambience anecdotes/misc
[image:5.595.86.507.67.218.2]official 10-fold in-sample official 10-fold in-sample
Figure 2: The frequency distribution of each category and its relative contribution to the total number of false negatives (left graph) and false positives (right graph). The middle graph shows the change in the distribution of categories in the training and test set.
test set. Testing the algorithm with one threshold for all five categories, while showing a sharply de-creased in-sample performance, yields an out-of-sample F1-measure that is only slightly lower than
F1-measure with different thresholds.
7 Conclusion
In this paper the main ingredients for our submis-sion to SemEval-2014 Task 4 “Aspect Level Sen-timent Analysis” are discussed: a simple aspect detection method, a co-occurrence based method for category detection, and a dictionary based sen-timent classification algorithm. Since the category detection algorithm did not perform as expected, a failure analysis has been performed, while for the others this was less necessary as they performed roughly as expected.
The failure analysis provides several starting points for future research. First, it would be in-teresting to determine the exact nature of the de-pendency between category performance and cat-egory frequency, as discussed above, and to re-move this dependency, since it is not guaranteed in real-life scenarios that the frequency distribution of the training set is the same as the set of instances an algorithm will encounter when in use. Fur-thermore, training five separate category thresh-old, while good for performance in general, also aggravates the problem of overfitting. Hence, im-proving the generalization of the algorithm, and the thresholds in particular, is important. Last, a method to deal with very low frequency words could prove useful as well.
Acknowledgment
The authors are partially supported by the Dutch national program COMMIT.
References
Ronen Feldman. 2013. Techniques and Applications for Sentiment Analysis. Communications of the ACM, 56(4):82–89.
Zhen Hai, Kuiyu Chang, and J. Kim. 2011. Implicit Feature Identification via Co-occurrence Associa-tion Rule Mining. In Proceedings of the 12th In-ternational Conference on Computational Linguis-tics and Intelligent Text processing (CICLing 2011), volume 6608, pages 393–404. Springer.
Bing Liu. 2012. Sentiment Analysis and Opinion
Mining, volume 16 ofSynthesis Lectures on Human
Language Technologies. Morgan & Claypool. Maria Pontiki, Dimitrios Galanis, John
Pavlopou-los, Harris Papageorgiou, Ion AndroutsopouPavlopou-los, and Suresh Manandhar. 2014. SemEval-2014 Task 4: Aspect Based Sentiment Analysis. InProceedings of the International Workshop on Semantic Evalua-tion (SemEval 2014).
Kim Schouten and Flavius Frasincar. 2014. Find-ing Implicit Features in Consumer Reviews for Sen-timent Analysis. In Proceedings of the 14th In-ternational Conference on Web Engineering (ICWE 2014), pages 130–144. Springer.
Yu Zhang and Weixiang Zhu. 2013. Extracting Implicit Features in Online Customer Reviews for Opinion Mining. InProceedings of the 22nd Inter-national Conference on World Wide Web Companion
(WWW 2013 Companion), pages 103–104.