89
Predicting ICU transfers using text messages between nurses and doctors
Faiza Khan Khattak1,2,3, Chlo´e Pou-Prom2, Robert Wu4, Frank Rudzicz1,2,3,5 1Department of Computer Science, University of Toronto
2St. Michael’s Hospital
3Vector Institute for Artificial Intelligence 4Toronto General Hospital
5Surgical Safety Technologies
[email protected], [email protected], [email protected], [email protected]
Abstract
We explore the use of real-time clinical infor-mation, i.e., text messages sent between nurses and doctors regarding patient conditions in or-der to predict transfer to the intensive care unit (ICU). Preliminary results, in data from five hospitals, indicate that, despite being short and full of noise, text messages can augment other visit information to improve the performance of ICU transfer prediction.
1 Introduction
‘Failure to rescue’ is an important aspect of patient safety and can be caused by poor communication, or a lack of situational awareness, in the care team (Brady and Goldenhar,2014). There has been in-creased recognition of the importance of acting on deteriorating patients by escalating their care via rapid response and emergency medical teams ( De-Vita et al.,2006). Established criteria, such as the Modified Early Warning Score (MEWS) (Subbe et al., 2001), identify patients at risk of deteri-oration. Recently, machine learning approaches have employed electronic patient record data, vi-tal signs, and laboratory results (Zhou et al.,2016;
Futoma et al.,2015;Che et al.,2016;Frost et al.,
2017), and have typically performed better than MEWS (Churpek et al.,2016;Zhai et al.,2014).
Related work in intensive care unit (ICU) trans-fer prediction often relies on structured data (i.e., lab results and vitals) taken from the patient’s elec-tronic health record. For instance, Tabak et al.
(2017) developed a measure that relied on both clinical and administrative data (e.g., diagnosis, length of stay, number of previous discharges) and predicted hospital readmission with c-statistics up to 0.722. Similarly,Genev`es et al.(2018) focused on drug prescription data on the day of admis-sion, and predicted various forms of risk, includ-ing ICU admissions (≥65% AUC). By contrast,
Escudi´e et al.(2018) represented thetextof elec-tronic health records based on the Fast Healthcare Interoperability Resources format1and used word embedding and random forests to predict disease codes at the time of discharge, with a wide range in accuracies. Miotto et al.(2016) embedded medi-cations, diagnoses, procedures, lab tests, and other structured information in a deep neural net and were able to predict various diseases with an aver-age AUC-ROC of 0.773. Crucially, none of these systems used dynamic real-time data on a patient. Real-time clinical information, especially com-munication between nurses and doctors, may be useful in improving the accuracy of detecting de-teriorating patients (Rajkomar et al.,2018). In par-ticular, this information may hold vital data not included in other fields, including changes in con-sciousness, pain, and other symptoms. Often, ur-gent communication in the hospital still occurs through pagers, limiting analysis of this commu-nication (De Meester et al.,2013;Wu et al.,2013;
Johnston et al., 2014). In some hospitals, how-ever, communication occurs through text messag-ing. This transition from unrecorded messages to text allows for deeper analysis of these potentially crucial information. In this work, we evaluate the impact of using text messages between physicians and nurses to predict ICU transfer.
2 Data
Our data consist of 38,373 patients across 49,224 visits, between 2011 and 2017, divided into five groups according to different institutional codes. Messages from 2011 to 2015 are in a different format (from an older system), so we focus our analysis on messages from 2015 to 2017. We also exclude all patients who have missing institutional
Group A Group B Group C Group D Group E
Patient info.
# Patients (M/F) 4,536 / 4,031 3488 / 3363 206 / 202 21 / 19 17 / 10 Age at admission 63.45 (18.55) 70.01 (18.86) 72.75 (14.45) 72.59 (17.35) 72.66 (12.07) # mheaders/patient 13.86 (23.07) 15.54 (24.96) 21.81 (38.58) 15.07 (19.68) 11.82 (9.17) # mreplies/patient 14.27 (23.52) 16.46 (26.49) 22.68 (40.86) 21.61 (23.39) 12.32 (8.74) Visit info.
# Visits 10,001 8,586 527 57 30
# visits/patient 1.35 (0.89) 1.41 (1.02) 1.37 (0.86) 1.48 (0.85) 1.29 (0.60) # days/visit 9.80 (19.01) 9.91 (21.47) 15.22 (19.87) 12.76 (14.75) 9.22 (6.47) # mheaders/visit 9.85 (16.58) 10.64 (17.84) 15.48 (27.02) 14.40 (18.14) 8.67 (7.97) # mreplies/visit 10.18 (16.98) 11.31 (18.95) 16.18 (28.46) 15.07 (19.68) 9.03 (7.99) Messages info.
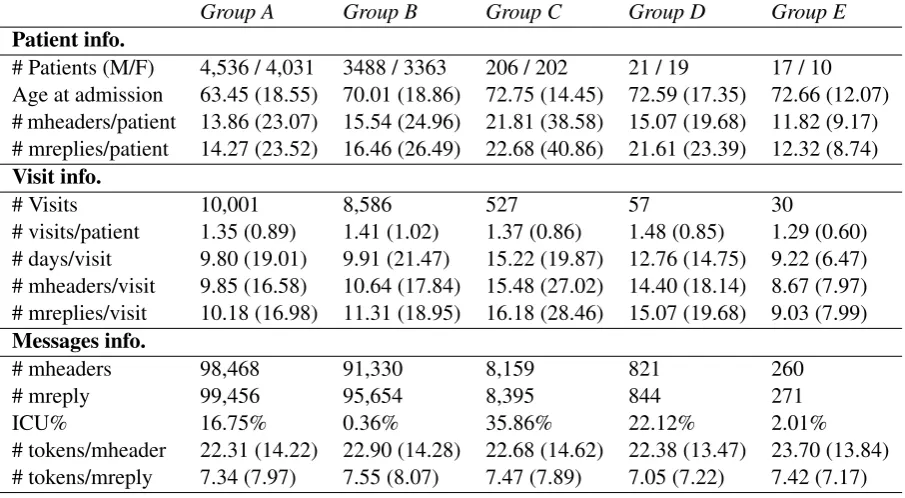
[image:2.595.73.526.63.312.2]# mheaders 98,468 91,330 8,159 821 260 # mreply 99,456 95,654 8,395 844 271 ICU% 16.75% 0.36% 35.86% 22.12% 2.01% # tokens/mheader 22.31 (14.22) 22.90 (14.28) 22.68 (14.62) 22.38 (13.47) 23.70 (13.84) # tokens/mreply 7.34 (7.97) 7.55 (8.07) 7.47 (7.89) 7.05 (7.22) 7.42 (7.17)
Table 1: Patient, visit, and messages information of data between years 2015 and 2017 used to train models for predicting ICU transfer. We indicate standard deviation in parentheses. ICU % is the ratio of mheaders resulting in ICU transfer within 3 days of the message send date.
code in their record. Data include patient and visit information, and text messages.
Patient information includes patient ID, date of birth, gender, date admitted, most recent medication, and most recent diagnosis.
Visit information includes visit number, dis-charge date time, diagnosis made during the visit2, visit type (“Emergency” or “Inpatient”), doctors’ notes, lab results, institutional code, and an Admission/Discharge/Transfer (ADT) code indicating to where the patient was admitted, discharged, or transferred to. Of the 539 ADT values, 19 correspond to an ICU transfer.
Text messagesare collected from the hospital net-work system and split intomessage headers and
message replies. Message headersconsist of text messages sent from nurses to physicians. These messages include information such as medication and status of patient. Some message headers have a correspondingmessage reply, which consists of text responses from doctors. The database system in which these text messages are stored only allows for replies from doctor but not a reply back from nurse. If a nurse replies back, it is considered a new message header, making it difficult to track a “conversation thread”. Sometimes the message
2This is not the same as the diagnosis in the patient infor-mation.
reply gets sent more than one time and many other times it is empty. In our experiments, we only look at themessage header, as mostmessage repliesare short and uninformative. The top most frequent replies are:“thanks”,“ok”and“noted”
across all groups. We split the data by institutional code and report a summary of the demographics, visits, and messages in Table1.
mheader:“hb=65, cr=123 & more lab res up from last nights bldwork. Ping if anything you want me to follow up.”
mreply:“informed.”
mheader: “dc hep drip on epr. Pls see chart or-der. Thnx.”
mreply:“done thanks”
mheader: “hey are icu recommends to be cosigned. thx.”
[image:2.595.75.525.66.311.2]mreply:“Ok. Pls run one l of ringers wide & then one more”
Table 2: Examples ofmessage header(mheader) and
message reply(mreply) pairs. Modified for anonymity.
GroupA GroupC
−− +Ling −− +Ling
[image:3.595.75.515.63.174.2]V isit 0.47±(0.01) 0.50±(0.01) 0.44±(0.02) 0.53±(0.02) V isit+T F IDF 0.51±(0.01) 0.48±(0.01) 0.56±(0.04) 0.56±(0.04) V isit+w2vSM S 0.51±(0.02) 0.48±(0.01) 0.57±(0.05) 0.57±(0.04) V isit+w2vP ubmed 0.51±(0.01) 0.49±(0.01) 0.54±(0.04) 0.54±(0.04) V isit+T F IDF +w2vSM S 0.51±(0.01) 0.48±(0.01) 0.56±(0.04) 0.56±(0.04) V isit+T F IDF +w2vP ubmed 0.49±(0.01) 0.47±(0.01) 0.54±(0.03) 0.51±(0.04)
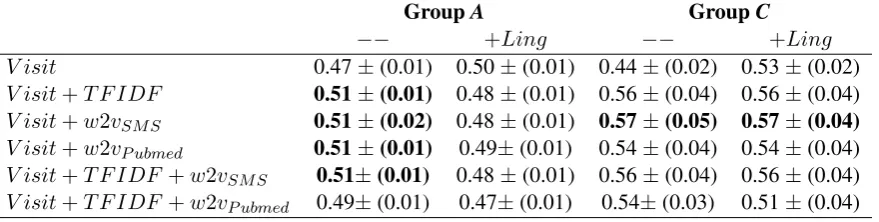
Table 3: MacroF1- scores on the logistic regression model for GroupAandC. We report the macroF1metric averaged over 5-fold cross-validation (with standard deviations in parentheses).
software3 provides little improvement, due to the domain-specific nature of the words. E.g., the message‘pls add prn pain med, not PO. thx’gets corrected to‘ls add pr pain mod, not PO. tax’. We provide examples of message header and message reply pairs in Table2.
We focus our experiments on Group A since it has the most amount of data, and on Group
C since it has the most number of messages per visit and the longest messages. We use the ADT (Admission/Discharge/Transfer) code in the pa-tients’ records to determine transfer to the ICU. A
mheaderis determined to have the outcome if an ICU transfer occurs within the next 3 days of the message send date (Table1).
3 Methods
For each text message, we include the patient’s age and gender, the total number of days spent in hos-pital at the time the message is sent4, their pre-scribed medication at the time of the message, and their diagnosis. The medication and diagnosis are encoded with one-word TF-IDF.
We then look at the following representations of text messages. For each representation, we use at most 20 words and zero-pad if necessary:
TF-IDF: We represent each text message with its TF-IDF representation. We experiment with word,n-gram, and character-level TF-IDF, as well as combinations. We use n-gram TF-IDF (n = 1,2,3) in our final models.
Word2Vec: We use 1) pre-trained word embed-dings (Mikolov et al., 2013) trained on publicly available PubMed articles (Moen and Ananiadou,
2013), as well as 2) our own word embeddings, trained on the text messages data. We train word
3
https://github.com/rfk/pyenchant 4this includes the number of days spent in the hospital frompreviousvisits
embeddings of dimension size 100, with a con-text window equal to 5 for training (Bojanowski et al., 2017). We explore different combinations of the text message word embeddings through concatenation, summing, and averaging. We re-port results using a combination of all three types. More specifically, we concatenate twenty 100-dimensional word embeddings (2000 dimensions), a sum of the word embeddings (100 dimensions), and an average of the 20 words (100 dimensions), for a total of 2200-dimensional feature vector. Linguistic features: We represent each text mes-sage as a vector containing 9 linguistic features. We compute lexical features (character and word count, word density5), syntactic features (counts of nouns, verbs, adjectives, and adverbs), and pos-itive and negative polarity extracted fromnltk’s sentiment analyzer (Loper and Bird,2002).
We use an ANOVA-based feature selection ( Pe-dregosa et al., 2011), and we train a logistic re-gression model. We report the macro F1 metric
averaged across 5-fold cross-validation.
4 Results
We experiment with Visit (i.e., age, gender, total number of days spend in hospital, medication, and diagnosis),TFIDF,Ling(i.e., linguistic),w2vSM S (i.e., word vectors trained on text messages), and w2vP ubmed (i.e., pre-trained word vectors from PubMed) features. When multiple text represen-tations are used (e.g., TF-IDF and w2v), we con-catenate them together. Typically, the addition of linguistic features does not seem to improve per-formance.
We then look at performance across data and report results in Table 4 on the logistic regres-sion model using visit information only, visit
fea-5
tures augmented with text message representations (w2vSM S, andT F IDF).
visit visit+wsms visit+tfidf
A 0.47 (0.01) 0.51 (0.02) 0.51 (0.01)
B 0.48 (0.01) 0.46 (0.07) 0.50 (0.01)
C 0.44 (0.02) 0.57 (0.05) 0.56 (0.04)
D 0.44 (0.03) 0.46 (0.07) 0.44 (0.04)
E 0.69 (0.28) 0.69 (0.28) 0.69 (0.28)
Table 4: Model performance across the different data.
F1macro results on a logistic regression model using 1) visit features only, and 2) visit features, word2vec embeddings (i.e.,w2vSM S) and 3) visit features,
TF-IDF features.
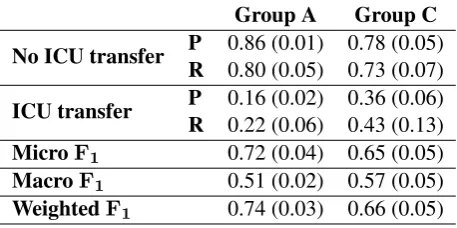
Our results indicate that the addition of informa-tion from text messages improves results in ICU transfer prediction three days before the event hap-pens. Our best results are in the model consisting of visit and word2vec features trained on our data (i.e.,w2vSM S). We look more closely at the per-formance of this model with this subset of features in Table5. As expected, the model does better on messages that don’t result in ICU transfer. We ob-tain recall of 0.22 and 0.43 in ICU transfer mes-sages for GroupsAandC, respectively.
Group A Group C
No ICU transfer P 0.86 (0.01) 0.78 (0.05) R 0.80 (0.05) 0.73 (0.07)
ICU transfer P 0.16 (0.02) 0.36 (0.06) R 0.22 (0.06) 0.43 (0.13) MicroF1 0.72 (0.04) 0.65 (0.05)
MacroF1 0.51 (0.02) 0.57 (0.05)
[image:4.595.308.524.194.468.2]WeightedF1 0.74 (0.03) 0.66 (0.05)
Table 5: Results for logistic regression model using Visit andw2vSM S.
5 Discussion
Table 4 shows that the addition of text message representations yields to improvements in Groups
A, B, C, and D. The greatest improvement in in Group C. The proportion of messages which are followed by an ICU transfer three days later is much higher in GroupC, which could reasonably explain the difference in performance. However, we also note that text messages in GroupC tend to be longer than other data, and that nurses in Group C send more messages per visit. Across all data, the best model performance is for Group
Ebut no improvement after adding text messages. However, it consists of the smallest number of messages and the highest variance in performance across validation folds. The ratio of messages which are followed by an ICU transfer in the next 3 days are 16.75%, 0.36%, 35.86%, 22.12% and 2.01% for GroupsA,B,C,D, andE, respectively (Table 2). The differences in performance could be attributed to the number of messages.
Word w2vSMS w2vPubmed
dr dr., doctor, md, resident, oncolo-gist
99:1, diastereos-electivities, ee, =98:2, 98:2 bld blood, bloood,
blod , frozen, pt.iv
whi, bldB, EPS-deficient, transposon-generated, A-factor-deficient med medication,
pill, lactulose, risperidone, hypoglycemics
Nicolae, Delores, Dres, habil., CSc.
bp b/p, bp=, bp-, bpm, pulse
nt, bps, nts, bp-long, bp-long icu msicu, emerg, er,
cvicu, gim
[image:4.595.72.301.426.540.2]bag/mask, Patient-initiated, extra-hospital, patient-cycled, airway-management
Table 6: Comparison of word embeddings. Top five similar words for common abbreviated medical terms. w2vSMSdenotes the word embeddings trained on our text message data andw2vPubmeddenotes the word embeddings trained on publicly available PubMed arti-cles.
Using word embeddings trained on our data per-forms better than the pre-trained ones. We dig deeper and report the top 5 similar words of some common medical terms in Table6. Word embed-dings trained on text messages do a much bet-ter job of capturing different spellings (e.g.,“bp”
and“b/p”) as well as common misspellings (e.g.,
“bloood”and“blod”). These results further high-light the need for context-specific word embed-dings (Chiu et al.,2016).
6 Conclusion & Future Work
mes-sage send date. We find that including mesmes-sages from information - through linguistic features, TFIDF features, and word vector representations -improves performance. This finding is consistent in 4 of the 5 datasets divided by institutional codes. The best performance was observed in the data with the most ICU transfers, the longest text mes-sages and the most text mesmes-sages per visit and per patient. We find that using word vectors trained on the text messages results in the best model perfor-mance, and a closer look shows that the embed-dings do a better job at capturing misspellings and abbreviations unique to text messages.
In future work, we want to investigate differ-ences across the data, and hope to identify key features of the text messages that are relevant in identifying ICU transfer. Other than that, we will also investigate the utility of adding the message replies, along with the message headers, as fea-tures. In this work, we have only looked at predic-tions for a given text message. Exploring how the prediction probabilities change over time would also be of interest. We will also consider differ-ent word embeddings (Peters et al., 2018), as we hypothesize that character-level word embeddings could better capture the unique vocabulary of text messages. To address class imbalance, we will ex-plore undersampling/oversampling methods such as SMOTE (Chawla et al.,2002). Furthermore, we want to look at the added value of text messages in a more complex set of features (i.e., lab results and vitals), as we believe that this would provide a complete picture of the patient’s visit profile.
Acknowledgments
Rudzicz is an Inaugural CIFAR Chair in Artificial Intelligence.
References
Piotr Bojanowski, Edouard Grave, Armand Joulin, and Tomas Mikolov. 2017. Enriching word vectors with subword information. TACL, 5:135–146.
Patrick W. Brady and Linda M. Goldenhar. 2014. A qualitative study examining the influences on situa-tion awareness and the identificasitua-tion, mitigasitua-tion and escalation of recognised patient risk.BMJ Qual Saf, 23(2):153–161.
Nitesh V. Chawla, Kevin W. Bowyer, Lawrence O. Hall, and W. Philip Kegelmeyer. 2002. Smote:
syn-thetic minority over-sampling technique. Journal of artificial intelligence research, 16:321–357.
Zhengping Che, Sanjay Purushotham, Robinder Khe-mani, and Yan Liu. 2016. Interpretable deep models for icu outcome prediction. InAMIA Annual Sympo-sium Proceedings, volume 2016, page 371. Ameri-can Medical Informatics Association.
Billy Chiu, Gamal Crichton, Anna Korhonen, and Sampo Pyysalo. 2016. How to train good word embeddings for biomedical nlp. In Proceedings of the 15th Workshop on Biomedical Natural Language Processing, pages 166–174.
Matthew M. Churpek, Trevor C. Yuen, Christopher Winslow, David O. Meltzer, Michael W. Kattan, and Dana P. Edelson. 2016. Multicenter comparison of machine learning methods and conventional re-gression for predicting clinical deterioration on the wards. Critical care medicine, 44(2):368.
Koen De Meester, M. Verspuy, Koen G. Monsieurs, and Peter Van Bogaert. 2013. Sbar improves nurse– physician communication and reduces unexpected death: A pre and post intervention study. Resusci-tation, 84(9):1192–1196.
Michael A. DeVita, Rinaldo Bellomo, Kenneth Hill-man, John Kellum, Armando Rotondi, Dan Teres, Andrew Auerbach, Wen-Jon Chen, Kathy Duncan, Gary Kenward, et al. 2006. Findings of the first consensus conference on medical emergency teams.
Critical care medicine, 34(9):2463–2478.
Jean-Baptiste Escudi´e, Alaa Saade, Alice Coucke, and Marc Lelarge. 2018. Deep representation for patient visits from electronic health records. arXiv preprint arXiv:1803.09533.
David W. Frost, Shankar Vembu, Jiayi Wang, Karen Tu, Quaid Morris, and Howard B. Abrams. 2017. Using the electronic medical record to identify pa-tients at high risk for frequent emergency depart-ment visits and high system costs. The American journal of medicine, 130(5):601–e17.
Joseph Futoma, Jonathan Morris, and Joseph Lucas. 2015. A comparison of models for predicting early hospital readmissions. Journal of biomedical infor-matics, 56:229–238.
Pierre Genev`es, Thomas Calmant, Nabil Laya¨ıda, Mar-ion Lepelley, Svetlana Artemova, and Jean-Luc Bosson. 2018. Scalable machine learning for pre-dicting at-risk profiles upon hospital admission. 12:23–34.
Edward Loper and Steven Bird. 2002. Nltk: The nat-ural language toolkit. InIn Proceedings of the ACL Workshop on Effective Tools and Methodologies for Teaching Natural Language Processing and Compu-tational Linguistics. Philadelphia: Association for Computational Linguistics.
Tomas Mikolov, Ilya Sutskever, Kai Chen, Greg S Cor-rado, and Jeff Dean. 2013. Distributed representa-tions of words and phrases and their compositional-ity. InAdvances in neural information processing systems, pages 3111–3119.
Riccardo Miotto, Li Li, Brian A. Kidd, and Joel T Dud-ley. 2016. Deep patient: an unsupervised represen-tation to predict the future of patients from the elec-tronic health records.Scientific reports, 6:26094.
SPFGH Moen and Tapio Salakoski2 Sophia Anani-adou. 2013. Distributional semantics resources for biomedical text processing. In Proceedings of the 5th International Symposium on Languages in Biol-ogy and Medicine, Tokyo, Japan, pages 39–43.
Fabian Pedregosa, Gael Varoquaux, Alexandre Gramfort, Vincent Michel, Bertrand Thirion, O. Grisel, M. Blondel, P. Prettenhofer, R. Weiss, V. Dubourg, J. Vanderplas, A. Passos, D. Courna-peau, M. Brucher, M. Perrot, and E. Duchesnay. 2011. Scikit-learn: Machine learning in Python.
Journal of Machine Learning Research, 12:2825– 2830.
Matthew E. Peters, Mark Neumann, Mohit Iyyer, Matt Gardner, Christopher Clark, Kenton Lee, and Luke Zettlemoyer. 2018. Deep contextualized word rep-resentations.CoRR, abs/1802.05365.
Alvin Rajkomar, Eyal Oren, Kai Chen, Andrew M Dai, Nissan Hajaj, Michaela Hardt, Peter J Liu, Xiaobing Liu, Jake Marcus, Mimi Sun, et al. 2018. Scalable and accurate deep learning with electronic health records.npj Digital Medicine, 1(1):18.
C.P. Subbe, M. Kruger, P. Rutherford, and L. Gemmel. 2001. Validation of a modified early warning score in medical admissions.Qjm, 94(10):521–526.
Ying P. Tabak, Xiaowu Sun, Carlos M. Nunez, Vikas Gupta, and Richard S. Johannes. 2017. Predicting readmission at early hospitalization using electronic clinical data: an early readmission risk score. Medi-cal care, 55(3):267.
Robert C Wu, Vivian Lo, Dante Morra, Brian M Wong, Robert Sargeant, Ken Locke, Rodrigo Cav-alcanti, Sherman D. Quan, Peter Rossos, Kim Tran, et al. 2013. The intended and unintended conse-quences of communication systems on general inter-nal medicine inpatient care delivery: a prospective observational case study of five teaching hospitals.
Journal of the American Medical Informatics Asso-ciation, 20(4):766–777.
Haijun Zhai, Patrick Brady, Qi Li, Todd Lingren, Yizhao Ni, Derek S Wheeler, and Imre Solti. 2014. Developing and evaluating a machine learning based algorithm to predict the need of pediatric intensive care unit transfer for newly hospitalized children.
Resuscitation, 85(8):1065–1071.