Accepted Manuscript
Title: Optimizing the use of on-street car parking system as a passive control of air pollution exposure in street canyons by large eddy simulation
Authors: J. Gallagher, L.W. Gill, A. McNabola
PII: S1352-2310(11)00006-9
DOI: 10.1016/j.atmosenv.2010.12.059
Reference: AEA 10134
To appear in: Atmospheric Environment
Received Date: 29 June 2010 Revised Date: 23 December 2010 Accepted Date: 31 December 2010
Please cite this article as: Gallagher, J., Gill, L.W., McNabola, A. Optimizing the use of on-street car parking system as a passive control of air pollution exposure in street canyons by large eddy simulation, Atmospheric Environment (2011), doi: 10.1016/j.atmosenv.2010.12.059
OPTIMIZING THE USE OF ON-STREET CAR PARKING SYSTEM AS A PASSIVE
1
CONTROL OF AIR POLLUTION EXPOSURE IN STREET CANYONS BY LARGE EDDY
2
SIMULATION.
3 4
J. Gallaghera,*, L.W. Gilla and A. McNabolaa.
5
a
. Dept of Civil, Structural & Environmental Engineering, Trinity College Dublin, Ireland.
6
* Corresponding author. Tel: +353 01 896 2781
7
Email address: gallagj2@tcd.ie
8 9
Abstract
10
An investigation was carried out to establish the effectiveness of parked cars in urban street canyons
11
as passive controls on pedestrian pollutant exposure. A numerical model of a generic street canyon
12
was developed using a large eddy simulation (LES) model to compare personal exposure on the
13
footpath with and without the presence of parked cars. Three configurations of car parking systems
14
were investigated (parallel, perpendicular & 45o parking) in addition to the influence of wind speed,
15
wind direction and car parking occupancy. A tracer gas (CO2) was used as a representative pollutant
16
from vehicular sources within the street canyon models. The results indicated that parked cars may
17
act as a temporary baffle plate between traffic emissions and pedestrians on the footpath. Reductions
18
in exposure of up to 35% and 49% were attained on the leeward and windward footpaths in
19
perpendicular wind conditions, with parallel winds allowing up to 33% pollutant reduction on both
20
footpaths for parallel parking. The perpendicular and 45o car parking configurations investigated
21
proved less successful as passive controls on air pollution exposure and an increase in pollutant
22
concentration occurred in some models. An investigation of parking space occupancy rates was
23
carried out for parallel parked cars. The fraction of parked cars influenced the level of reduction of
pollutants on the footpaths with steady reductions in perpendicular winds, yet reductions were only
1
evident for occupancy rates greater than approximately 45% in parallel wind conditions. One
2
negative impact associated with the parked cars study was the increase of pollutant levels on the
3
roadway as the parked cars acted as a baffle wall, which trapped pollutants in the road. The paper
4
underlines the potential of on-street car parking for reducing the personal exposure of pollutants by
5
pedestrians and the optimum parking layout to achieve maximum health protection.
6 7
Keywords: Street Canyon; Car Parking; Air Pollution; Passive Controls; LES.
8 9
1. Introduction
10
Air pollution in the urban atmosphere continues to receive a great deal of research focus in order to
11
address the various adverse impacts it has on climate change, the environment and on human health.
12
The transport sector has been shown to be responsible for a significant proportion of air pollution
13
emissions in the urban environment (O' Mahony et al., 2000). While the majority of commuters in
14
many western cities travel by private car, the next largest group are often pedestrians (DTO, 2004).
15
Indeed pedestrians globally represent one of the largest groups of commuters, a group that are often
16
omitted from investigations of commuter exposure (Kaur et al., 2007). In general, pedestrian
17
exposure to traffic air pollutants has been widely reported as being lower than other modes of
18
transport such as the private car, taxi, bus and cyclists (Taylor and Ferguson, 1997; McNabola et al.,
19
2008b). However, as this zero emissions form of transport does not contribute to urban air pollution,
20
efforts should be made to reduce their exposure to air pollutants further in order to encourage more
21
commuters to walk. Much international effort from governments to vehicle manufacturers is
22
underway to reduce emissions intensity and the overall CO2 emissions (ENCom, 2005; DCMNR,
23
2006) through the introduction of carbon based tax systems (Pearce, 1991; Giblin and McNabola,
2009), improvements in vehicle technology and increases in public transport usage. Research among
1
traffic engineers and urban planners is ongoing with a view to reducing congestion and emissions
2
through congestion charging and intelligent transport systems (Washbrook, 2002). The development
3
and implementation of alternative fuels has also aimed to reduce transport emissions. All of these
4
measures aim to reduce air pollution concentrations in the atmosphere to help combat climate
5
change, alongside minimising impacts on the environment and human health.
6 7
An approach which has focused purely on human health protection in recent years is that of passive
8
controls on air pollutant dispersion in urban street canyons (McNabola, 2010). This research
9
identified common physical urban features such as solid free standing walls, trees or bushes
10
(McNabola et al., 2008a; Buccolieri et al., 2009) to act as baffle plates, disrupting the normal
11
dispersion of air pollutants when located in street canyons. Passive controls can be configured in
12
street canyons in order to reduce air pollution exposure on footpaths through the manipulation of
13
natural dispersion patterns. McNabola et al. (2008a) carried out a combined monitoring and
14
numerical modelling study to highlight the role of an existing low boundary wall (LBW) in an urban
15
street in Dublin, Ireland. The LBW was situated between the roadway footpath and the pedestrian
16
boardwalk. The results of the study indicated greater exposure to PM2.5 and VOCs on the roadside
17
footpath compared to the boardwalk by factors of approximately 2.8 and 2.0, respectively. A generic
18
street canyon model with a centrally located LBW was found to yield reductions in pedestrian
19
exposure of up to 46% during perpendicular wind flow conditions and up to 75% during parallel
20
wind conditions. The percentage reduction achieved using LBWs was found to be unaffected by the
21
magnitude of the wind speed. A configuration consisting of two LBWs located adjacent to each
22
footpath was also investigated and predicted reductions in pedestrian exposure of up to 65% for
23
parallel wind conditions (McNabola et al., 2009).
1
Previous investigators have also examined the influence of avenue like tree planting on the
2
dispersion of pollutants in a typical street canyon using CFD and wind tunnel models. Overall, these
3
studies concluded that the in-canyon air quality can be significantly altered by avenue-like tree
4
planting in a canyon with a H/W of 1, which found an increase in concentrations at the leeward wall
5
and a moderate pollutant concentration decrease near the windward wall during perpendicular wind
6
conditions (Gromke et al., 2008; Buccolieri et al., 2009). These studies highlighted the H/W ratio as
7
the crucial parameter of pollutant dispersion compared to the density or porosity of the trees. Street
8
canyon geometry is therefore a crucial factor of air dispersion. Studies such as that of Santiago &
9
Martin (2005) identified the creation of multiple vortices in asymmetric street canyons. Further
10
studies similarly highlight the effects of geometry on the flow pattern and turbulence properties (Xie
11
et al., 2005; Liu et al., 2005; Di Sabatino et al., 2008)
12 13
Heist et al., (2009) investigated the effects of roadway configuration on pollutant dispersion,
14
identifying the recirculation of air flow due to noise barriers on either side of the road. This form of
15
passive control caused a reduction of ground level concentrations and an accumulation of pollutants
16
on the roadside of the barrier which extends downwind of the pollutant source. The development of
17
a pedestrian ventilation system in high rise urban canyons poses as another method of air exchange
18
and enhanced mixing between pollutants at ground level with clean air at roof level. The system
19
utilises the urban heat island created across the canyon floor and the thermal stratification common
20
to high rise canyons to promote natural and forced convection which provides the pressure gradient
21
for a vertical duct system (Mirzaei and Haghighat, 2010).
Within this framework, the present study focuses on the potential of on-street parked cars to act as a
1
passive control on air pollutant dispersion in a similar manner to that of previous investigations into
2
LBWs, noise pollution barriers, road design and avenue trees. By developing numerical models of
3
typical urban street canyons using the commercial CFD software code Fluent 6.3 (Fluent, 2008), the
4
potential percentage reductions in pedestrian exposure was investigated for different on-street car
5
parking configurations. The investigation examined the potential reductions achievable using
6
parallel, perpendicular and 45o parking configurations as passive controls. The impact of car space
7
occupancy was also investigated as were the impacts of wind speed and wind direction.
8 9
The methodology section to follow outlines the modelling requirements and procedures for the
10
different cases investigated. The results section identifies the outcome of each of the individual
11
cases and the subsequent car space occupancy modelling study. A detailed analysis of the results
12
was carried out in the discussion section with the main conclusions drawn from this section to
13
conclude the paper for the context of future urban planning strategies. The results of this paper
14
inform those in urban planning and public policy makers on the optimum urban street canyon
15
layout, incorporating an on-street car parking regime while improving air quality on footpaths.
16
Implementation of the findings presented herein will help to promote healthy living and improve
17
human health for pedestrians.
18 19
2. Methodology
20
This study comprised four numerical tests to assess the potential of on-street parking as a passive
21
control on air pollutants in urban street canyon. The first three series of tests investigated the
22
percentage reduction in pedestrian exposure to the tracer pollutant (CO2) as a result of three different
23
car parking configurations in a street canyon with a height to width ratio (H/W) = 1.0 for scenarios
of varying inlet velocity wind speeds (2, 4, 8 & 16m/s) and direction (0o & 90o). Two sets of models
1
were constructed for each scenario; the first was a reference model containing no parked cars and
2
the second was an identical model containing cars parked parallel to the footpath on both sides of
3
the road. The personal exposure of pedestrians in both models was then compared to yield the
4
percentage difference between the two models. The three tests included Case 1, which investigated
5
parked cars parallel to the footpath, Case 2 investigated cars parked perpendicular to the footpath
6
and Case 3 carried out an identical evaluation for cars parked at 45o to the footpath. Figure 1(a)
7
displays the generic model dimensions to maintain a H/W ratio of 1.0 and the dimensions of the
8
medium-sized car (1.7 x 4.6 x 1.8m high) used in the models are illustrated in Figure 1(b). The
9
roadway consisted of two 4m wide traffic lanes with two-directional traffic, two 3m footpaths and
10
two parking bays on both sides of the road with varying width for each of the three cases.
11 12
Figure 1, (a) model geometry cross-section through generic street canyon model, (b) dimensions of
13
medium-sized car (all dimensions in metres).
14 15
Following an assessment of the results of the first three cases the optimum car parking configuration
16
for passive control of air pollutants was selected and further investigated whereby the impact of
17
varying car parking occupancy rates were examined in Case 4. This investigation of different
18
occupancy rates determined the effect of different percentages of car parking spaces occupied at any
19
one time. A comparison of low versus high occupancy rates was then made to determine their
20
associated positive or negative impacts on pollutant dispersion and their ability to improve air
21
quality on the footpath. The occupancy rates were chosen to identify any pattern or relationship
22
between the rate of pollutant reduction and the fraction of car parking spaces not occupied.
2.1 Numerical Modelling
1
The solver used to simulate the turbulent flow of air in the street canyon models was the large eddy
2
simulation (LES) model. The modelling of the dispersion of air pollutants using CFD has been
3
carried out by previous investigators commonly using either the k-ε turbulent model or the LES
4
model (Ning et al., 2005; Tsai and Chen, 2004). The LES model was used here rather than k-ε due
5
to a more complex geometry from the typical street canyon in the region of the parked cars at street
6
level (So et al., 2005). Several studies have evaluated the LES models to simulate air flow and
7
pollutant dispersion in urban canyons and found that a strong agreement between the CFD models
8
and wind tunnel experiments (Baker et al., 2004; Liu and Barth, 2002).
9 10
Turbulent flows are characterised by eddies with a wide range of length and time scales. The largest
11
eddies are typically comparable in size to the characteristic length of the mean flow. The smallest
12
scales are responsible for the dissipation of turbulence kinetic energy. The quantities of momentum,
13
mass, energy, and other passive scalars are transported mostly by large eddies. Large eddies are
14
more problem-dependent, they are dictated by the geometries and boundary conditions of the flow
15
involved. Small eddies are less dependent on the geometry, tend to be more isotropic, and are
16
consequently more universal. As a result in LES, large eddies are resolved directly, while small
17
eddies are modelled. LES modelling uses a filtered Navier-Stokes equation and is suitable for more
18
complex geometries than the k-ε model but is more computationally expensive. The complete
19
system of the LES model is given in Equations 1 to 4 below:
20 0 ) ( = ∂ ∂ + ∂ ∂ i i u x t ρ ρ
, (1)
21
Where ρ is the density of the fluid and u is the velocity and:
[
]
j ij i j ij j j i j i x x x x u u x u t ∂ ∂ − ∂ Ρ ∂ − ∂ ∂ ∂ ∂ = ∂ ∂ + ∂∂ ρ ρ µ σ τ
) (
)
( , (2)
1
Where µ is the viscosity of the fluid and P is the pressure; σij is the stress tensor due to molecular
2
viscosity, given below; τij is the subgrid-scale stress given below:
3 ij l l i j j i ij x u x u x
u µ δ
µ σ ∂ ∂ − ∂ ∂ + ∂ ∂ = 3 2 (3) 4 5 j i j i
ij ρuu ρuu
τ = − (4)
6
7
The airflow in the model was simulated from the flow of air over the top of the buildings and at
8
either end of the street section by the velocity inlets, according to the wind speed and direction
9
selected. The dispersion of the tracer gas in the turbulent air stream from traffic was simulated by
10
releasing concentrations of the gas at the street level along the roadway surface.
11 12
2.2 Modelling Setup & Procedure
13
The generic canyon models were constructed using Gambit v2.3, a CFD model development and
14
meshing tool as shown in Figures 1 & 2. The surfaces of the canyon floor, buildings and vehicles
15
were constructed as wall boundaries to resemble the impermeable nature of their characteristic
16
materials. Additional faces of the model were constructed as atmospheric boundaries where air
17
either entered or escaped from the canyon model. The property of a pressure outlet was attached to
18
all atmospheric surfaces where air escaped the canyon and a velocity inlet was attached to any face
19
where air entered the canyon. Each model was constructed with a H/W ratio of 1 to maintain a
20
similar shaped primary eddy for each model. The road lane and footpath widths remained constant
in all of the models, with a varying parking bay width in each model case. This created a canyon of
1
different width in each of the three case models. The width of the roadway was kept the same to
2
maintain a similar emissions rate in each model and a constant footpath width was important to
3
compare the pollutant concentration on the footpath in each case. The model was extended above
4
the rooftop of the buildings by a height of H/2 to allow for air flow entering or exiting the canyon
5
above the buildings.
6 7
Figure 2, Generic street canyon layout for Cases 1-3 with H/W of 1.
8 9
Tominaga et al. (2008) advises a grid discretization test prior to proceeding with a modelling study
10
to ensure accurate results. Therefore, a sensitivity test was carried out to obtain the optimum mesh
11
type and size in terms of model prediction accuracy and computational timeframe requirements.
12
Three grid schemes were assessed where the mesh was configured with a high density on the canyon
13
floor decreasing to a lower density above roof top level as the canyon floor was the location of
14
interest. The sensitivity test varied the mesh dimensions with triangular mesh elements of 0.4 and
15
0.6m on the canyon floor and the rest of the volume with either a 1.0 or 2.0m tetrahedral mesh. The
16
largest floor mesh of 0.6m was considered unsuitable due to the minimum spacing of 0.4m between
17
vehicles in the parked car models. The 0.4m floor mesh provided a strong agreement in results for
18
both volumetric meshes; therefore the large 2.0m mesh was chosen to optimise computational
19
requirements. The floor of the canyon model was meshed with 0.4m spaced triangular mesh
20
elements in a paved grid configuration with the overall model frame subsequently meshed with a
21
2.0m tetrahedral mesh. The minimum requirements for grid geometry set out by the COST Action
22
732 were adhered to for the construction of the CFD models (COST Action 732, 2005; Franke et al.,
2007). Franke et al. (2007) advised a minimum of two grid nodes between a solid surface and a
1
monitoring point, which improved the accuracy of monitoring predictions.
2 3
Emissions of the tracer gas (CO2) were released from the road surface at ground level (i.e. Z = 0) in
4
each model at a fixed generic emissions rate of 1 x 10⁻⁵ kg/s as shown in Figure 2. The CO2 acts as
5
an indicator pollutant to assess the dispersion of any pollutant common to an urban street canyon
6
and as an indicator pollutant it has no health effects within the canyon. A comparative study was
7
carried out to compare CO2 (44.01 g/mol) with a validated tracer gas, C2H6 (30.07 g/mol) to justify
8
the use of the gas in the models (Moryń-Kucharczyk and Gnatowska, 2007; Shao and Riffat, 1994;
9
Heist et al., 2009). A 94% agreement was observed between the results for the comparative study,
10
which was deemed satisfactory in assessing the pollutant concentration on canyon footpaths. The
11
dispersion of the tracer gas within the reference and parked cars model utilises the species transport
12
and reaction equations to predict the flow emitted from road surface. The road boundary face was
13
oriented parallel to the horizontal axis and acted as the emissions surface in all models for the mass
14
fraction of the tracer gas. The continuous release of the tracer pollutant was attached to the road
15
surface to replicate an uninterrupted flow of vehicle emissions across the road the road surface area.
16
Each model was run using the large eddy simulation (LES) model for varying durations of time until
17
each model converged. The LES model was selected as a high level of geometrical complexity
18
existed within the domain of the canyon models. A default value was taken for the turbulence
19
intensity at 10% in the velocity inlet properties of the models. Each model was run for several
20
hundred time steps with 100 iterations per time step. Convergence was deemed adequate when the
21
model reached a steady state value when compared to a minimum moving average value of 50-100
22
time steps. Vehicular turbulence was simplified in the models to reduce the computational running
23
time of the CFD models. Due to the generic layout of the models and the use of similar surface
emissions in each model, the results of the study provided accurate evidence of the optimum car
1
parking layout to reduce emissions of adjacent footpaths.
2 3
2.3 Cases 1-3: Parallel, Perpendicular and 45° Parking
4
Each modelling investigation comprised two nearly identical models which differed by the absence
5
of parked cars in the reference case. Figure 2 shows the cross section of the generic street canyon
6
layout. Each model comprised a street canyon with a H/W ratio of 1.0, with the canyon width (Wc)
7
equal to the building height (Hb) on both sides of the symmetrical canyon. The roadway was divided
8
by two 4m wide traffic lanes, two 3m footpaths and two parking areas of width, Pw on either side of
9
the street canyon. The measurements for preparing the individual case studies, in conjunction with
10
Figure 2 are shown in Table 1. In the reference model the car parking area were empty while in the
11
parallel parking model, medium-sized cars were positioned into each space on both sides of the
12
street until no empty parking spaces were available (i.e. occupancy = 100%).
13 14
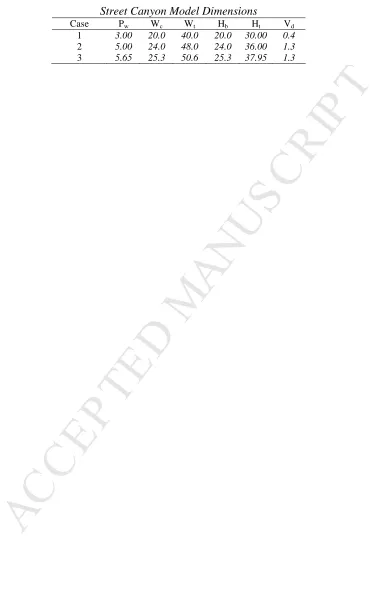
Table 1 – Cross sectional dimensions for Cases 1-3 models (all dimensions in metres).
15 16
The spacing between vehicles varied for each modelling study and this is represented by the value of
17
perpendicular vehicle distance (Vd) in Table 1. Figure 3 shows the plan and side view layouts for the
18
three parked car layouts investigated in this study.
19 20
Figure 3, Plan and side view of geometry for Cases 1-3 of parked car configuration.
21 22
A monitoring line was inserted into each model at a height of 1.76m, to represent the path of a
23
pedestrian walking the full length of the canyon at the centre of each footpath. The data output from
each monitoring line recorded the area weighted average of the pollutant concentration across the
1
entire line every second. A result was obtained for each model by taking an average value from the
2
output data from the models where a steady was observed in the monitoring path lines. Once
3
concentrations in the canyon had reached a steady state, the mean difference in exposure between
4
the reference and parked car models was then calculated from the data and expressed as a
5
percentage reduction of the mean reference exposure concentration. The models were solved for
6
scenarios of varying wind speed and direction and the average pedestrian exposure concentrations
7
along the centre of both footpaths was monitored over time. Figure 4 shows a typical model output
8
for the personal exposure of the tracer gas and the difference in pollutant concentrations between the
9
parked cars model and the reference case. In this particular example the difference between the
10
personal exposure to the pollutant on the leeward footpath between the two models was negative i.e.
11
personal exposure to an air pollutant was reduced due to the presence of parked cars. Expressing this
12
as percentage reduction over the reference case places this reduction in exposure into a format
13
suitable for comparison to other car parking systems.
14 15
Figure 4, Determining the percentage reduction in CO2 pedestrian personal exposure achieved using
16
parked cars in Case 1 compared to the reference model (leeward footpath; wind speed = 16m/s;
17
wind direction = 90o).
18 19
2.4 Case 4: Parking Space Occupancy
20
Based on the outcome of the modelling results for the three parked car studies, Case 1 was chosen
21
for further analysis as a reduction in pollutant concentration was evident for all model scenarios of
22
different wind directions and velocities. This part of the modelling study investigated the
23
relationship of pollutant reduction for different car occupancy rates in the parking bays. The number
of cars parked on the 200m stretch of road modelled in Case 1 amounted to 40 cars on each side of
1
the street in comparison to a full capacity of 66 and 39 on both sides of the street for the Case 2 and
2
Case 3 models, respectively. A range of suitable occupancy rates were selected to allow an even
3
number of cars to remain in each model. The occupancy rates chosen were 10%, 25%, 50%, 75%,
4
90% and 100% and were to be compared to the reference model with an occupancy rate of 0%.
5
Using a random number generation tool in Microsoft Excel, the selection of vehicles in the parking
6
bays to be removed was carried out at random. This allowed the selection process for creating the
7
different occupancy rate models to be carried out in an unbiased manner. The cars on the leeward
8
and windward sides of the canyon were numbered 1 to 40. The Excel tool chose a random number
9
between 1 and 40 corresponding to a vehicle in the model to be removed. This process was repeated
10
until a number of vehicles in the model were removed to match the desired occupancy rates e.g. 4
11
out of 40 vehicles were removed to correspond to a 90% occupancy rate. This random number
12
generator was used for the leeward and windward sides of the canyon separately, to replicate the
13
random pattern that would be normal in a canyon with car parking. Case 4 investigated these
14
occupancy rates for the same conditions as the previous cases, namely the range of wind speeds,
15
wind directions and the CO2 emissions rate of 1 x 10⁻⁵ kg/s released from the roadway.
16 17
3. Results
18
3.1 Case 1: Parallel Parking
19
The results of the Case 1 investigation for parallel parked cars are presented in Table 2. The data
20
show that for a perpendicular wind flow the presence of parallel parked cars provides a reduction in
21
pedestrian exposure compared to the absence of parked cars of up to 35% on the leeward footpath
22
and up to 49% on the windward footpath. For a parallel wind direction, a symmetrical layout was
23
constructed for Case 1, as the average concentration for the leeward and windward footpaths was
determined to be the same for the reference and parallel car model. The average reduction in
1
pedestrian exposure was found to be up to 33% in the parallel wind models. The differences
2
between pollutant concentrations for low and high wind speeds amounted to a maximum of 4% for
3
parallel and perpendicular wind conditions.
4 5
Table 2 – Case 1 percentage reduction data.
6 7
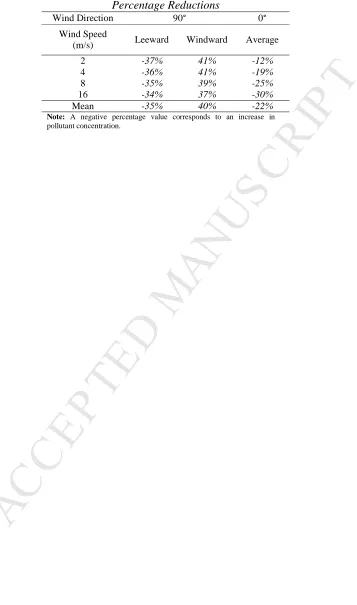
3.2 Case 2: Perpendicular Parking
8
Table 3 displays the results of the Case 2 investigation for perpendicular parked cars. A combination
9
of positive and negative results was identified in Case 2, as numbers with an associated negative
10
sign constituting an increase to the measured pollutant levels between models. The data shows that
11
the presence of perpendicular parked cars provided a decrease in pollutant concentration of up to
12
41% on the windward footpath and an average increase of up to 37% on the leeward footpath. The
13
increase in wind speed incurred a small deviation of up to 4% of the pollutant concentration for
14
perpendicular winds. In parallel wind conditions, an average increase in pedestrian exposure of up to
15
30% on both footpaths was found between the reference and perpendicular car models. A significant
16
difference of 18% in pollutant reduction was also noted between low and high wind speeds,
17
suggesting the influence of wind was more significant in parallel wind conditions.
18 19
Table 3 – Case 2 percentage reduction data.
20 21
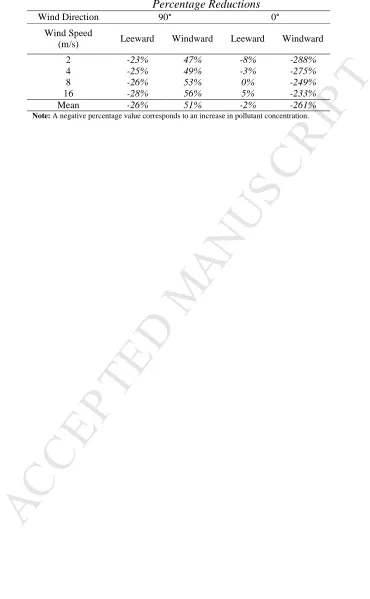
3.3 Case 3: 45o Parking
22
Table 4 presents the results of the Case 3 investigation for 45o parking cars. Increases in pollutant
23
concentrations were observed in some of the parked car models in Case 3. These increases are
represented as negative reductions in Table 3 in a similar manner to the previous case results. For a
1
perpendicular wind flow, the data shows that the introduction of 45o parked cars causes an average
2
increase in pedestrian exposure compared to their absence of up to 28% on the leeward footpath.
3
Pollutant reduction was observed on the windward footpath of up to 56% for perpendicular winds.
4
Due to the 45o parking configuration, a symmetrical layout was not present in the canyon and
5
therefore separate results were attained for both the leeward and windward footpaths in parallel
6
wind conditions. The presence of parked cars was found to provide an increase in pedestrian
7
exposure compared to their absence on average of 2% on the leeward footpath and a significant
8
increase of up to 288% on the windward footpath with parallel wind conditions. The difference in
9
pollutant concentration with a change in wind speed was noted to be most significant for parallel
10
winds in the canyon.
11 12
Table 4 – Case 3 percentage reduction data.
13 14
3.4 Case 4: Parking Space Occupancy
15
The occupancy rate of the parking bays on either side of the road was considered to be influential to
16
the level of reduction of the pollutant concentration on the adjacent footpaths. From Case 1, a
17
reduction of up to 33% was observed between the reference models and the 100% occupancy
18
models for parallel wind conditions. From Figure 5, an initial increase of pollutant concentration
19
occurred from 0% to 45% parking space occupancy, which was followed by an incremental
20
reduction in pollutant levels for subsequent increasing occupancy rates. The results show an
21
influence of wind speed on pollutant reduction with respect to low occupancy rates, with the pattern
22
of the plot indicating this effect was not substantial for higher occupancy rates.
Figure 5, Plot of average footpath pollutant concentration versus occupancy rates for a Case 4
1
model in parallel wind conditions.
2 3
The plots of occupancy rate against the average pollutant exposure reduction for a prevailing wind
4
perpendicular to the canyon are displayed in Figures 6 and 7. The results indicate a relationship
5
between the occupancy rates of cars in the parking bays to the percentage reduction of pollutant
6
concentrations for all wind speeds. The figures show an overall reduction in pollutant concentration
7
as the occupancy rate was increased on both footpaths for perpendicular winds. The pollutant
8
concentrations on the leeward side of the canyon are influenced by the occupancy rates of the
9
adjacent parking bay. From observations of Figure 7, an exponential reduction in pollutant levels
10
was found across all occupancy rates from 0% to 100%, with the most significant reduction evident
11
between the 90% and 100% occupancy rates. A similar pattern was observed for each wind speed,
12
suggesting that it has no significant impact on the reduction of pollutants.
13 14
Figure 6, Plot of average leeward footpath pollutant concentration versus occupancy rates for a
15
Case 4 model with perpendicular wind conditions.
16 17
The plot of the windward footpath data, as shown in Figure 7, presents a visible sigmoid or s-curve.
18
This plot identified a negligible difference between occupancy rates ranging from 0% to 10% and
19
from 90% to 100%. A curvilinear relationship was found between occupancy rates of 10% to 90%
20
with an overall steady decrease in pollutant concentration between the different occupancy rates
21
modelled in this study.
Figure 7, Plot of average windward footpath pollutant concentration versus occupancy rates for a
1
Case 4 model with perpendicular wind conditions.
2 3
4. Discussion
4
4.1 Case 1: Parallel Parking
5
Despite the fact that the parallel parked cars present a temporary non-continuous boundary between
6
the footpath and traffic emissions, while parked at full occupancy, significant reductions in
7
pedestrian exposure were found. In this study, large and consistent reductions in exposure were
8
found for both wind directions. An explanation for the reductions created by parked cars in
9
comparison to boundary walls include the fact that despite the presence of gaps between the cars, in
10
cross section they present a much wider and taller boundary than the solid wall investigated by
11
studies such as McNabola et al. (2009). Pollutants emitted at road level are presented with a much
12
longer pathway between source and receptor as they must travel a larger distance around, over or
13
under the cars, resulting in a greater degree of pollutant dispersion. Figure 8, shows a plot of the
14
pattern of air flow through the canyon and the dispersion of the tracer pollutant in a reference and
15
parked cars model. The plots illustrate the resultant velocity vectors of the molar concentration of
16
the tracer gas (CO2) in kmol/m3.
17 18
Figure 8, Resultant velocity vectors plot for the concentration of CO2 tracer emissions for a 4m/s
19
perpendicular wind in Case 1 for (a) reference model without parked cars and (b) model with
20
parallel parked cars.
21 22
Previous investigations have shown the height of a boundary wall has a significant influence on its
23
effectiveness as a passive control on air pollutant dispersion (King et al., 2009) and parked cars
present a boundary which was typically higher than most boundary walls in urban areas (waist
1
height versus shoulder height in broad terms). For a perpendicular wind, the parked cars alter the air
2
flow in the canyon in a similar fashion to boundary walls. Figure 9 illustrates the direction of air
3
flow for a primary vortex and a secondary vortex within the canyon in perpendicular wind
4
conditions. The plot identifies the direction that air flows through the canyon and which pollutants
5
are carried from the road towards the leeward side of the canyon. Secondary vortices were created
6
on both footpaths in the canyon. As air enters the canyon on the windward side of the street, this
7
clean air is circulated on the windward footpath. The combination of this clean air and the parallel
8
parked cars acting as a baffle wall improve the air quality on the windward footpath and reduce the
9
pollutant concentration by up to 49%. The boundary created by the parallel parked cars reduces
10
pollutant levels on the leeward footpath by up to 35% with only a small decline in the level of
11
pollutant reduction for increasing wind speeds. The rate of reduction was not as significant on this
12
footpath as the primary vortex carries pollutants towards the leeward footpath and secondary
13
vortices located in this region causes mixing with the clean air. Small wind channels are also created
14
on the leeward footpath as the air travelling through the 0.4m spacing between vehicles. This air
15
diverges when it reaches the footpath; producing additional secondary eddies as the air spreads both
16
clockwise and anti-clockwise. The increase in wind speed incrementally decreases the percentage
17
reduction of the parked cars on the leeward footpath. This decrease was due to the higher wind
18
speeds increasing the penetration of pollutants into the leeward footpath, reducing the fraction of
19
pollutants that escape to the canyon floor in less active flow scenarios. The parked cars provide a
20
baffle wall in parallel wind conditions to reduce the pollutant concentration by up to 33%. The wind
21
speed does not make a significant difference to the potential reduction of pollutants between the
22
reference and parked car models in both wind velocities.
Figure 9, Resultant velocity vectors plot for the concentration of CO2 tracer emissions in street
1
canyon for a Case 1 model in perpendicular wind conditions.
2 3
4.2 Case 2: Perpendicular Parking
4
The perpendicular parked car model reduced pollutant concentrations in a similar manner to Case 1,
5
and presents a much wider parking bay than the parallel parked cars. The spacing between vehicles
6
was 1.3m in width, and this void contributes to approximately 43% of the total canyon length. The
7
effect of this large void space for the perpendicular parked cars configuration reduces the potential
8
for pollutant reduction compared to Case 1. Larger pathways for emissions are presented by greater
9
voids between vehicles to travel between the road and the footpaths in Case 2. The alignment of the
10
perpendicular parked car promotes pollutant flow towards the footpath as the wind flows over the
11
car with more ease to the parallel parked cars layout for perpendicular wind conditions. The increase
12
on the leeward side identifies the reduced effectiveness of the perpendicular parked car layout, as
13
the large void spaces give rise to an increase in pollutant levels of up to 37%. The increase in
14
pollutant concentrations was incremental to the reduction of the wind speed, as higher wind speeds
15
promotes some improved dispersion in the large voids between the cars and reduces the time taken
16
for pollutants to escape upwards towards roof level. The larger spacing width of cars in the Case 2
17
layout reduces their effectiveness as a baffle wall in comparison to Case 1, leading to an increase in
18
pollutants travelling from the road to the footpath. A reduction of up to 41% on the windward sides
19
gives evidence that the perpendicular parked cars can act as an effective baffle wall for pollutants
20
travelling against the natural flow of air through a canyon for perpendicular wind conditions. The
21
direction and spacing of perpendicular parked cars promotes increased turbulence and transport
22
pathways for pollutants to disperse across the footpaths in parallel wind conditions. This large void
23
spacing induces an increase of pollutant levels on both footpaths ranging from 12% to 30% for low
to high wind speeds, respectively. An increase in wind speed enhances mixing of pollutants in the
1
canyon and increases their penetration into the footpath zones, reducing the effectiveness of the
2
perpendicular parked car in parallel wind conditions. The increase in pollutant concentration in Case
3
2 in comparison to the reduction in Case 1 highlights the influence of car spacing widths on
4
pollutant penetration from the road to the footpath. Figure 10, shows the resultant velocity vector
5
plot of the concentration of the tracer pollutant to compare the typical dispersion patterns between
6
the perpendicular parked cars and reference models.
7 8
Figure 10, Resultant velocity vectors plot for the concentration of CO2 tracer emissions for a 4m/s
9
perpendicular wind in Case 2 for (a) reference model without parked cars and (b) model with
10
perpendicular parked cars.
11 12
A reduction of the spacing between perpendicular parked cars would improve the potential of the
13
perpendicular layout as a passive control. However, this solution may not be feasible as a reduction
14
in spacing would not allow sufficient width for car occupants to get into or exit their cars with ease.
15 16
4.3 Case 3: 45o Parking
17
In Case 3, the 45o parked car configuration provides an alternative layout to the conventional
18
parallel and perpendicular parking cases. It requires the widest parking bay in comparison to the
19
Cases 1 and 2, and it disturbs the natural flow of air for both parallel and perpendicular wind
20
conditions. However, 45o parking is considered the safest layout due to the ability for a pedestrian to
21
scan for oncoming traffic and the driver to see a pedestrian much earlier than with other parking
22
configuration (Berger, 1975; Retting et al., 2003). An increase in pollutant levels of up to 28% was
23
found on the leeward footpath, due to the channelling of the pollutants from the road to the footpath.
The diagonal parking layout provides the largest decrease in pollutant concentrations on the
1
windward footpath, up to 56%. Higher wind speeds caused small increases of pollution on the
2
leeward footpath and small decreases on the windward footpath for perpendicular wind conditions.
3
The largest increase and decrease in pollutant concentrations on the leeward and windward
4
footpaths, respectively, are due to the increased dispersion due to the 45o parked cars manipulating
5
the natural flow path of air through the canyon. In parallel wind conditions, the 45o parked cars
6
channels the wind to flow from the road to the windward footpath, significantly increasing the
7
pollutant concentration by as much as 288%. The opposite effect was observed on the leeward
8
footpath, as the 45o parked cars promote air flow away from the leeward zone. The increase of wind
9
speed in the 45o parking models increases the dispersion of pollutants and reduces the fraction of
10
pollutants that penetrate the parked car boundary into the windward footpath. The dispersion pattern
11
of a reference and parked car model for Case 3 is shown in Figure 11 as a resultant velocity vector
12
plot of the concentration of the tracer pollutant. The increase of wind speed influences the flow and
13
spatial distribution of pollutants by reducing the effectiveness of the parked cars on the windward
14
footpath and inversely improving air quality on the leeward footpath.
15 16
Figure 11, Resultant velocity vectors plot for the concentration of CO2 tracer emissions for a 4m/s
17
perpendicular wind in Case 3 for (a) reference model without parked cars and (b) model with 45o
18
parked cars.
19 20
4.4 Case 4: Parking Space Occupancy
21
The results of the car occupancy study identified different patterns of pollutant penetration on the
22
leeward and windward footpaths for the parallel parked car layout of Case 1. Relationships were
23
identified between the number of parked cars and the potential reduction of pollutants on both
footpaths. In parallel wind conditions, an increase in pollutant concentration on the adjacent
1
footpaths was identified for occupancy rates of 10% and 25%, with a relatively steady reduction
2
occurring from 25% to full occupancy of 100%. The increase in pollutant concentration for low
3
occupancy rates was due to the influence of individual cars directing pollutants towards the footpath
4
and promoting mixing with the clean air on the footpath and the polluted air from the road. This
5
indicates a negative effect that low occupancy rates can have for urban pedestrians, as pollutant
6
levels can be increased by low fractions of parked cars in street canyons. As discussed in Case 1, the
7
parked cars trap clean air from roof level along the windward footpath and increase dispersion on
8
the leeward footpath.
9 10
Figure 12 is a velocity vector plot of the concentration of the trace pollutant and shows the pollutant
11
dispersion across the canyon floor for a 25% and 75% occupancy rate with perpendicular wind
12
conditions. From visual comparison of the two cases, larger pathways are identified in the lower
13
occupancy model compared to the high occupancy model with less direct pathways for pollutants to
14
travel from the road to the footpath. On both footpaths, lower occupancy rates created wider
15
pathways from the pollutant source on the road to the footpath. In parallel wind conditions small
16
wake zones are created after the vehicle, reducing the spacing effect between them. However, with
17
reduced occupancy rates, the wake zone provides reduced aid in maintaining the baffle wall effect
18
and minimises the reduction of pollutants travelling from the road to the footpath. The change in
19
occupancy rate on the leeward side on the canyon proved to have an exponential relationship from
20
full parked car occupancy of 100% to an empty parking bay with a 0% occupancy rate. Low
21
occupancy rates provided very little reduction in pollutant levels, compared to the greater fraction of
22
reduction which occurred with occupancy rates greater than 75%. A s-curve pattern was evident in
23
the plot of occupancy rates against the percentage pollutant reduction. The penetration of pollutants
on the windward footpath was not significant between low and high occupancy rates i.e. between
1
0% to 10% and 90% to 100%. However, a curvilinear pattern of pollutant reduction was observed
2
between an occupancy rate of 10% and 90%. The plots of occupancy rates against the percentage
3
pollutant reduction do not identify any significant influence of changes in wind speed.
4 5
Figure 12, Resultant velocity vectors plot for the concentration of CO2 tracer emissions of a Case 4
6
model with a 4m/s perpendicular wind for (a) 25% occupancy rate and (b) 75% occupancy rate.
7 8
In each of the case models, a detrimental increase in pollutant concentration was identified in the
9
roadway as the parked cars acted as a baffle wall and impedes pollutants in the road. This was
10
considered an unavoidable impact of parked cars as a passive control, which aims to protect
11
pedestrian welfare.
12 13
5. Conclusions
14
The results of this parked car study highlights the potential benefits of a parking bay in street
15
canyons acting as a baffle wall to control pollutant flow and improving air quality on pedestrian
16
footpaths. Parallel parked cars (Case 1) provided the best overall option in comparison to its two
17
counterpart layouts as a rate of reduction was evident in all model scenarios, with a minimum
18
reduction of 31% and up to 49% in varying wind conditions. Reductions and increases in pollutant
19
concentrations were observed on the footpaths in the perpendicular and 45° parked car models.
20
Wind speed provided no significant influence to improve the percentage reduction of pollutants on
21
the footpaths for either wind directions in any of the three cases. Due to the results of the parked car
22
cases, parallel parked cars provided the most suitable option for further investigations of car space
23
occupancy rates. The investigation of different occupancy rates found that low occupancy rates can
be detrimental to pollutant levels on the footpaths in parallel winds. In perpendicular wind
1
conditions, exponential and sigmoidal patterns of reduction were observed for increased occupancy
2
rates on the leeward and windward footpaths, respectively.
3
4
This study does not take into account the factor of the time and subsequent contribution to urban air
5
pollution associated with a driver seeking an empty parking area. Full parking occupancy commonly
6
occurs at peak vehicle and pedestrian traffic times, allowing the high occupancy rates to maximise
7
the reduction of pollutants on the footpath and improve pedestrian health. Further modelling studies
8
to investigate road layout modifications and mechanical dispersion by vehicles would be beneficial
9
to assess the potential of parked cars acting as a passive control for air pollutants.
10 11
This investigation demonstrates the benefits of on-street car parking to reduce pedestrian personal
12
exposure on footpaths, highlights the optimum parking layout in different prevailing wind
13
conditions and the effects of parking occupancy rates to achieve maximum pollutant reduction. The
14
findings can be used to modify current car parking regimes in urban canyons to reduce the potential
15
pathways for pollutants from the road to the footpath, based on the knowledge of the optimum
16
parking configuration and prevailing wind directions. The results obtained in this study can be
17
incorporated into future urban planning strategies for the protection of pedestrian health.
18 19
Acknowledgements
20
The authors would like to thank the programme for research and training in third level institutions
21
(PRTLI 4) for funding this research.
22 23
References
Baker, J., Walker, H. L. & Cai, X. 2004. A study of the dispersion and transport of reactive
1
pollutants in and above street canyons--a large eddy simulation. Atmospheric Environment,
2
38, 6883-6892.
3
Berger, W. G. 1975. Urban pedestrian accident counter-measures experimental evaluation / [by
4
Wallace G. Berger] for U.S. Dept. of Transportation, National Highway Traffic Safety
5
Administration, Federal Highway Administration, Washington, D.C. :, U.S. Dept. of
6
Transportation.
7
Buccolieri, R., Gromke, C., Di Sabatino, S. & Ruck, B. 2009. Aerodynamic effects of trees on
8
pollutant concentration in street canyons. Science of The Total Environment, 407,
5247-9
5256.
10
Cost Action 732. 2005. Quality assurance and improvement of micro-scale meteorological models
11
[Online]. Available: http://www.mi.uni-hamburg.de/Home.484.0.html [Accessed].
12
Dcmnr 2006. Green paper towards a sustainable energy future for Ireland.
13
Di Sabatino, S., Buccolieri, R., Pulvirenti, B. & Britter, R. 2008. Flow and Pollutant Dispersion in
14
Street Canyons using FLUENT and ADMS-Urban. Environmental Modeling and
15
Assessment, 13, 369-381.
16
Dto 2004. Road User Monitoring Report. Dublin Transport Office.
17
Encom 2005. Proposal for a Council Directive on passenger car related taxes. . Commission of the
18
European Communities.
19
Fluent. 2008. Fluent 6.3 [Online]. Available: http://www.fluent.com/ [Accessed].
20
Franke, J., Hellsten, A., Schlünzen, H. & Carissimo, B. 2007. Best Practice Guideline for the CFD
21
Simulation of Flows in the Urban Environment. COST Action 732. COST Office, Brussels.
22
Giblin, S. & Mcnabola, A. 2009. Modelling the impacts of a carbon emission-differentiated vehicle
23
tax system on CO2 emissions intensity from new vehicle purchases in Ireland. Energy
24
Policy, 37, 1404-1411.
25
Gromke, C., Buccolieri, R., Di Sabatino, S. & Ruck, B. 2008. Dispersion study in a street canyon
26
with tree planting by means of wind tunnel and numerical investigations - Evaluation of
27
CFD data with experimental data. Atmospheric Environment, 42, 8640-8650.
28
Heist, D. K., Perry, S. G. & Brixey, L. A. 2009. A wind tunnel study of the effect of roadway
29
configurations on the dispersion of traffic-related pollution. Atmospheric Environment, 43,
30
5101-5111.
31
Kaur, S., Nieuwenhuijsen, M. J. & Colvile, R. N. 2007. Fine particulate matter and carbon
32
monoxide exposure concentrations in urban street transport microenvironments. Atmospheric
33
Environment, 41, 4781-4810.
34
King, E. A., Murphy, E. & Mcnabola, A. 2009. Reducing pedestrian exposure to environmental
35
pollutants: A combined noise exposure and air quality analysis approach. Transportation
36
Research Part D: Transport and Environment, 14, 309-316.
37
Liu, C.-H. & Barth, M. C. 2002. Large-eddy simulation of flow and scalar transport in a modeled
38
street canyon, Boston, MA, ETATS-UNIS, American Meteorological Society.
39
Liu, C.-H., Leung, D. Y. C. & Barth, M. C. 2005. On the prediction of air and pollutant exchange
40
rates in street canyons of different aspect ratios using large-eddy simulation. Atmospheric
41
Environment, 39, 1567-1574.
42
Mcnabola, A. 2010. New Directions: Passive control of personal air pollution exposure from traffic
43
emissions in urban street canyons. Atmospheric Environment, In Press, Corrected Proof.
44
Mcnabola, A., Broderick, B. M. & Gill, L. W. 2008a. Reduced exposure to air pollution on the
45
boardwalk in Dublin, Ireland. Measurement and prediction. Environment International, 34,
46
86-93.
Mcnabola, A., Broderick, B. M. & Gill, L. W. 2008b. Relative exposure to fine particulate matter
1
and VOCs between transport microenvironments in Dublin: Personal exposure and uptake.
2
Atmospheric Environment, 42, 6496-6512.
3
Mcnabola, A., Broderick, B. M. & Gill, L. W. 2009. A numerical investigation of the impact of low
4
boundary walls on pedestrian exposure to air pollutants in urban street canyons. Science of
5
The Total Environment, 407, 760-769.
6
Mirzaei, P. A. & Haghighat, F. 2010. A novel approach to enhance outdoor air quality: Pedestrian
7
ventilation system. Building and Environment, 45, 1582-1593.
8
Moryń-Kucharczyk, E. & Gnatowska, R. 2007. Pollutant Dispersion in Flow Around Bluff-Bodies
9
Arrangement. In: PEINKE, J., SCHAUMANN, P. & BARTH, S. (eds.) Wind Energy.
10
Springer Berlin Heidelberg.
11
Ning, Z., Cheung, C. S., Lu, Y., Liu, M. A. & Hung, W. T. 2005. Experimental and numerical study
12
of the dispersion of motor vehicle pollutants under idle condition. Atmospheric Environment,
13
39, 7880-7893.
14
O' Mahony, M., Gill, L. W., Broderick, B. M., English, L. & Ahern, A. 2000. Scope of transport
15
impacts on the environment. Environmental Research Technological Development and
16
Innovation (ERTDI) Programme 2000–2006 (2000) Report Series No. 9.
17
Pearce, D. 1991. The Role of Carbon Taxes in Adjusting to Global Warming. The Economic
18
Journal, 101, 938-948.
19
Retting, R. A., Ferguson, S. A. & Mccartt, A. T. 2003. A review of evidence-based traffic
20
engineering measures designed to reduce pedestrian-motor vehicle crashes, Washington,
21
DC, ETATS-UNIS, American Public Health Association.
22
Santiago, J. L. & Martin, F. 2005. Modelling the air flow in symmetric and asymmetric street
23
canyons. International Journal of Environment and Pollution, 25, 145-154.
24
Shao, L. & Riffat, S. B. 1994. Tracer-gas mixing with air: Effect of tracer species. Applied Energy,
25
49, 197-211.
26
So, E. S. P., Chan, A. T. Y. & Wong, A. Y. T. 2005. Large-eddy simulations of wind flow and
27
pollutant dispersion in a street canyon. Atmospheric Environment, 39, 3573-3582.
28
Taylor, D. & Ferguson, M. 1997. Road User Exposure to Air Pollution: Literature Review.
29
Environmental Transport Association.
30
Tominaga, Y., Mochida, A., Yoshie, R., Kataoka, H., Nozu, T., Yoshikawa, M. & Shirasawa, T.
31
2008. AIJ guidelines for practical applications of CFD to pedestrian wind environment
32
around buildings. Journal of Wind Engineering and Industrial Aerodynamics, 96,
1749-33
1761.
34
Tsai, M. Y. & Chen, K. S. 2004. Measurements and three-dimensional modeling of air pollutant
35
dispersion in an Urban Street Canyon. Atmospheric Environment, 38, 5911-5924.
36
Washbrook, K. 2002. Assessing the potential for road and parking charges to reduce demand for
37
single occupancy vehicle commuting in the Greater Vancouver Region. Simon Fraser
38
University.
39
Xie, X., Huang, Z. & Wang, J.-S. 2005. Impact of building configuration on air quality in street
40
canyon. Atmospheric Environment, 39, 4519-4530.
List of Figures
1 2
Figure 1, (a) model geometry cross-section through generic street canyon model, (b) dimensions of
3
medium-sized car (all dimensions in metres).
4 5
Figure 2, Generic street canyon layout for Cases 1-3 with H/W of 1.
6 7
Figure 3, Plan and side view of geometry for Cases 1-3 of parked car configuration.
8 9
Figure 4, Determining the percentage reduction in CO2 pedestrian personal exposure achieved using
10
parked cars in Case 1 compared to the reference model (leeward footpath; wind speed = 16m/s;
11
wind direction = 90o).
12 13
Figure 5, Plot of average footpath pollutant concentration versus occupancy rates for a Case 4
14
model in parallel wind conditions.
15 16
Figure 6, Plot of average leeward footpath pollutant concentration versus occupancy rates for a
17
Case 4 model with perpendicular wind conditions.
18 19
Figure 7, Plot of average windward footpath pollutant concentration versus occupancy rates for a
20
Case 4 model with perpendicular wind conditions.
[image:28.595.42.531.96.678.2]Figure 8, Resultant velocity vectors plot for the concentration of CO2 tracer emissions for a 4m/s
1
perpendicular wind in Case 1 for (a) reference model without parked cars and (b) model with
2
parallel parked cars.
3 4
Figure 9, Resultant velocity vectors plot for the concentration of CO2 tracer emissions in street
5
canyon for a Case 1 model in perpendicular wind conditions.
6 7
Figure 10, Resultant velocity vectors plot for the concentration of CO2 tracer emissions for a 4m/s
8
perpendicular wind in Case 2 for (a) reference model without parked cars and (b) model with
9
perpendicular parked cars.
10 11
Figure 11, Resultant velocity vectors plot for the concentration of CO2 tracer emissions for a 4m/s
12
perpendicular wind in Case 3 for (a) reference model without parked cars and (b) model with 45o
13
parked cars.
14 15
Figure 12, Resultant velocity vectors plot for the concentration of CO2 tracer emissions of a Case 4
16
model with a 4m/s perpendicular wind for (a) 25% occupancy rate and (b) 75% occupancy rate.
17 18
List of Tables
19 20
Table 1 – Cross sectional dimensions for Cases 1-3 models (all dimensions in metres).
21 22
Table 2 – Case 1 percentage reduction data.
Table 3 – Case 2 percentage reduction data.
[image:30.595.125.501.155.696.2]1 2
Table 4 – Case 3 percentage reduction data.
Research Highlights
• Investigation of 3 parked cars configurations to reduce urban pollutant exposure.
• Parallel parking provided the best layout compared to perpendicular and 45° parking.
• Parking space occupancy influences the pollution concentration on the footpath.
Table 1
Street Canyon Model Dimensions
Table 2
Percentage Reductions
Wind Direction 90° 0°
Wind Speed
(m/s) Leeward Windward Average
2 35% 46% 33%
4 34% 47% 33%
8 33% 48% 32%
16 31% 49% 32%
Table 3
Percentage Reductions
Wind Direction 90° 0°
Wind Speed
(m/s) Leeward Windward Average
2 -37% 41% -12%
4 -36% 41% -19%
8 -35% 39% -25%
16 -34% 37% -30%
Mean -35% 40% -22%
Note: A negative percentage value corresponds to an increase in
Table 4
Percentage Reductions
Wind Direction 90° 0°
Wind Speed
(m/s) Leeward Windward Leeward Windward
2 -23% 47% -8% -288%
4 -25% 49% -3% -275%
8 -26% 53% 0% -249%
16 -28% 56% 5% -233%
Mean -26% 51% -2% -261%