A Probabilistic Approach for Confidence Scoring in Speech Recognition
Punnoose A K Flare Speech Systems
Bangalore, India
Abstract
This paper discusses a method to derive a meaningful confidence score for a speech seg-ment at the phoneme level, using a frame clas-sifier. Multiple functions, which capture vari-ous aspects of the frame classifier output, are first introduced. The ability of these functions to discriminate between different phonemes is shown. A probabilistic approach is formulated to combine the functions to get a meaningful confidence score, which reflects the precision of the predicted phoneme chunk. Relevant real-world datasets are used to demonstrate the effectiveness of the proposed confidence scor-ing mechanism.
1 Introduction
In speech recognition, it is desirable to have a confidence score which has a strong correlation with the correctness of recognition. A low confi-dence score should imply wrong recognition, and a high score should signal correct recognition. For this, the confidence score should be derived out of features which are not directly used or over-looked, in the speech recognition. Modern auto-matic speech recognition is done in a multi-level manner. The bottom level corresponds to frame recognition. Next levels are phoneme, word and sentence recognition respectively. In the sentence level, language model plays a key role in the over-all word error. The relationship between the frame level accuracy and the word level accuracy fol-lows more of an S-curve. Word accuracy increases gradually as the frame accuracy increases, then it shoots up exponentially, and then gradually slows down. An error in frame level classification can be forgiving than an error in phoneme detection, especially in the case of large vocabulary speech recognition task. Ideally, the confidence scoring should be using low level features which are raw compared to higher level features.
Confidence scoring in speech recognition has a rich literature. A general survey for confidence scoring can be found in (Schaaf and Kemp, 1997; Jiang, 2005; Rose et al., 1995). Confidence scor-ing was treated as a classification problem with features derived from trained acoustic and lan-guage models along with derived word level fea-tures (Huang et al., 2013; Weintraub et al., 1997; Wessel et al., 1999; J. Hazen et al., 2002). An-other approach is using backward language mod-els (Duchateau et al., 2002). A trained generic confidence scoring mechanism can be recalibrated to output a more meaningful confidence score, by taking into account the end application specific scenarios (Yu et al., 2011). Another approach used for confidence scoring is by using word lattices (Kemp and Schaaf, 1997) and N-best lists (Rue-ber, 1997).
Multilayer perceptrons(mlp) based posteriors (Lee et al., 2004; Wang et al., 2009; Ketabdar, 2010; Bernardis and Bourlard, 1998) has been ex-tensively used for confidence scoring. mlp pos-terior based score has the benefit of being at the frame level, rather than at the phoneme level. We propose a confidence scoring mechanism at the phoneme level, using a set of new features derived from an mlp based frame classifier.
The rest of the paper is organized as follows. First, the frame classifier details and datasets used are explained. Certain measures computed from the frame classifier output is explored. Then a set of phoneme level features are derived for confi-dence scoring. A probabilistic conficonfi-dence scoring mechanism is formulated using the features de-rived. And finally, the approach is benchmarked using a test dataset. This is a meta-learning ap-proach, as the confidence scoring stage depends on the output from a trained frame classifier.
using Voxforge data is that it is recorded in an uncontrolled environment by people with differ-ent accdiffer-ents, mother tongue, etc. This will give the necessary variability in the data and any confi-dence scoring mechanism derived out of this data will be applicable to a real-world speech based in-formation access.
The whole Voxforge dataset is divided into 3 subsets,d1,d2andd3.d1is used to train the frame classifier. d2 is fed to the frame classifier to get the output dubbed asdm, which is eventually used
for making distributions and functions needed for confidence scoring. d3 is used for benchmarking the proposed confidence scoring approach.
1.1 Frame Classifier Details
An mlp is trained to predict phonemes from speech features. Perceptual Linear Prediction Co-efficients(plp) along with delta and double delta features are used. Standard English phoneme set is used as the labels. Mini-batch gradient descent is used as the training mechanism. Cross-entropy error is used as the objective for backpropagation training. 3 hidden layers are used and weights of the mlp are initialized randomly between -1 and +1. Given an input, the softmax layer outputs a probability vector, where components of the prob-ability vector correspond to phonemes.
Given a wave file, the frame classifier outputs a sequence of probability vectors, each correspond-ing to a frame size of 25ms. Each component in the probability vector corresponds to a phoneme and the phoneme with the highest probability is treated as the classified phoneme. The classified phoneme is labeled as the top phoneme for that frame. Define a phoneme chunk as multiple con-tinuous frames, classified as the same phoneme. Chunk duration of a phoneme is the number of frames in that chunk. /p/ denotes the phonemep.
The subsetd2is passed through the frame clas-sifier to get a set of classified phonemes and the associated probability vectors. This act as the dataset dm, which is used to derive a set of
[image:2.595.312.512.81.283.2]fea-tures for the confidence scoring. First, we dis-cuss these features by completely disregarding the associated ground truth phoneme label. Next, we use phoneme labels to fit distributions for true positives and false positives for all the fea-tures, phoneme wise. Finally, a confidence scoring mechanism with a focus on precision is derived.
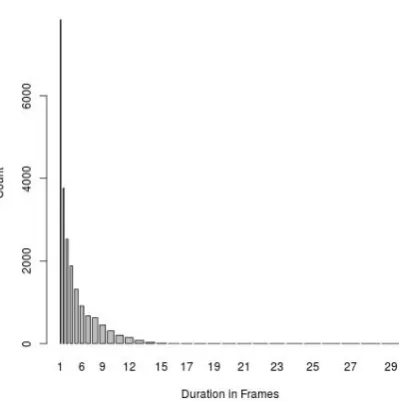
Figure 1: Phoneme /b/: Duration in frames
2 New Features
To derive new features for confidence scoring, three measures are first introduced. These are the duration of phoneme chunks, distribution of softmax probability, and the softmax probability of phoneme chunk. These measures are com-puted from the frame classifier outputdm, which
has a sufficiently large amount of data, that al-lows us to treat this as a population feature. The measures are analyzed based on the top phoneme detected, framewise, by completely ignoring the ground truth phoneme labels. These measures are finally converted into phoneme chunk level fea-tures.
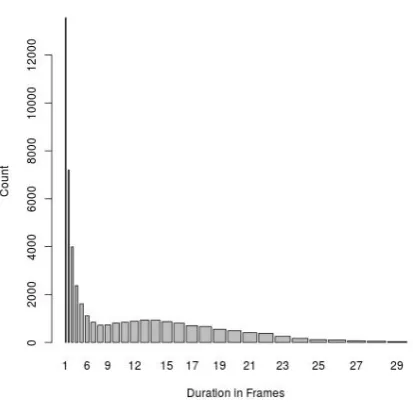
Duration of Phoneme Chunks: Fig 1 and 2 plots the duration of the detected phoneme chunks of /b/ and /ay/ respectively. Note that /b/ tends to have almost zero long phoneme chunks, while /ay/ has relatively plenty long chunks detected by the frame classifier. This difference in the detected duration of different phoneme chunks is signifi-cant enough to treat the phoneme chunk duration as a valid variable for confidence score prediction. Converting the counts to a simple discrete distri-bution,
g(k;p) = PC(k)
kC(k)
(1)
wherec(k) is the number of chunks of sizek of phonemep.
Figure 2: Phoneme /ay/: Duration in frames
distributed generally for different top phonemes, the histogram of probabilities for 2 different top phonemes are plotted for speech data.
Figure 3: Softmax probability histogram for top phoneme /aa/
Fig 3 plots the histogram of the highest proba-bilities for top phoneme /aa/, which is a very com-mon phoneme. It is clear from the histogram that the highest count peaks at 0.5 and as it moves up to 1, the count decreases. What it implies is that the number of instances a /aa/ phoneme is predicted with probability [0.9-1] are less than the number instances in which it is predicted with probability
[image:3.595.310.518.166.361.2][0.4-0.5]. It could be due to the presence of sim-ilar sounding phonemes like /ae/, /ah/, etc so that probability gets divided. The issue with probabil-ities getting divided closely is that it is difficult to assign a meaningful confidence score.
[image:3.595.73.283.412.602.2]Figure 4: Softmax probability histogram for top phoneme /f/
Fig 4 plots the highest probabilities for the top phoneme /f/. It is apparent that /f/ is predicted with high probability, for most of the instances, rather than getting confused with other phonemes. From the 2 plots, it is clear that the softmax probability of the top phoneme is distributed differently for different phonemes, and could be useful in deriv-ing a robust confidence score.
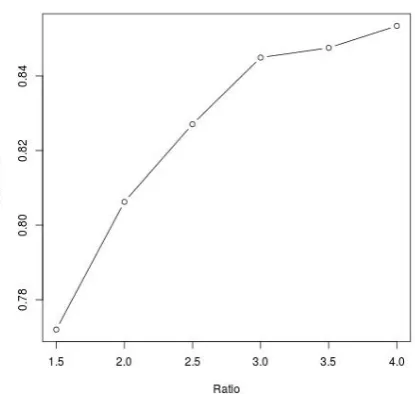
Softmax Probability of Phoneme Chunks: A related question is whether the softmax probability of a top phoneme is dependant on the neighboring same top phonemes. Fig 5 plots the mean of av-erage softmax probability of phoneme chunks for different phoneme chunks sizes, for /f/. It is clear from the plot that as the phoneme chunk size creases, the average softmax probability also in-creases.
proba-Figure 5: Average softmax probability against chunk size in frames for phoneme /f/
bility, ground truth labels of the phoneme chunks has to be taken into account.
2.1 New Features Using Label Information
Ground truth of the detected phoneme chunk provides the necessary discriminatory informa-tion needed to differentiate true positives from false positives. Ground truth label of a de-tected phoneme chunk is the sequence of true label phonemes. Due to the unpredictability of frame classifier, we consider a predicted phoneme chunk to be correct if at least one of the frames in the predicted phoneme chunk and the ground truth phoneme sequence, have the same phoneme. This is because as the ground truth phoneme se-quence is from the output of a forced aligner, there could be the misalignment of phoneme bound-aries. For eg, let a phoneme chunk predicted be [p1 p2 p3 p4 p5] and let the ground truth be [q1 q2 q3 q4 p5], the phoneme chunk predicted is assumed to be correct, because of the 1 common phoneme at the end of the chunks.
With an objective to maximize the precision of the final scoring system, probabilistic models are fit on the features derived from dm, to capture
multiple aspects of speech. For modeling a spe-cific phoneme, on a particular feature, positive and negative data is first captured. Positive data for a phoneme is the feature values derived from dm,
which eventually is classified as the phoneme cor-rectly. Negative data for a phoneme is the false
positive feature values derived fromdm, which
[image:4.595.73.288.84.282.2]in-correctly got classified as the phoneme. In the context of this paper, correctly detected refers to true positives and wrongly detected refers to false positives. Finally, probabilistic models are learned using the positive and negative data, for the particular feature, for the specific phoneme. The features are chunk size, chunk softmax aver-age, chunk average softmax distribution, distinct phoneme count adjacent to the phoneme chunk.
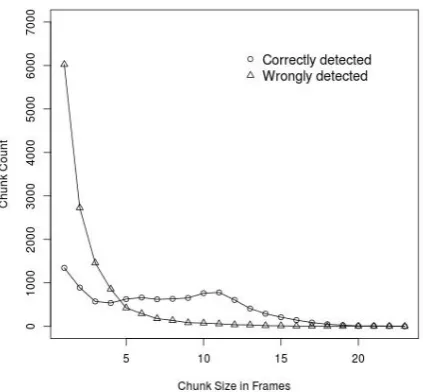
Figure 6: Count of correctly detected and wrongly de-tected phoneme chunks for /f/
Chunk Size: Phoneme chunk size is a cru-cial variable that indicates whether the detected phoneme chunk is indeed correct or not. In Fig 6, the true positives and false positives are plot-ted for phoneme /f/. As the phoneme chunk size increases, the detected phoneme chunk count also increases. Note that the for phoneme chunk size up to 4, the misrecognition rate is very high, which shows that small chunks are more likely to be mis-recognized. From these type of plots, distributions on chunk size for true positives and false positives for specific phonemes can be fit.
The fact that even detected chunk size has an ef-fect on the precision is very crucial. This informa-tion modeled using a distribuinforma-tion can be used in a full blown large vocabulary recognition engine to rescore the language model probabilities. But the downside is that it assigns a disproportionately low score for very short words.
[image:4.595.310.522.232.428.2]variable, between correctly detected and falsely detected phoneme chunks.
Figure 7: Mean of softmax probability across chunk size
Fig 7 plots the mean of average softmax prob-abilities of the phoneme chunks for the top phoneme /f/, averaged chunk size wise, for true positives and false positives. As the chunk size increases, the average softmax probability of the chunk increases. The average softmax probabil-ity of the phoneme chunk, for the correctly pre-dicted and incorrectly prepre-dicted case, is very close to each other and does not provide much discrim-inatory information, when taken in isolation.
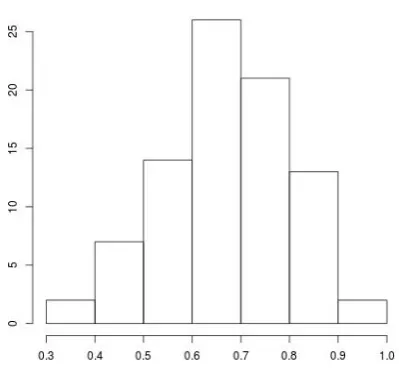
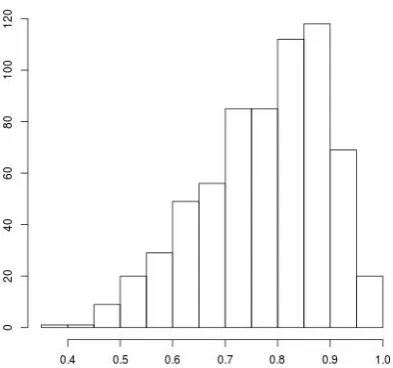
Chunk Average Softmax Distribution: Fig 8 and 9 plots the distribution of average softmax probability of top phoneme /f/, for wrongly de-tected and correctly dede-tected phoneme chunks re-spectively. The chunk size used is 9 frames. It is apparent that both histograms are left skewed, but varies in the degree of skewness. The difference in skewness serves as another discriminatory feature.
As the histogram appears to be normally dis-tributed and skewed, a skew normal distribution (Azzalini, 2013) can be used to model the data. A skew normal distribution models data which are normally distributed and skewed either left or right. A random variable Y is said to have a location-scale skew-normal distribution, with lo-cationλ, scaleδ, and shape parameterα, and de-noteY ∼ SN(λ, δ2, α), if its probability density
Figure 8: Wrongly detected phoneme chunk softmax probability histogram for /f/
function is given by
f(y;λ, δ2, α) = 2δφ(y−δλ)Φ(αy−δλ) (2)
wherey, α, λ ∈ Randδ ∈ R+. φ andΦ de-note the probability density function and cumula-tive distribution function of the standard Normal distribution. If the shape parameter α = 0, then the skew normal distribution equals a normal dis-tribution. i.e.,
f(y;λ, δ2, α) =N(y;λ, δ) whenα= 0
Given a dataset, the maximum likelihood esti-mate(MLE) of parametersλ, δ, αdoes not have a closed loop solution and are calculated using nu-merical methods.
Distinct Phoneme Count Adjacent to the Phoneme Chunk: The number of distinct phonemes, in a small window to the phoneme chunk detected, can serve as a source of infor-mation on whether the phoneme chunk detected is correct or not.
[image:5.595.74.289.132.328.2]Figure 9: Correctly detected phoneme chunk softmax probability histogram for /f/
h(n;p) = PC(n)
nC(n)
(3)
where C(n) is the count of n distinct phonemes in the left window, of a detected phone p, in the datasetdm.
3 Confidence Prediction
We seek a confidence score that reflects the pre-cision of the prediction of a phoneme chunk. As-sume a phoneme chunk of phonemepwith chunk size k, predicted by the frame classifier, with an average softmax probability s and with n dis-tinct phonemes in the adjoining left window of the phoneme chunk. The confidence score is given by the posterior odds ratio,
P(p|s,k,n)
P(¬p|s,k,n) =
P(p,s,k,n)
P(s,k,n)
P(¬p,s,k,n)
P(s,k,n)
= P(sP|k,n,(s|k,n,p¬p)P)P(k(|kn,|n,p¬p))PP((nn|¬|p)pP)P(p()¬p)
With the following conditional independence assumptions,
P(k|n, p) =P(k|p)
P(s|k, n, p) =P(s|k, p)
The posterior odds ratio can be written as
P(p|s,k,n)
P(¬p|s,k,n) =
P(s|k,p)P(k|p)P(n|p)P(p)
[image:6.595.86.283.85.269.2]P(s|k,¬p)P(k|¬p)P(n|¬p)P(¬p)
Figure 10: Distinct phoneme count preceding the cor-rectly detected phoneme chunk /p/
Figure 11: Distinct phoneme count preceding the wrongly detected phoneme chunk /p/
where the distributions are defined as,
P(k|p) =g(k;p)
P(k|¬p) =g(k;¬p)
P(n|p) =h(n;p)
P(n|¬p) =h(n;¬p)
P(s|k, p) =f(s;λpk, δpk2 , αpk)
P(s|k,¬p) =f(s;λ¬pk, δ2¬pk, α¬pk)
where ¬p represents the false positives of phoneme p, that is the cases where phoneme chunks are wrongly detected as p. P(p) and
[image:6.595.319.499.327.502.2]posterior ratio is directly proportional to the preci-sion of the prediction.
Assuming equal prior probabilities for true pos-itives and false pospos-itives, i.e.,P(p) =P(¬p), and in the absence of any other information, the poste-rior odds ratio reduces to,
P(p|s,k,n)
P(¬p|s,k,n) =
P(s|k,p)P(n|p)P(k|p)
P(s|k,¬p)P(n|¬p)P(k|¬p) (4)
Equation (4) calculates the posterior probabil-ity ratio of the case where the detected phoneme chunk is actually the correct phone, to where de-tected phoneme chunk is a false positive.
Figure 12: Posterior ratio vs true positives and false positives for /p/
4 Experimental Results
As this approach focuses on confidence scoring for a detected phone, it is the precision that has to be tested. ModelsP(k|p),P(k|¬p),P(s|k, p),
P(s|k,¬p), P(n|p), andP(n|¬p) are built from
dm. For chunk sizek≥10, where the number of
instances are less for ¬p, data is pooled together and the skew normal distribution is fit. This makes sense as fork ≥ 10, the average softmax proba-bility of the phoneme chunk varies gradually, as is shown in Fig 7. Testing is done on the subsetd3. Fig 12 plots the posterior ratio vs true positives and false positives for a selected phoneme /p/.
[image:7.595.314.522.84.281.2]Each point (x, y) in the true positive curve means the following. For posterior odds ra-tio greater than x, there are y instances of the
Figure 13: Phoneme /p/ precision
[image:7.595.74.287.275.472.2]phoneme chunk /p/ recognized which are true pos-itives. And each point(x, y)in the false positive curve means, for the posterior odds ratio greater thanx, there areyinstances of phoneme chunk /p/ detected which are false positives. The result is the aggregate of all the chunk sizes together. As false positives decreases, true positives also decreases. Fig 13 plots the precision of phoneme /p/. As the threshold of posterior ratio increases, the precision also increases, but at the expense of true positives. Based on the use case, the best operating point can be selected.
The difference between this approach and a di-rect posterior based confidence scoring approach (Wang et al., 2009) is in the additional assump-tions made on the softmax probability. Charac-teristics of the posteriors for the true positive and false positives, associated with a phoneme, is in-corporated into the probabilistic framework. The focus here is on the precision of the phoneme de-tection.
5 Conclusion
inde-pendence assumptions to make the distributions simple. The distributions are learned from real-world data. Benchmarking of the approach is done with the sole focus on precision.
This probabilistic model is suitable for adding new variables if the likelihood of new variable value conditioned on various phonemes can be computed. More variables derived independently from acoustic phonetics, time domain, or spec-trum, can be easily added to the model. As long as the variables are meaningful and with proper conditional independence assumptions, the confi-dence score can be calculated without expensive computation.
In this paper, the focus is solely on the preci-sion. This helps in calibrating the confidence scor-ing mechanism for a certain type of utterances like confirmations in an IVRS system, where a mis-recognition is very expensive. In the future, we aim to make a confidence scoring mechanism with an overall goal of improving recall, which suits a host of other applications like recognition from a list of words. Another area of improvement is to use the confidence score of a phoneme chunk to calculate the confidence score of another chunk, possibly in the same word. This requires a lan-guage model at the phonetic level to model the short-range dependencies.
References
Adelchi Azzalini. 2013. The Skew-Normal and Related Families. Institute of Mathematical Statistics Mono-graphs. Cambridge University Press.
Giulia Bernardis and Herv´e Bourlard. 1998. Improv-ing posterior based confidence measures in hybrid hmm/ann speech recognition systems. InICSLP.
J Duchateau, Kris Demuynck, and Patrick Wambacq. 2002. Confidence scoring based on backward lan-guage models. volume 1, pages 221–224.
Po-Sen Huang, Kshitiz Kumar, Chaojun Liu, Yifan Gong, and Li Deng. 2013. Predicting speech recog-nition confidence using deep learning with word identity and score features. In Acoustics, Speech, and Signal Processing, ICASSP-2013, pages 7413– 7417.
Timothy J. Hazen, Joseph Polifroni, and Stephanie Seneff. 2002. Recognition confidence scoring and its use in speech understanding systems. Computer, Speech and Language, 16:49–67.
Hui Jiang. 2005. Confidence measures for speech recognition: A survey. Speech Communication, 45:455–470.
Thomas Kemp and Thomas Schaaf. 1997. Estimating confidence using word lattices. Proceedings of Eu-rospeech, pages 827–830.
Hamed Ketabdar. 2010. Improving posterior based confidence measures using enhanced local posteri-ors. 2010 18th European Signal Processing Confer-ence, pages 2007–2011.
Akinobu Lee, Kiyohiro Shikano, and Tatsuya Kawa-hara. 2004. Real-time word confidence scoring us-ing local posterior probabilities on tree trellis search. In International Conference on Acoustics, Speech, and Signal Processing, volume 1, pages 793–796.
Richard Rose, B.H. Juang, and Chin-Hui Lee. 1995. A training procedure for verifying string hypotheses in continuous speech recognition. Acoustics, Speech, and Signal Processing, IEEE International Confer-ence on, 1:281–284.
Bernhard Rueber. 1997. Obtaining confidence measures from sentence probabilities. In
EUROSPEECH-1997, pages 739–742.
T. Schaaf and T. Kemp. 1997. Confidence measures for spontaneous speech recognition. InProceedings of ICASSP 97 Volume 2, pages 875–878.
Dong Wang, Javier Tejedor, Joe Frankel, Simon King, and Jose Colas. 2009. Posterior-based confidence measures for spoken term detection. In Proceed-ings of the 2009 IEEE International Conference on Acoustics, Speech and Signal Processing, ICASSP ’09, pages 4889–4892.
M. Weintraub, F. Beaufays, Z. Rivlin, Y. Konig, and A. Stolcke. 1997. Neural - network based measures of confidence for word recognition. In Proceed-ings of the 1997 IEEE International Conference on Acoustics, Speech, and Signal Processing (ICASSP ’97)-Volume 2, pages 887–890.
Frank Wessel, Klaus Macherey, and Hermann Ney. 1999. A comparison of word graph and n-best list based confidence measures. InProceedings of Eu-rospeech, pages 315–318.