Contents lists available atScienceDirect
Telecommunications Policy
journal homepage:www.elsevier.com/locate/telpol
Open access wireless markets
Peter Cramton
a, Linda Doyle
b,⁎aUniversity of Maryland, United States
bCONNECT, the Centre for Future Networks, Trinity College Dublin, University of Dublin, Ireland
A R T I C L E I N F O
Keywords: Open access market Capacity sharing Mobile communications Forward market Real time market
A B S T R A C T
This paper describes an open access market for capacity. Open access means that in real-time, network capacity cannot be withheld—capacity is priced dynamically by the marginal demand during congestion. The paper offers the open access market as a means for managing growing spectrum demand and as an alternative to naked spectrum sharing. The paper describes the parameters of the open access market showing that it can be implemented using today's technology and without significant regulatory change. The paper discusses how the open access market can eliminate barriers at the service level, allowing any number of service providers to compete in response to market drivers. The paper emphasises that the spatial and temporal granularity at which capacity can be purchased, allows for smaller entities to acquire resources, which is important for new entrants testing the water and those with non-standard business plans. The paper also shows how the open access market can provide a path to achieve greater sharing and efficient trade in the future.
1. Introduction
It is widely accepted that spectrum is a highly valuable resource and that the demand for spectrum will continue to rise, as predictions such as Cisco, 2016 show. In the last decades there has been a very large academic focus on how to make more efficient and effective use of this valuable resource. Many of the solutions that have been suggested revolve around taking more dynamic approaches to spectrum allocation and assignment. These include approaches such as dynamic spectrum access, spectrum pooling, real-time spectrum trading, and a myriad of approaches to spectrum sharing, examples of which include,Buddhikot, Kolodzy, Miller, Ryan, and Evans (2005); Lehr and Crowcroft (2005),Doyle (2009), andXiou, Chen, Han, and DaSilva, (2015).
In this paper we focus on optimising spectrum usage through focusing on capacity rather than focusing on naked spectrum. This a term coined byHazlett (2011)and refers to frequency bands only with no infrastructure supporting it. Capacity, on the other hand, is something that exists on a network. In other words, it is the result ofcouplingthe spectrum with infrastructure. While it lacks the purist attraction of working at the spectrum level because the network technology plays a role in the solution and it is therefore not technology neutral, as the paper will go on to show, there is much to be gained by focusing on capacity.
The buying and selling of capacity is well understood and is well established. In thefirst instance capacity is bought and sold in the form of roaming agreements. Roaming is a general term referring to the ability for a mobile network customer to automatically use all of their mobile phone services, when travelling outside the geographical coverage area of their home network, through ‘visiting’another network. Roaming typically takes place when users move outside national boundaries. However national roaming exists in a number of countries. National roaming is also seen as a technique for addressing lack of capacity in rural areas. Whether national or international, the visitor networks are compensated by the home network for serving the users, usually through bilateral
http://dx.doi.org/10.1016/j.telpol.2017.01.003
Received 15 June 2016; Received in revised form 8 January 2017; Accepted 9 January 2017 ⁎Corresponding author.
E-mail addresses:[email protected](P. Cramton),[email protected](L. Doyle).
0308-5961/ © 2017 Published by Elsevier Ltd.
billing arrangements between the two.
Capacity is also bought and sold by mobile virtual network operators (MVNOs). In this case the mobile network operator (MNO) functions in wholesale mode and offers bulk capacity to an MVNO wishing to offer services to its own customers without the need to own a network itself. The MNO can estimate their own users needs to determine spare capacity and subsequently determine the number of MVNOs it can facilitate on its network. By mid 2015 it was estimated that there are more than 1000 MVNOs in the world.1
While roaming and MVNOs represent great examples of capacity being bought and sold, they have their limitations. Roaming is designed for mobile operators to support each other, in other words for‘like to support like’. In the MVNO world we see something similar. In the vast majority of cases, the MVNO offers the same services and the underlying MNO, again‘like supporting like’. The relationship between the MVNO and MNO tends to be quite static. Simple mechanisms are often used to estimate spare capacity on the MNO network, often based on average demands. The number of MVNOs that can be supported by the space capacity is then in turn based on the predicted average demands of the MVNOs. The access of the MVNO on to the MNO network is completely controlled by the MNO. The MNO-MVNO relationship is not designed for access to capacity for new and various different types of emerging service providers such as those which might result from different sectors such as health, transport, agriculture, etc. becoming increasingly digitized and calling for new types of operator. It is not designed to be open to any and all interested parties wishing to test out new wireless applications. The relationship is not designed to support access to capacity in given locations only; to support access to capacity on an as needed basis; to dynamically target underused capacity; or any mix of the above.
As the demand for spectrum increases, as machine-to-machine (M2M) and Internet-of-Things (IoT) services become more prevalent, and as many new service providers emerge it will be necessary to use capacity on the network more effectively, to accommodate more heterogeneous services, and to be open to more competition. Little attention has been paid to how capacity might be dynamically managed to better suit the demands of future communication systems. Little attention has also been paid to how capacity on a network might be opened up for usage by new entrants and different types of service providers. The purpose of this paper is to address this shortfall through presenting one accessible and highly dynamic approach to the buying and selling of capacity on what is termed anopen access market.
The trick is to create an open access market that allows anyone with a good idea to gain access to mobile communications at competitive rates. An open access market for mobile network capacity is a market that is open to all. Indeed, the cornerstone to open access is that use of the network cannot be withheld. Just like the Internet, anyone can use it on a non-discriminatory basis. Of course, the capacity of the network is scarce, and so prices are needed to assign network resources to users. Hence an open access network adopts efficient pricing. Supply is not withheld. Price is set at the value of the marginal demand.
The open access market model is not new. Open access is the foundation of today's restructured electricity markets. Many modern wholesale electricity markets, such as those in the US, operate on this open access principle and price energy at every time and location. Pricing energy at every time and location is calledlocational marginal pricing (LMP) in the real-time market. Locational marginal pricing is a way for wholesale electric energy prices to reflect the value of electric energy at different locations, accounting for the patterns of load, generation, and the physical limits of the transmission system. LPM is a mechanism for using market-based prices for managing transmission congestion. Prices are determined by the bids/offers submitted by market participants. The charge for transmission usage is the incremental cost of the redispatch required to accommodate that transmission usage. Locational marginal prices differ by location when transmission congestion occurs–areas that have more congestion will have higher prices. If there is no transmission congestion, the charge for transmission usage is zero (except for other charges to recover portions of the embedded cost of the transmission grid, etc.). Open access markets in the electricity sector work extremely well. The high level of price transparency not only leads to efficient short-run decisions, but also provides a wealth of market information for longer-term planning including future network investments. Open access is the key force that has led to competitive wholesale electricity markets that have provided reliable electricity supply while saving consumers many tens of billions of dollars from an efficient and competitive market for electricity, as described byO’Connor, P. and O’Connell-Diaz (2015).
The purpose of this paper is to present a design for an open access capacity market that borrows ideas from the open access electricity markets, andfine-tunes them for the world of wireless communications. The main contribution of this paper, therefore, is an introduction to and a description of a practical open access market for network capacity. The paper will show it is a highly dynamic solution, which can support strong competition, involves little regulatory changes, and can work with existing technology. The attractions of the open access approach are many for the wireless world and one of the contributions of the paper is to highlight those attractions. The paper draws heavily on theCramton and Doyle (2016)whitepaper.
The paper begins by introducing the general principles and structure of the open access capacity market inSection 2. As will be seen in that section, there is a need for both a real-time and forward components and both of these are described. The description is given without reference, in as much as possible, to any specific technology.Section 3of the paper provides more detail of the open access market by grounding it in an LTE example and through describing how it might be implemented.Section 4takes a step back and does an analysis of the open access market for capacity through exploring opportunities and challenges, whileSection 5 concludes.
2. The components of the open access market
There are two distinct markets on which capacity can be bought and sold. Thefirst is the wholesale market, in which resources are offered to service providers, and the second is a retail market, in which service providers offer services to retail users. Here we concentrate on a wholesale open access market. In this section wefirst take some time to define terms and concepts before proceeding to defining the key components of the open access market.
2.1. Some basic terms and concepts defined
We use the term wholesale network to describe the network on which the wireless capacity is available. The wholesale network will cover a specific geographical area. The wholesale network can be owned by single or multiple entities; the latter will be explained inSection 4of the paper.
We use the term service provider to define the entity that buys and sells capacity on the wholesale network to service its own users. The service provider can be any entity wishing to provide some kind of mobile/wireless service and does not need to do so universally across the geographical jurisdiction of the wholesale network.
The service provider can be a traditional mobile network operator, and use the wholesale network to supplement its capacity. Most network operators today overprovision their networks to accommodate periods of high activity. Real Wireless has carried out an analysis for the UK, and based on data supplied by different operators2estimates overprovisioning to be at 29.5%. It should
instead be possible to resort to the wholesale network for this‘top-up’capacity and reduce the need for every individual operator to over-provision. Alternatively the service provider can be a type of mobile virtual network operator (MVNO), also akin to the kinds of MVNOs we know today but, as will become obvious in later sections, operating on a much more dynamic basis. The service provider can also be based on a more futuristic virtual operator such as described inDoyle, Kibilda, Forde, and DaSilva (2014), which rather than offer general services as in the case of many current MVNOs today, offer targeted services such as smart grid connectivity or remote surgery for example leading to very different types of demand profiles.
We define capacity on a spatiotemporal basis and think both in terms of the demand side and supply side.
The demand profile of each service provider will vary over time and space.Fig. 1shows a simplified demand pattern for a specific service provider for a simplified geography and for three consecutive time slots as an example. The demands are quantified as low, medium and high and the geographical areas are simple squares. Irrespective of the simplification, we need to think of capacity demand as being some measure of requiredthroughput(e.g. Gb/s)for a specific duration at a location.
Depending on the type of service provider the demand might vary significantly in space and time. There are of course, service providers for which the demand profile can be engineered tofit specific spatial or temporal profiles. The latter tend to be demand profiles associated with machines as distinct from those associated with humans and may increasingly arise as M2M and IoT services grow.
The wholesale network provides the supply. This will have a spatial variation. The spatial variation of supply will be due to the varying capacity of the physical network as most networks are dimensioned differently in different geographical areas. For example, in most network designs, the capacity in urban areas tends to be higher than in rural areas. The supply may also vary over time. In most cases the variation will be slow and reflect for example upgrades to the network. However some examples are given later in the text, which provide more dynamic variation in time.
If demand profiles of different service providers are correlated in space and time, then congestion may occur and this is where the open access market comes in to play.
2.2. The real-time capacity market
At the heart of the open access market is a real-time market. A real-time market is a market that is conducted‘on-the-fly’, based on up-to-date events, and is about allowing the service providers to access the capacity they want‘now’. Real-time evokes the idea of a‘near instantaneous response’. High-frequency trading, for example, uses computers to transact large numbers of orders at very fast speeds, often at the rate of milliseconds or microseconds. Basic definitions can be found inDacorogna, Gencay, Muller, Olsen, and Pictet (2001). In the open access capacity market, this instantaneous way of doing things means up-to-the instant knowledge about demand profiles is to hand. If the area over which the demands are being made are also‘small’, the services providers can, in principle, make very accurate bids. For the moment let us define the space dimension to be the smallest location that can be independently controlled by the network. The time dimension is‘real-time’. Let us define real-time to mean‘a short time interval’ corresponding to the difference between time 1 and time 2 inFig. 1, and we will return to the space and time dimensions in more detail in later sections. The real time auction will therefore deal in GB/timeslot/location.
Hence the purpose of using a real-time market is, in principle, to ensure that the supplier can exactly match the type of spatiotemporal demand profile of the service provider shown inFig. 1. This benefits both the service provider seeking the capacity and the wholesale network operator supplying the capacity. The service provider is better able to bid for the exact resources needed as the resolution (in space and time) at which the real-time market operates makes it easier for the service providers to estimate the demands of their users. The service provider therefore pays only for the resources needed rather than having to but extra resources
just in case. The wholesale network operator is able to support many more service providers because each service provider will not need to build over provisioning into their demand bids and in principle this means accommodating more demands.
2.3. The forward capacity market
One characteristic of real-time markets is that they may involve increased risk. Prices become more volatile closer to real-time (shorter time intervals) as market participants have fewer and fewer options, which make supply and demand curves steeper, and prices therefore more sensitive to even modest quantity changes.
Therefore, to allow the service providers to make plans and better manage risk, the real-time market can be complemented with a forward market. A forward market is a market dealing in commodities for future (forward) delivery at prices agreed-upon today (date of making the contract). These markets can be used as a means of hedging against sharpfluctuations in prices. In our case this means that service providers can hedge their bets by acquiring capacity in advance of the real-time market.
It does not make sense for the forward market to operate at the granularity of the real-time market because when looking ahead at expected demand, a service provider will not be able to predict the demand at thefine-grained level of the real-time market as depicted inFig. 1. The service provider will however be able to estimate expected demand over a larger area and for a longer interval. In addition the auction process would be very onerous if this were the case. Hence the forward market, which deals in GB/timeslot/ location, operates at much longer time scales and over locations covering a greater area.
It is also important to note that there can be more than one forward market. The position taken by the service provider can be successively refined over each forward market. Each successive forward market will cover a smaller geographical area and shorter time interval than the previous to facilitate thisfine-tuning. We will return to defining the geographical areas and time intervals later in the paper.
Onefinal general point about the forward markets, relates to the supply side. The wholesaler does not need to release all capacity on the forward market. The wholesaler can decide to release only a certain percentage. However, all capacity will of course be available in the real-time market.
2.4. The market structure
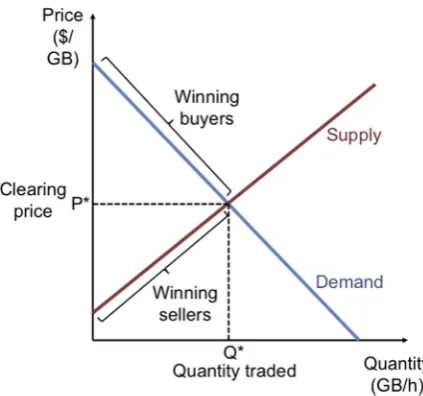
The forward and real-time markets can be structured astwo-sided auctionsin which capacity is traded. The wholesaler provides a supply curve indicating the quantity they would like to sell, at each geographical area, at various prices (more at higher prices); the service providers buying network resources, at each given location, provide a demand curve indicating the quantity they would like to buy at various prices (more at lower prices). The supply and demand curves are aggregated across all market participants for each location and the winning bids determined. The intersection of the aggregate supply and demand curves determines the clearing price (P*) and the quantity traded (Q*), at the given location, as shown inFig. 2.
[image:4.544.89.454.51.235.2]There is a clearing price per geographical area. Just as in the case of locational marginal pricing for electricity markets, in locations where there is congestion, clearing prices will be high. In locations in which there is no congestion the clearing price will be zero (or some low pricefloor). The pricefloor is intended as a means to assure some usage-based revenue accrues in areas with surplus capacity. This strengthens incentives for network investment in low-demand areas. Consistent with the open access principle, the pricefloor ideally is a nominal amount at or near zero.
2.5. The settlement process
The forward markets arefinancial markets (cash settled), allowing participants to take positions well in advance of real-time. The real-time market is physical; that is, it involves the physical delivery of wireless capacity. Deviations from forward positions are settled at real-time prices.
The service provider will take a position that can be successively refined on forward markets andfinally adjusted on the real-time markets. If too little is bought in advance, acquiring additional resources on the real-time market can in principle make up the deficit. If too much is bought in advance, the surplus can be sold on the real-time market.
Of course the service provider may still not get the demand right. One important point to note here is that the real-time market is therefore settled on the basis of actual usage during the real-time interval. In the type of systems we are looking at the usage of the network is scheduled. If a service provider buys capacity in a specific location for a specific time period, it is because the service provide expects its users to require capacity in that location over that time period. That service providers users will be scheduled on the network as they make demands in that location. If the service provider has got its predictions wrong, and no users materialise in that location, then users from other service providers can be scheduled on the network.
The time market should however provide incentives that motivate service providers to estimate as best they can their real-time demand at the location and then bid that quantity as a function of price in the real-real-time market. A system of penalties for deviations from real-time plans is a common method for inducing bidders to balance supply and demand in real time.
The market is designed to allow a number of opportunities to trade, in advance in the forward markets andfinally in the real-time market. These multiple opportunities to trade in combination with penalties for deviation have the overall effect of allowing the service provider to learn,fine-tune their demands and balance certainty versus risk to suit their offerings and brand.
2.6. The independent system operator
Onefinal key component to introduce as part of the open access market is the Independent System Operator (ISO). This term is borrowed from the electricity markets. Independent means that the ISO has no ownership interest in the market participants and does not take a position in the market. The ISO qualifies market participants and establishes any limits on each participant's bidding activities, reveals supply curves for the open access network, conducts the forward and real-time auctions, operates the open access market, settles all transactions in a timely manner consistent with market rules and supply and demand realizations, provides information on market performance to market participants and the market monitor (defined below), and improves the market as problems are identified.
The Independent Market Monitor (IMM) observes the market, identifies problems, and suggests solutions. Independent in this case means that the market monitor, in addition to being independent of the market participants is also independent of the ISO. The IMM brings expert market knowledge. Importantly, the IMM is not a judge; the market monitor cannot enforce market rules and inflict penalties. Rather the market monitor is an observer who writes reports and makes recommendations. In electricity markets, this has allowed the market monitor to quickly identify and address problems.
3. Choosing the core parameters of the open access market
[image:5.544.164.376.51.249.2]also contains some notes on any constraints on the selection of the parameters, and suggested values. There are three reasons for working through the different parameters. Thefirst is to make real the more abstract definition of the market, which has taken place to date. The second is to emphasise the fact that while the technology plays a role in the market design, it is a small role. The third reason is to stress there is choice. The choices presented here are based on logical deductions but there are of course many options for implementation. The parameters, constraints, and values are now explained in turn.
As mentioned in the previous section, open access market is built on the real-time market. In reality, real-time must include the time taken to do the trade and the time taken to effect delivery. In other words, real-time is as fast as it takes to trade and for capacity to be directed/redirected to the users of the service providers who successfully bought the capacity and away from those who sold it. There is afinite time in which these actions are possible and trading any faster than the time taken for the network to respond would not make sense. This means that the length of the real-time interval is a function of the wholesale network technology. In our example we consider an LTE network. This choice of technology is justfied, and not overly restrictive, given the global dominance of LTE networks.3It also underpins the fact that an open access capacity market can be delivered using existing technology, one of the claims made in earlier sections of the paper.
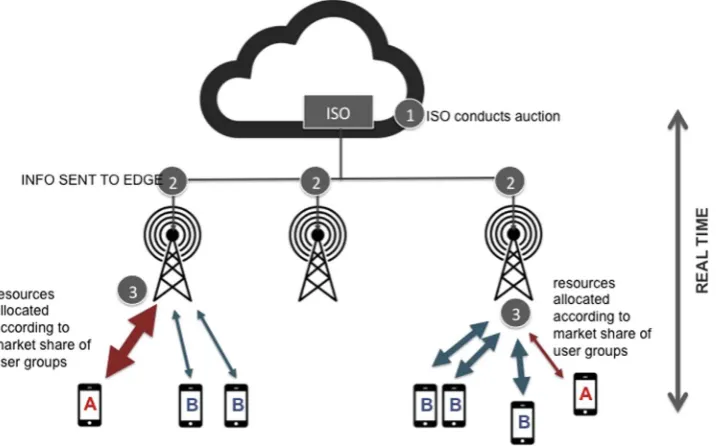
In an LTE network, information must be sent to the edge of the network (i.e. to the basestation or enodeB as it is termed) to effect the change in resource distribution (as shown inFig. 3). The time taken for thisflow of information is what defines real-time. A highly conservative estimate of time to trade and effect change in the LTE network is 1 h. In the current network management regimes, changing spectrum ownership on a one hour basis would be considered exceptionally dynamic. Hence a hourly real-time market is a huge advance. The one-hour time slot is based on using standard LTE technology. However, there are many options for customisation of LTE network parameters, which would result in the time being reduced to the order of one minute. The technical details are beyond the scope of the paper but an examination of sections of the LTE specifications will reveal many options for this as can be seen, for example, in the3GPP document TR 22.852 V13.1.0 (2014).
The smallest geographical area over which resource ownership can be controlled is the area over which the real-time market is conducted. In the case of a cellular network this is typically at the cell level. InFig. 3, for example, service provider A has successfully bought a large amount of capacity in the cell on the left of the image as indicated by the thick arrow, while service provider B has bought less capacity, indicated by thinner arrows. In the cell on the right service provider B has bought more capacity. In other words, each basestation can be given separate instructions on how to control access to capacity based on the outcome of the auctions and hence the cell is the smallest geographical granularity which can be controlled.4The actual geographical area of a cell varies of
course. In general cells are smaller in urban areas than in rural ones, and smaller at higher frequencies. Hence the unit is not a unit of uniform size but of minimum control. The capacity we are trading on the real-time market is thereforeGB per hour per individual cell(GB/timeslot/location or throughput at a location).
Parameters 3–9 inTable 1are not restricted by the technology choice or deployment of the network. They need to make sense in the context of a market. Just like any products on any market, products will have a lifespan and the market will have a cadence that reflects that lifespan. A successful market design will tap into that cadence.
[image:6.544.41.491.77.233.2]In general current mobile service providers think of longer-term usage trends on a yearly basis. It therefore makes sense to offer forward products on the open access market that allow the purchase of capacity for yearlong periods. A second level of refinement can happen through medium-term products. There are seasonal variations in demand that manifest themselves on a monthly basis for example. Growth/decline in customer bases may also be evident at the monthly level. Therefore, the ability to buy or sell for the month-ahead makes for a reasonable medium-term product. It may be the case that a forward market for a week ahead or a day ahead makes sense, especially as service providers evolve in a future world of internet-of-things, for example, and demand profiles Table 1
Open access market parameters.
Parameter Constraints/Criteria Chosen values
1 Time interval for real-time market Network technology dependency 1 h (based on LTE) 2 Geographical area over which real time
market applies
Network granularity dependency Cell of cell-sector (based on LTE)
3 Number of forward markets Economic criteria 2
4 Duration of each forward market Economic criteria, suitability to the cadence of the market
Yearly and Monthly
5 Geographical area over which forward markets apply
Economic criteria, tractability considerations, accessibility for smaller players
Relevant jurisdictional boundaries
6 Type of auction used in the forward markets
Economic criteria & tractability considerations Simultaneous ascending clock auction
7 Type of auction used in the real-time markets
Economic criteria & tractability considerations Sealed bid
8 Number of products in the market Economic criteria & tractability considerations 2 products: peak and off-peak
9 Penalty functions Economic criteria Tolerance within which no penalty, additional cost
outside tolerance
3worldtimezone.com/4g.html(last accessed January 2007)
change, but for the moment theyear and monthlyoptions seem sensible, and hence we select two forward markets.
There are many options for aggregating the basic geographical units into bigger areas. Our approach is twofold. First, as explained inSection 2, we adopt the principle that the areas form a hierarchy: the real-time market is the most granular, each monthly area is an aggregation of real-time areas, and each yearly area is an aggregation of monthly areas. Second, we are guided by jurisdictional boundariessuch as boroughs in making decisions about the geographic areas. Thus the aggregated areas still will be at a granularity that makes it feasible for small service providers to bid for resources to support local services. Accommodating the needs of a local provider makes the market more competitive, while providing equal access of opportunity. From a demand prediction perspective, the geographical aggregation makes sense as well. Prediction of demand for year-ahead timelines will tend to be more accurate over larger geographical areas, a month over smaller areas and real-time over smaller areas still as captured in Fig. 4.
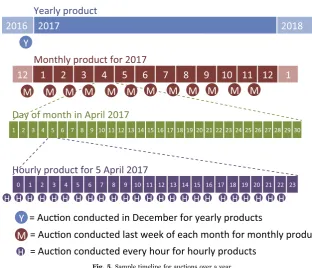
Fig. 5shows a sample timeline of the auctions based on the discussion thus far. There are 1+12=13 forward auctions each year and 365×24 hourly auctions.
[image:7.544.96.456.55.278.2] [image:7.544.169.381.519.677.2]Yearly and monthly auctions involve greater volume. In electricity markets 80–90% of volume transacts in forward markets. We anticipate a similar split in mobile communications markets. When auctioning many related products in infrequently conducted forward auctions, biddersfind it helpful to learn about market prices and likely winnings during the auction, while they can still make adjustments to their bids. This learning about prices and winnings is calledoutcome discovery. To allow outcome discovery in these auctions, the ISO collects bids with asimultaneous ascending clock auction. Details of this type of auction can be found in Milgrom (2004). In each round the auctioneer asks bidders to express a piecewise-linear demand curve for a range of prices. The Fig. 3.Understanding real-time in the context of a specific network. Information mustflow from the ISO to the edge of the network. The variation in arrow thickness is to illustrate the fact that different quantities of resources are directed to the users of the different service providers.
real-time auction is conducted in a single round (sealed-bid). This is because outcome discovery is less important in real-time and the auctions must occur quickly.
The number of products that are placed on the market needs to also be selected. This again is an economic choice that involves trading offthe simplicity of fewer products with theflexibility of more products. Currently there is clear difference in demand between peak and non-peak hours. It therefore makes sense that service providers can take different forward positions onpeak and non-peak hours, resulting in two different hourly products.
Thefinal design parameters are the penalty functions for deviation from expected usage in the real-time market. There are many ways to do this. We propose atoleranceand provided the hourly usage of the service provider is no greater than this, no penalty applies; the service provider pays the clearing prices times the number of GB/h used. A second cost is added however if the deviation is greater than the tolerance. In our case this is equal to the price times thepenalty factortimes the squared deviation. This can be fine-tuned to get desired behaviour.
In each auction (forward or real-time), the ISO determines the supply makes that public. The GB/h remains the basic unit in all auctions. In the yearly auction service providers seek to buy a total number of GB/h for every hour in the year, disaggregated across every cell in the area covered by the yearly auction (e.g. as perFig. 4). In the monthly auction service providers seek to buy/sell a total number of GB/h for every hour in the month, disaggregated across every cell in the area covered by the monthly auction (e.g. as perFig. 4). They will buy if they need more for the month ahead and sell if they feel the position they took on the yearly forward market was too high. In the real-time auction service providers seek to buy/sell a total number of GB/h for the individual cell (e.g. as perFig. 4). The individual demand curves for each service provider are expressed as a sequence of price-quantity pairs. The ISO aggregates individual demands. Offers to sell are expressed in the same way as negative demand. In the forward auctions the ascending clock auction allows for rounds after which adjustments can be made. And in the real-time auction the sealed-bid approach is used. The outcome of the auction is asingle clearing pricefor the geographical area in which capacity is being bought/ sold. Every buyer who bid that price or above acquires capacity at the clearing price. Every seller who offered capacity at the clearing price or below isfilled at the clearing price. This single price contributes to fairness and transparency in the market. Worked examples are given in the original whitepaper byCramton and Doyle (2016).
4. Analysis
In this penultimate section of the paper we step back and look at what the open access market has to offer as well as discuss some of the challenges and opportunities in making it a reality.
4.1. Breaking the oligopoly
[image:8.544.109.422.48.316.2]The greatest advantage of the open access market is in its openness. The chief weakness of the current mobile communications markets is the oligopoly structure in which a small number, typically between one and four, of mobile network operators build
separate networks and then operate them in exclusive spectrum purchased in infrequent spectrum auctions. This is an extreme version of the“walled garden”approach to competition, as users face enormous switching costs to move from one garden to the next, and there are few gardens to choose from.
The open access capacity market is meant to tackle just this by making capacity open to any and all interested parties. Moreover the paper does so, through building on ideas that have been well understood for decades.Noam (1998)articulates the limitations of spectrum auctions and how they will lead to oligopoly and weak competition. Noam then goes on to explain the inevitable evolution to an open access market in which spectrum is accessed in spot and futures markets based on congestion. Noam's vision, expressed at the onset of spectrum auctions in the mid-1990s, is now here.
One important difference with our approach is that in Noam's spectrum access market (see alsoBerry, Honig, & Vohra, 2010), spectrum is unbundled from network infrastructure; whereas, the open access market described here, bundles spectrum and other network resources into a product that consumers value, namely capacity on a mobile network. This is the approach that has proven successful in other markets such as the aforementioned electricity markets, where the primary product is energy (MWh), which is directly consumed by users, rather than unbundling fuel and the other resources that combine to produce the commodity valued by users.
Spectrum is also of course a very different resource from fuel because of the issues of interference. Simply put, it is difficult to use spectrum without paying attention to neighbouring deployments or the issues of externalities as Noam might say. WhileDoyle and Forde (2007)and the various papers cited therein, argue in favour of spectrum trading, the challenge of interference is well detailed. It is of course possible to draw on advanced interference management techniques, cognitive radio-based solutions, and use sophisticated database or spectrum access systems to keep track of spectrum usage to manage the coexistence between different services and technologies. Selected examples of different approaches include, Gundlach, Hofmann, Markwart, and Mohyeldin (2014); Holland, Bogucka, and Medeisis (2015), andMarshall (2016). However the simplicty of the capacity market, its success to date, albeit in the limited form of roaming and MVNOs, and the fact that no strong examples of extensive spectrum trading still exist, point to open access capacity markets as strong contenders for better resource usage and for wider access to network resources. And while open access capacity markets do not have the attractiveness of a completely technology neutral solution, there is on the other hand a very limited impact of the technology on their design.
4.2. Avoiding wastefulness
The open access market also builds on well-understood ideas in congestion pricing.MacKie-Mason and Varian (1994) and (1995), for example, explain dynamic pricing of Internet access. Their paper anticipates the need for congestion pricing to efficiently assign scarce network resources. They describe how congestion pricing works to maximize the economic value of the network. The open access market for capacity builds on their insights to develop a practical market design for mobile communications.
As has been explained throughout the paper, the open access capacity market discourages service providers from buying more capacity than is needed to satsify their demand profiles as any unused capacity will become available to others wishing to use it with no guarantee the service provider will recoup what they paid for it. Predicting demand is a skill but one that is greatly aided through the open acccess market process. The forward and real-time markets allowfine tuning of capacity requests to successively shorter time periods and smaller georgraphies making it easier to be accurate. The spatio-temporal variation in demand profiles of different service providers, the ability to estimate the spatio-temporal demand variation as accurately as possible through the open access market process, and the ability to serve demand at the spatio-temporal granularity envisaged in this paper, means that many more service providers can be accommodated on the wholesale network.
One question that arises in any form of market is whether the demand is so strongly correlated in location and time across service providers that the benefits of capacity sharing are limited. Though datasets from mobile operators are treated as commercially sensitive and can be difficult to access for research purpose, studies over the years, which have been based on real data have pointed to behaviours that show sharing is beneficial.Paul, Subramanian, Buddhikot, and Das (2011)in their paper on‘Understanding traffic dynamics in cellular data networks’show that while aggregate network load exhibits a nice periodic behaviour with relatively high loads during peak times and low at night. However the paper shows that the load curve varies significantly among individual base stations with their peaks occurring at different times of the day.Di Francesco, Malandrino, and DaSilva (2014), in their paper on‘Mobile Network Sharing Between Operators: A Demand Trace-Driven Study’, confirms this behaviour by showing positive but very weak correlation in time and space between the demands of two different network operators. In summary, while aggregate behaviours are similar, there is signficant spatio-temporal variation in demand that is apt to create gains from trade in an open access market.
If we add to this disucssion, the emergence of new services, the case gets stronger. These service providers are responding to the growth in machine-to-machine (M2M) and Internet-of-Things (IOT). There is an ever-increasing number of M2M and IOT applications. All of these require connectivity. Ericsson notes that there were around 230 million cellular M2M subscriptions at the end of 20145and point to many avenues that will encourage that growth further such as the reduction in cost of LTE modems, and
new developments and 5 G capabilities which will extend the range of addressable applications for massive M2M communications. A portion of that traffic will undoubtedly be real-time traffic that needs to be served instantly. But a significant proportion is non-real-time traffic, is highly predictable and can be managed in time. The service providers managing non-real-time traffic can support
applications at times of the service providers choosing, and therefore can seek capacity when it is abundant (uncongested) and the price is nominal.
4.3. The challenge of deployment and investment
The system suggested in this paper is new and is not operational in any country at present though companies like Rivada Networks6are exploring opportunities to deploy this system. The question, of course, arises whether this system offers enough to gain momentum and be widely deployed.
While it is too early to say, it is worth pointing out that this approach can be deployed in any band that is dedicated to mobile communications services, and for which a wholesale offering is encouraged or required by regulation.
It is also worth gaining a wider understanding of the ownership of the network assets to understand potential options for deployment. Consider the network assets to be infrastructure and spectrum. Infrastructure can be further broken down into antennas, nodes, core, masts/sites, processing power etc. but for purposes of illustration we will stick to the two categories.Fig. 6 shows three possible ownership options; (a) in which the infrastructure and spectrum is owned by the same entity, (b) in which separate entities own each, and (c) in which there are multiple owners of both assets.
In option (b) and (c) the owners of the assets will get revenues from the market in proportion to the assets they own. A good example arises from the FirstNet spectrum opportunity in the USA. This spectrum, 20 MHz from the 700 MHz band, is set aside for public safety use across the USA. A public-private partnership between FirstNet and a private system operator, which builds and manages the network, is an example of option (b) inFig. 6. Applying an open access capacity market in this case is attractive for a number of reasons. Public safety can retain priority use of the spectrum in emergencies, but the system operator manages real-time and longer-term markets for spectrum, ensuring that the capacity is used efficiently and providing funds for building and operating the network. The FirstNet example can be extended to more than one private operator and an additional source of spectrum, which would result in option (c) inFig. 6.
The multi-party ownership for the wholesale network can also help in terms of investment. Lack of investment in assets by any one owner will essentially result in smaller share of revenues for that owner. Alternatively investment by an owner in their assets will ensure their proportion of the revenues remains high (or is increased).
The wholesale ownership model can also be considered from a more dynamic perspective, which can be used to both show how ownership can change over time and also show how the model is compatible with emerging spectrum sharing concepts. Consider one of the spectrum sharing frameworks that has gained much attention in recent years, known as Licensed Shared Access (LSA) and defined inECC Report 205 (2014). An LSA licensee is granted exclusive use of the spectrum at a given time and location in band in which an incumbent exists. LSA provides protection to the incumbent. The incumbent user will have its rights to spectrum formalised or licensed during the process of establishing the sharing arrangement. The incumbent must adhere to the terms and conditions of its license/access rights and the new users (sharers) must adhere to their license conditions. Several high level regulatory deliverables, defining the LSA sharing framework and its standardization, have been published in the aforementioned ECC report and ETSI reports such asETSI TR 103 113 V111 (2013), andETSI TR 03 154 V111 (2014). The incumbents vary depending on what band is being shared. For example, in the in the 2.3 GHz band (one of the bands designated for LSA in Europe), incumbents differ on a per country basis and include telemetry services (terrestrial, aeronautical); governmental use of Unmanned Aircraft Systems (UAS) (drones); PMSE (Programme making and special events) applications (Services Ancillary to Broadcasting/ Services Ancillary to Programme making (SAB/SAP) video links, wireless cameras); and amateur service (as a secondary service). The conditions of use of the spectrum will vary accordingly. It is envisaged that licenses will be granted for 10 years or longer and the geographical area over which they apply will vary in size.
Spectrum obtained through an LSA license could be‘added’to the open access market, i.e. it could be an additional asset and owned by an entirely separate entity as inFig. 6(c). In the open access market, the ISO determines the supply curve that is offered in the forward auctions and announces the supply curve in advance of the auctions. The spectrum coming from the LSA license, just like an additional investment in infrastructure, will alter the supply of capacity available and the ISO will alter the supply curve in line with these changes. The spectrum may not be universally available across all locations, but the open access market operates at a spatial granularity that can accommodate this. In other words the supply curves can be altered for the locations in which the extra spectrum comes on line. Likewise the temporal granularity can be taken into account and the spectrum can be put on the forward markets if its availability can be guaranteed over the forward market timelines. In the case of a ten-year LSA license this means that in principle the spectrum can be made available each year in a forward market for ten years as well as in the subsequent monthly and real-time markets. If the time at which the LSA license begins does not coincide with a yearly forward auction, it can be placed on the monthly or real-time market until the next available yearly auction takes place. There is no requirement to have to offer spectrum in all three markets. This means that a large area ten-year static LSA license can be converted into a dynamic license with all of the opportunities for small players or new entrants that might entail.
Assets can be added (or taken away) from the open access market. They can be added (or taken away) at the smallest (or largest) spatial and shortest (or longest) temporal granularity that the market supports. This is a powerful mechanism for responding to efficient asset usage while at the same time supporting competition.
5. Conclusions
The open access capacity market reinvents the notion of the wholesale network.
1. The open access capacity market supports highly efficient sharing now with today's technology, and without significant regulatory change.
2. Entry barriers at the service provider level are eliminated. Any number of service providers can compete in response to market drivers.
3. The spatial and temporal granularity over which capacity can be purchased also allows for smaller entities to acquire resources, which is important for new entrants testing the water and those with non-standard business plans.
4. It can be owned in a manner that incentivises investment and that embraces advances in spectrum sharing.
5. There are clear oversight mechanisms to ensure that operation is transparent and fair and can be improved over time. While it will not be the case there is one universal wholesale physical network that suits all communications purposes, it should be possible to widely deploy an open access market–on widely accepted universally available technologies such as LTE - that will evolve with the physical evolution of the network.
While the open access market has been presented as a feasible, practical solution it is none-the-less important to note that a significant mind shift is needed by incumbents to adopt a system that is not completely controlled by the incumbent. However we move to a world in which sharing of resources will become evermore necessary, this approach offers the comfort of the type of quality of service to which they are used to, and builds on well understood ideas.
Acknowledgements
This material is partially based upon works supported by the Science Foundation Ireland under Grants No. 13/RC/2077.
References
3GPP TR 22.852 V13.1.0 (2014). -09).
Berry, R., Honig, M., & Vohra, R. (2010). Spectrum markets: Motivation, challenges, implications.IEEE Communication Magazine,48, 146–155.
Buddhikot M.M., Kolodzy P., Miller S., Ryan K. and Evans J. (2005). DIMSUMnet: new directions in wireless networking using coordinated dynamic spectrum.In Proceedings of the sixth IEEE international symposium on a world of wireless mobile and multimedia networks, pp. 78–85.
Cramton, P. and Doyle L.E. (2016). An open access wireless market supporting competition, Public Safety, and Universal Service, Whitepaper. Available:〈http:// www.cramton.umd.edu/papers2015-2019/cramton-doyle-open-access-wireless-market.pdf〉last Accessed January 2017.
Dacorogna Michael, M., Ramazan, G., Ulrich, M., Olsen Richard, B., & Pictet Olivier, V. (2001).An introduction to high-frequencyfinanceSan Diego, CA: Academic Press, 383 (ISBN: 0-12-279671-3).
Di Francesco, P., Malandrino, F., and DaSilva, L.A.,“Network Sharing in Cellular Networks: a Demand Trace-driven Study.ACM SIGCOMM capacity sharing workshop, Chicago, IL, 18 August 2014, pp. 39-44.
Doyle, Linda and Forde, Tim. (2007).Towards a Fluid Spectrum Market for Exclusive Usage Rights. In Proceedings of the IEEE international symposium on new frontiers in dynamic spectrum access networks (DySPAN’07), Dublin, Ireland, pp: 620−632.
Doyle, L. E. (2009).The essentials of cognitive radioThe Cambridge Wireless Essentials Series,240United Kingdom: Cambridge University Press (April).
Doyle, L. E., Kibilda, J., Forde, T. K., & DaSilva, L. A. (2014). Spectrum without Bounds, Networks without Borders. (March)Proceedings of the IEEE,102(3), 351–365 (March).
ECC Report 205 (2014). Licensed shared access (LSA).
ETSI TR 103 113 V1.1.1 (2013). (2013-07), Electromagnetic compatibility and radio spectrum matters (ERM; system reference document (SRdoc); Mobile broadband services in the 2 300 MHz−2 400 MHz frequency band under licensed shared access regime.
ETSI TR 03 154 V1.1.1 (2014). Reconfigurable Radio Systems (RRS); System requirements for operation of mobile broadband systems in the 2 300 MHz-2 400 MHz band under Licensed Shared Access (LSA).
Gundlach, M., Hofmann, J., Markwart, C., and Mohyeldin, E. (2014). Recent advances on LSA in standardization, regulation, research and architecture design.In Proceedings of the 1st international workshop on cognitive cellular systems (CCS), Germany, pp. 1–5.
Hazlett, T. (2011). Creating efficient spectrum property, spectrum markets: Challenges ahead workshop, Evanston, IL, June.
[image:11.544.164.381.54.189.2]Lehr, W. and Crowcroft, J. (2005). Managing shared access to a spectrum commons.In Proceedings of thefirst IEEE international symposium on new frontiers in dynamic spectrum access networks, DySPAN 2005., Baltimore, MD, USA, pp. 420–444.
Marshall, P. (2016).Scalability, density, and decision making in cognitive wireless networks(Web. 15 June)2012. Cambridge Books Online(1st ed.) Cambridge: Cambridge University Press.
MacKie-Mason, J. K., & Varian, H. R. (1994). Pricing the Internet. , in: Kahin, B., & Keller, J. (Eds.). (1994). Public Access to the Internet (July). Englewood Cliffs, NJ: Prentice-Hall.
MacKie-Mason, J. K., & Varian, H. R. (1995). Pricing congestible network resources.IEEE Journal on Selected Areas of Communications,13(7), 1141–1149.
Milgrom, P. (2004).Putting auction theory to workCambridge: Cambridge University Press.
Noam, E. (1998).“spectrum Auctions: Yesterday's Heresy, today's Orthodoxy, tomorrow's Anachronism. taking the Next step to open spectrum Access.Journal of Law and Economics,41(S2), 765–790.
O’Connor, P. and O’Connell-Diaz E. (2015). Evolution of the Revolution: The sustained success of retail electricity Competition,COMPETE Discussion Paper. Paul U., Subramanian A.P., Buddhikot M.M. and Das S.R. (2011). Understanding traffic dynamics in cellular data networks.Proceedings IEEE INFOCOM, Shanghai,
pp. 882–890.