Bristol BioEnergy Centre, Bristol Robotics Laboratory, Coldharbour Lane, BS16 1QY Bristol, UK
bFaculty of Chemistry, Wrocław University of Science and Technology, Wyb. Wyspiańskiego 27, 50-370, Wrocław, Poland
H I G H L I G H T S
•
Dynamic changes of biofilm matured under different external loads are in-vestigated.•
Most dynamic changes are observed in thefirst 3 weeks of operation.•
External resistance lower than internalresistance improves maturing of the biofilm.
•
Internal resistance is dependent on external resistance applied in ma-turing phase.•
External resistance irreversibly affects the biofilm properties and perfor-mance.G R A P H I C A L A B S T R A C T
A R T I C L E I N F O
Keywords:
External resistance Internal resistance Dynamics Evolution Continuousflow Structure
A B S T R A C T
Appropriate inoculation and maturation may be crucial for shortening the startup time and maximising power output of Microbial Fuel Cells (MFCs), whilst ensuring stable operation. In this study we explore the relationship between electrochemical parameters of MFCs matured under different external resistance (Rext) values (50Ω -10 kΩ) using non-synthetic fuel (human urine). Maturing the biofilm under the lower selected Rextresults in improved power performance and lowest internal resistance (Rint), whereas using higher Rextresults in increased ohmic losses and inferior performance. When the optimal load is applied to the MFCs following maturity, de-pendence of microbial activity on original Rextvalues does not change, suggesting an irreversible effect on the biofilm, within the timeframe of the reported experiments. Biofilm microarchitecture is affected by Rextand plays an important role in MFC efficiency. Presence of water channels, EPS and precipitated salts is distinctive for higher Rextand open circuit MFCs. Correlation analysis reveals that the biofilm changes most dynamically in thefirst 5 weeks of operation and thatfixed Rext lefts an electrochemical effect on biofilm performance. Therefore, the initial conditions of the biofilm development can affect its long-term structure, properties and activity.
1. Introduction
Microbial Fuel Cell (MFC) technology uses electroactive bacteria to
produce electricity through oxidation of organic matter. The technology has received increased attention over past decades [1]. The bioelec-trochemical reactions take place in anodic and cathodic components of
https://doi.org/10.1016/j.jpowsour.2018.08.031
Received 5 March 2018; Received in revised form 25 July 2018; Accepted 9 August 2018
∗Corresponding author. Bristol BioEnergy Centre, Bristol Robotics Laboratory, Coldharbour Lane, BS16 1QY Bristol, UK. ∗∗Corresponding author.
E-mail addresses:[email protected](G. Pasternak),[email protected](I. Ieropoulos).
the MFC have found many potential applications in thefields of was-tewater treatment, electricity generation, biogas production, biosensors and bioelectrochemical synthesis [2–10]. Among various carbon sources that have been demonstrated as a fuel in MFCs human urine has proved to be a good substrate due to its high conductivity [11]. The ongoing development of the MFCs focuses on developing electrode materials, catalysts, membranes separating anodic and cathodic chambers, design and scale-up of the MFC-based systems [2,12–17].
Despite the broad interest in many engineering aspects of the MFCs, the most crucial role is played by the electroactive bacteria, which form the biofilm on the electrode's surface and generate electrical power from their population-level metabolism. The biofilm is a complex ma-trix of microorganisms and extracellular compounds which is con-sidered to be very stable, albeit possessing physiological adaptive me-chanisms [18] many of which are expressed during the initial biofilm formation period.
Several research groups have previously reported on power per-formance and start up times when the electroactive community has been matured under different poised anode potentials. For example the anodic biofilm formed byGeobacter sulfurreducensgives highest power performance and lowest MFC start-up time, when matured under a potential range between 0 and 400 mV vs SHE (standard hydrogen electrode). This optimal potential range promoted the biofilm growth and corresponding power density of the MFCs [19]. The study reported by Aelterman et al. showed, that optimal biofilm growth and activity was obtained when the anode was poised at −200 mV vs Ag/AgCl electrode, although the original source of the bacterial inoculum was not mentioned [20]. More recently, Zhu et al. reported, that acclimating the biofilm with positive potentials may lead to the decay of the power overshoot phenomenon which leads to improved power performance [21].
Easier ways of controlling the potential of MFC electrodes is by applying an external load (Rext), which does not require any specialist equipment that could be limiting in particular for field applications. Comprehensive investigation on the effect of Rexton biofilm formation and activity has been reported by Zhang et al. [22]. The authors in-vestigated the ohmic range of 10–1000Ω and indicated that optimal Rextfor their MFC setup was found to be 50Ω, although biofilm matured under 10Ωproduced the highest current. The study also showed that Rext had an impact on the presence of extracellular polymeric sub-stances (EPS) of the biofilm, and a more recent study showed that EPS plays a role in biofilm performance and in turn, power generation [23]. The influence of three different Rextvalues on biofilm activity (after the maturing phase) was also studied by Jung and Regan [24]. The authors
focused on methane production and the inhibition of methanogenesis was found to occur in parallel with the highest power efficiency for MFCs fed with acetate and operating under lowest (150Ω) Rext. Earlier studies also demonstrated the relationship of Rextapplied during op-eration (after maturing phase) with performance of the MFCs in relation to the fuel supply and the best results were obtained when MFCs were operated under Rextcloser to internal resistance (Rint) [25]. External resistance was also found to be a factor influencing diversity of the bacterial community [24,26,27].
Although significant work has been done to understand the inter-actions of Rextwith the biofilm, very limited knowledge is available on dynamic evolution of biofilm subjected to various external loads. Since the biofilm forms both stable and adaptive structure, such knowledge is indispensable to develop appropriate strategies for inoculation and operation of MFCs. It is therefore important to determine, whether the conditions applied to the biofilm in the initial stage of development may leave a structural and electrochemical profile and irreversibly af-fect its performance thereafter.
The aim of this study was to determine the temporal and long-term effects offixed and dynamically-changed external resistance on changes of biofilm parameters and resulting MFC performance in time. The re-sults revealed the irreversible effects that the initial Rextcauses to the biofilm, which may subsequently either induce or inhibit the power performance of the MFCs in long-term perspective. This is thefirst of two papers in series, where we have focused on analysis of electro-chemical parameters. The second part of this study will focus on bio-logical parameters of the biofilm.
2. Experimental
2.1. MFC construction and operation
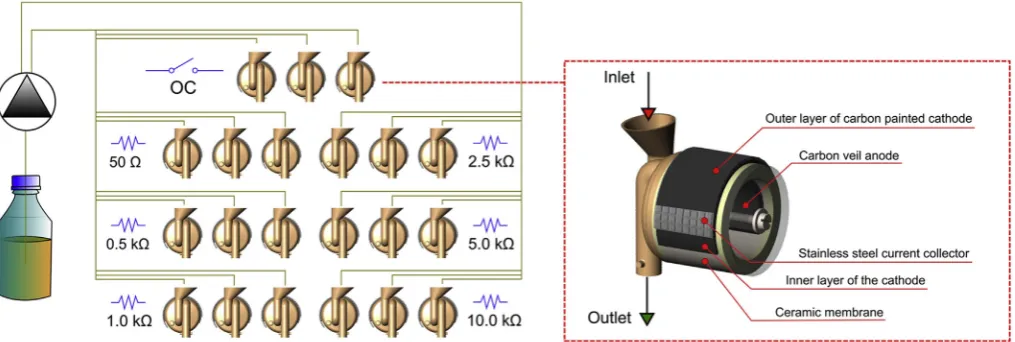
The single chamber MFCs were built as described in detail in our previous work [28]. In brief, earthenware ceramic material was used both as the separator and housing for the anodic chamber (Fig. 1). The external side of the ceramic cylinder was supplied with carbon-painted cathode (carbon loading of 14.08 mgC cm−2) and stainless steel wire mesh, acting as a current collector. The volume of an empty MFC anodic chamber was 11.4 mL. Carbon fiber veil (20 g m−2, PRF Composite Materials, Dorset, UK) was used as the anodes with total surface area of 252 cm2. A 3D-printed Nanocure®RCP30-resin lid with inlet and outlet tubes was used as a front panel of the vertically positioned MFCs.
[image:2.595.45.553.58.229.2]All of the MFCs were manufactured manually in the same manner and used to build an array of 21 electrically andfluidically isolated
Fig. 1.Schematic representation of experimental design and MFC design. The experimental setup consisted of predefined external loads only in thefirst stage (weeks 1–5) of the experiment. In the second stage (weeks 6–17) external load was changed dynamically to the optimal value determined for each individual MFC. Individual graphical elements of this image were derived from our previous works [30,31].
MFCs. The array consisted of 7 sets of triplicate MFCs. Each triplicate was operating under different electrochemical conditions, controlled by the external load, connected to each individual MFC.
In thefirst stage of experiments, the external resistance (Rext) was predefined for each triplicate, as shown onFig. 1. The array consisted of MFCs connected to 50, 500, 1000, 5000 and 10000Ω, as well as the open circuit (OC) control. The electroactive biofilm was grown at the anodes using these predesigned Rextvalues for approximately 6 weeks. Activated sludge derived from the aerobic chamber of municipal was-tewater treatment plant (Wessex Water, Saltford, UK) was used to in-oculate the MFCs. After 24 h, activated sludge was removed from the MFCs and replaced with the fresh human urine as a fuel. The MFCs were operated in continuousflow conditions. The fuel was delivered to the MFC-array using multichannel peristaltic pump (Watson Marlow, USA) at a constantflow rate of 0.12 L d−1. Between stages 1 and 2, the MFCs were fed with gradually increasingflow rates to determine the impact on power performance. Before the second stage, the flow rate was brought back to a constant value of 0.12 L d−1.
The second stage of the experiment took place between 7 and 17 weeks of operation and was conducted in the same hydraulic condi-tions. In the second stage, the Rextwere adjusted dynamically, using optimal values determined individually for each MFCs, excluding OC control for which the open circuit conditions were maintained. Prior to the 17th week, the MFC cathodes were washed with deionised water due to the ongoing accumulation of inorganic salts at their surface, which deteriorated performance.
2.2. Dynamic electrochemical behaviour of the biofilm
Electrochemical behaviour of the biofilm was tracked over time through polarisation experiments and real time temporal power per-formance monitoring. Polarisation experiments were carried out each week. In the second stage, the optimal Rextvalues determined from power curves were applied to each MFCs to simulate maximal power point tracking (MPPT) conditions. The polarisation experiments were conducted using automated variable resistor system, known as the re-sistorstat [29]. Each polarisation run consisted of 1 MΩ–3.75Ω re-sistance range. Each value was connected to the MFC for a period of 5 min. The power performance of the MFCs was monitored with 34972 A Data Acquisition unit (Agilent Technologies, USA) with the data logging sample rate set to 3 min. The current was calculated ac-cording to Ohm's law: I = V/R, where V is the measured voltage in Volts (V) and R is the value of the external resistance. The power output P in Watts (W) was calculated using equation: P = I x V.
2.3. Environmental electron scanning microscopy
[image:3.595.48.553.55.413.2]The biofilm structure was investigated byfield emission environ-mental scanning microscopy, coupled with Energy-dispersive X-ray spectroscopy (Philips XL-30). Samples of the biofilm were collected from the anode at the end of the experimental period andfixed with 4% glutaraldehyde in 0.1 M PBS buffer. Subsequently, the samples were rinsed with water and air-dried for 12 h at room temperature.
2.4. Data processing and statistical analysis
Experimental data werefirst processed using Microsoft Excel 2010 and further analysed and visualized using R GUI package (v. 3.4.2). The polarisation experiments data was processed and visualized using SciDAVis (v. D001) software. Investigating the dynamic effects of Rext on the biofilm properties and activity was conducted by local poly-nomial regressionfitting, as well as by determining the Pearson's cor-relation coefficients between Rint, Rext, OCV (open circuit voltage), power and current, extracted from polarisation experiments. The data was further visualized through the correlogram.
3. Results and discussion
All experiments were carried out using fresh human urine, collected on a daily basis as a fuel and delivered under constant flow rate. Therefore, the measured pH of fresh urine ranged from 6.15 to 6.29 and the average conductivity was equal to 11.76 ± 0.76 mS.
3.1. Electrochemical behaviour of biofilm
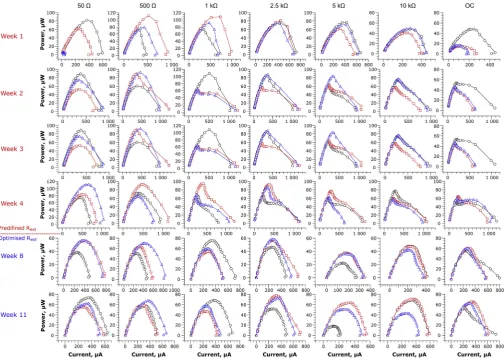
It is known, that the shape of a polarisation and power curves and the corresponding losses are greatly dependent on the activity of elec-troactive bacteria [32,33]. Data derived from the polarisation experi-ments were presented in the form of power curves, as shown inFig. 2. The results reported in this study comprised the highest coverage of Rext within the operational range of MFCs when compared to previous studies available in the literature. Previous works used up to four Rext values below 10 kΩ, where the highest divergence of the data may be expected [22,24–27].
Maturing the MFCs under various loads resulted in achieving si-milar, symmetrical power curves across all the Rext values. Nevertheless, the most uniform MFC characteristics between individual replicates were observed for 2.5 kΩ, resulting in the smallest variance of electrochemical parameters: OCV, I, P and Rint. The highest disper-sion of electrochemical parameters detected in polarisation experiments were reported for the two extreme Rextvalues: 50Ωand OC. The most significant concentration (mass transfer) losses were observed for 10 kΩ load, while the best performing individual MFCs were reported for 500Ωand 1 kΩ. All of the MFCs revealed only negligible overshoot phenomenon, despite this being reported for early stage of biofilm de-velopment, as well as starvation and sub-optimal running conditions, and related to its metabolic rate and activity [21,34]. The lack of overshoot stays in line with our previous study, where the earthenware appeared to be the most favourable ceramic membrane material to create the appropriate MFC microenvironment which induces electro-active biofilm formation and activity [35].
In the second week of operation, significant changes in the MFC characteristics were observed. All of the MFCs operating under the load within the range 2.5 kΩ- OC, and 2 out of 3 MFCs operating under 1 k Ω, underperformed. Those MFCs showed significant, rapid drop of the performance in the central part of the power curves, corresponding to the ohmic losses. In contrast, the MFCs connected to Rextof 50 and 500Ωdid not show such unfavourable changes. This trend continued until the end of the first stage of the experiment and became more significant each week, showing deterioration of the performance. Decrease of the power performance during polarisation was mainly caused by the drop of potential, while current values were similar or higher than those observed for MFCs operating under 50 and 500Ω. The electrochemical data observed for MFCs operating under Rext≥1.0 kΩ and OC control, showed that ohmic losses were re-sponsible for the gradual deterioration of power performance observed with time and with increasing Rext. Since the MFCs were operating in the same hydraulic conditions and were manufactured in the same way, the observed ohmic losses were probably caused by the formation of biofilm with suboptimal electrochemical properties, which may have
been the result of both the Rextand the low (but constant)flow rate. The MFCs were operating below the optimal value, which was found to be between 0.43 and 0.89 L d−1(Figure S2). Suboptimal biofilm properties (physical, chemical and biological) could have resulted in achieving a highly resistive biofilm, which could negatively affect the overall in-ternal resistance of the MFC. As reported by Nikhil et al., biofilm con-ductivity was the determining factor for the performance of MFCs in-oculated withGeobacter sulfurreducens[36]. Such results are supported by thefindings of McLean et al. who observed that 100Ω- matured
Shewanella oneidensisbiofilm had lower thickness (< 5μm), than the biofilm matured under near-OC conditions (1.0 MΩ, > 50μm). Similar results were found by Read et al. during the initial stages of biofilm formation [37]. Reaching similar values of current, within the tested resistors, suggests that even suboptimally formed biofilm, contains sufficient numbers of electroactive bacteria, capable of delivering electrons to the electrode surface. This finding can be partially ex-plained by the work of Jung et al. [24] who showed that dominating, electroactive species belonging to Geobacteraceae are present in the quantities of the same order of magnitude in biofilms operating under various Rextvalues or even in OC conditions. Nevertheless, their study was constructed in a different way, i.e. the MFCs were initially matured for 3 weeks under the same Rextafter which various pre-defined loads were used (150–9800Ω). More detailed ecological studies have re-ported significant effects of anodic potential levels on biofilm compo-sition and consequently, performance of these bioelectrochemical sys-tems, which may in turn play a key role in achieving desirable electrochemical properties [38–40].
The differences in biofilm properties were also revealed during the flow rate experiment (Figure S2). The results indicate, that only the 50Ω-matured biofilm was capable of utilising nutrients at the highest flow/supply rate (0.888 L d−1). In parallel, the 50Ω-biofilm was more susceptible to starvation (0.008 L d−1), which led to a drop of power output when compared to other Rext. These data perhaps suggest that the 50Ω biofilm had developed mechanisms for more efficient con-version of nutrients into electricity when the feeding rate is sufficiently high, but underdeveloped the ability to accumulate store energy re-serves in such form as EPS (Fig. 5) which could be used when the feeding rate is low. Flow rate is an important parameter that is bound to affect the biofilm as a whole. Previous reports [41] describe how the flow rate affects the biofilm growth rate and in turn power output. However, the biofilm structure and how this may be affected byflow rate, is an area that requires dedicated investigation.
After 5 weeks of operation (stage 2), the pre-defined resistor values were replaced by the optimal Rextvalues (derived from the polarisation data), adjusted to the optimum value at one-week intervals (simulating an MPPT approach). Changing the Rextof the MFCs to follow their optimal values (when Rext= Rint[33]) resulted in changes to the shape of MFC power curves. The ohmic losses previously observed in stage 1 were no longer visible. Such an interesting phenomenon suggests, that there was perhaps a change in biofilm behaviour that adjusted to the new electrochemical conditions. This could be explained by the in-creased oxidation of the carbon-energy substrate due to higher meta-bolic rates, since the new resistors connected to the MFCs had lower resistance, when compared to the stage 1. Higher metabolic rates are proportional to higher microbial growth rates and hence biomass density of the electroactive species. In a perfusable electrode system this maintains afixed thickness biofilm, as the outer layers, which no longer have direct contact with the electrode, are constantly washed out. This results in a thinner biofilm and improves the diffusion of nutrients into the biofilm and conductivity (as indicated by Rint – Fig. 3). A thinner biofilm will also result in a significant reduction in extracellular polymeric substances (EPS) as previously reported by Zhang et al. [22]. The present study, suggests that Rintcould dynami-cally change over time, as also alluded to by Winfield et al. [34].
3.2. Changes of power and internal resistance over time
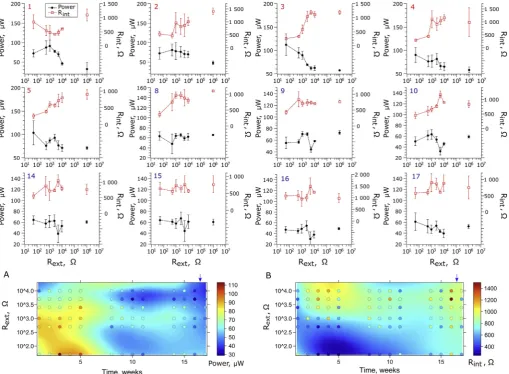
To further investigate the impact of Rexton biofilm maturing, the dynamic changes in Rintand power over time were also monitored (Fig. 3). In thefirst week of operation, the highest power performance was observed for 1 kΩ-matured MFCs and reached 91.6 ± 14.0μW, whilst the Rintreached a value of 471.3 ± 247.5Ω. The lowest Rint value was also observed for 1 kΩand was equal to 205.4Ω(derived from the polarisation experiment). Thus, in thefirst week, the use of 1 k ΩRextcreated the most favourable conditions to obtain the lowest Rint. During thefirst 3 weeks, the highest power performance was ob-served for 1 kΩMFCs. In the following weeks the maximum power output was recorded for lower Rext values: 500ΩMFCs in week 2 (81.3 ± 15.0μW) and 50ΩMFCs in week 3 (112.2 ± 23.1μW). Similarly, the minimum Rintvalues were observed for MFCs matured under Rext= 500Ω in week 2 (473.5 ± 93.8Ω) and Rext= 50Ω in week 3 (253.8 ± 40.6Ω). During the whole 1st stage of biofilm ma-turing, the lowest power performance and the highest Rintvalues were observed for the MFCs operating under higher Rextvalues and under open circuit conditions, whilst the highest power values and lowest Rint values were recorded for the MFCs operating under lower Rextvalues.
[image:5.595.44.554.56.430.2]The relationship between Rext, Rintand power was the most notable in the 3rd week of biofilm maturing, which appears to be the critical time required for the biofilm to develop. Furthermore, the highest perfor-mance of the MFCs during the entire experiment was also observed in the 3rd week of operation and was recorded for the MFCs matured under the lowest Ohmic value, 50Ω(112.2 ± 23.2μW). Following the 3rd week of operation, the increase of Rintwith increasing Rextwas observed even in the 2nd stage of operation, where optimal Rextvalues were applied following the simulated MPPT method. The internal re-sistance showed similar (but negative) trends that could be observed for power performance, which was reflected by similar patterns developed by the MFCs through time (Fig. 3A–B). The correlation between those two factors was later confirmed by statistical analysis. The internal resistance may be affected by various parameters such as hydraulic and environmental conditions [25,42,43]. In this study the hydraulic and other operational conditions remained constant, even though theflow rate was relatively low for this type of MFC. Therefore, such dynamic changes of internal resistance, in particular in the early period of op-eration (stage 1) resulted from ongoing biofilm development. Such changes may affect the conductivity of the biofilm, which is directly correlated with the current density by reducing the resistance of the
Fig. 3.Evolution of the power performance and internal resistance of MFCs and biofilm matured under different external resistance values and open circuit (here
designated as 106Ω) conditions. The numbers in the upper-left corner of each graph indicate the week of operation. The R
electronflow and lowering the activation energy required for electron transfer between biofilm and the anode [36].
Interestingly, at the end of the 1st stage, a local power optimum was observed for 2.5 kΩand became even more distinctive in the 5th week of operation. The 2.5 kΩMFCs reached 93.0 ± 7.1μW, which corre-sponds to 89.8% of the performance observed for 50ΩMFCs. This state was also observed in the later stage of the biofilm growth, when the optimal Rextresistors were applied to the MFCs (stage 2). Local poly-nomial regression fitting (Fig. 3A and 3. B) revealed that this local optimum could be found between Rextof 0.5 and 2.5 kΩ (with best performing MFCs observed for 1.0 kΩ) and was maintained until 15th -16thweek of operation. At the same time 50ΩMFCs, which appeared to show the highest power performance in stage 1, underperformed as compared to MFCs operating under 0.5–2.5 kΩin the initial period of stage 2 (weeks 9–11), but established a local optimum at the end of the experimental period (weeks 14–17) and outperformed the MFCs ma-tured under higher Rextvalues.
The overall decreasing trend of power output and simultaneous increase of Rintobserved in all MFCs in stage 2 resulted from the ob-served accumulation of inorganic salts on the cathode surfaces (Supporting information –Figure S1), as previously reported for this particular MFC design [28]. Therefore, at the end of stage 2, the cathodes were washedin situwith copious amounts of distilled water. As a result, the 50Ωbiofilm was brought back to show the highest
power. The power profile observed across all of the MFCs in week 17 was almost identical to the one observed for the 4th week (Fig. 3.4 and 3.17), confirming that divergence of the data during stage 2 was par-tially a result of the deteriorating cathodes and indicating long-term effect of Rexton biofilm performance. The analysis of the regression surface of power and Rintsuggests that the deterioration rate of the cathode was increased in the 50Ωand decreased in the 0.5–2.5 kΩ -matured MFCs. This can be explained by the occurrence of electro-osmotic drag, which is related to the power output and could lead to faster accumulation of salts at the cathode observed in the best per-forming (50Ω) MFCs [44,45]. In fact, the highest amount of salt de-posits at the cathode surface were observed for 50ΩMFCs, while the lowest for OC control and also 500–5000ΩMFCs, indicating the in-terdependence between electroosmotic drag and MFC performance (Figure S1). The cathode performance adds another dynamic factor to the complexity of the microbial fuel cells.
3.3. Dynamic electrochemical profile - simultaneous effect of Rextand Rint
resistance on MFC performance
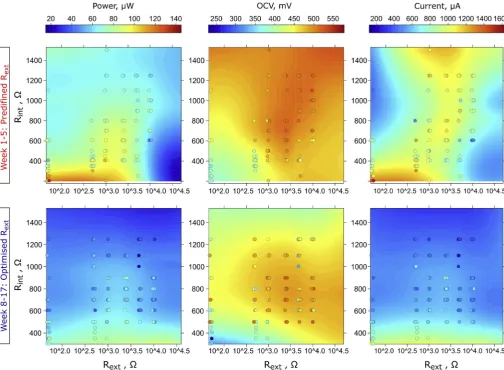
[image:6.595.43.548.55.425.2]Data shown inFig. 4display a particular type of electrochemical profile –the pattern developed throughout time by all biofilm com-munities, reflecing dependence of the MFC electrochemical parameters on controlled (external) and developed (internal) resistance. The results
Fig. 4.Simultaneous effect of external and internal resistance on electrochemical parameters of MFCs in two stages of experimental period. The labels on x-axes reflect the real, predefined external resistance for weeks 1–5 and original external resistance for the same MFCs once the simulated MPPT procedure was applied (weeks 8–17). The colour intensity of each point refers to the measured value, while colour intensity of the surface refer to the regression model. The regression model was alsofitted using OC (106Ω) control, which was not included in the plotting range for reasons of clarity. (For interpretation of the references to colour in thisfigure legend, the reader is referred to the Web version of this article.)
show that the highest power efficiency of the MFCs was achieved for the biofilm which developed an internal resistance lower than 300Ω, and such low Rintwas only present when the biofilm was matured under Rextbetween 50 and 1000Ω. Another local optimum was found for the biofilm matured under Rextbetween 1000 and 2500Ω, which devel-oped an Rintbetween 407.2 and 701.8Ω. Notably, biofilms developed under lower Rextvalues produced the highest current and the lowest OCV, while the biofilms matured under higher values of Rextshowed lower current and higher OCV. These results could be explained by the fact that the biofilm subjected to the effects of the low external re-sistance (higher anode potential) develops a biofilm with a different composition of electroactive species, as shown by previous studies for both biofilm [38–40] and planktonic communities [38]. It was shown that the strategy of maturing the biofilm under Rextvalues lower than the lowest observed Rintmay be beneficial in the long term and this is (to the best of the authors' knowledge) the first report where these phenomena have been demonstrated. Data reported in previous re-search focused on maturing the biofilm in Rext> Rint conditions [22,24–27]. Furthermore, when comparing profiles obtained in two stages of experiment, it can be concluded that the biofilm maintained its electrochemical properties even though the environment was dy-namically changing over time. The obtained profiles were similar, in-cluding the general decreasing trend in performance, current and OCV, probably due to cathodic salt accumulation, as previously described.
These findings are crucial in defining the appropriate inoculation strategy and protocols for assessing and predicting the MFC perfor-mance. The internal resistance proved to be more effective parameter to determine the best performing MFCs than OCV. Nevertheless, reaching high OCV suggests that system may be better balanced and more ef-fective in long term operation, when dynamic changes in cathode performance may occur. The data also shows, that reaching higher potential within MFC environment is not as important as acquiring the biofilm with a desirable structure and community composition as re-flected by Rint, which allows the MFC to reach a higher current pro-duction rate and density. Thisfinding suggests that the electrochemical biofilm properties developed over time, are as important as the com-position of the electroactive consortia, which also changes dynamically over time [46–48].
3.4. Biofilm microarchitecture
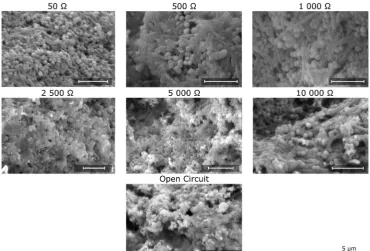
The biofilm structure and composition was assessed at the end of experiment (after phase 2 - switching Rextto optimal values) using environmental scanning electron microscopy, as shown onFig. 5. The most notable changes were in the form of inorganic precipitates. The MFCs matured under lower Rext(50, 500, 1000Ω) showed no or neg-ligible amounts of such precipitates. Maturing the biofilm under 2.5 kΩ and above resulted in increased amounts of graupel-shaped crystals embedded into the biofilm structure, comprising mainly Na, Cl, Mg, P and Ca, as determined by energy-dispersive X-ray spectroscopy. These salts were present in the highest amounts under open circuit conditions and in all reported cases, adjacent to neighbouring bacterial cells. Such finding may suggest a tendency from the anodic community to accu-mulate or induce formation of precipitates at very low or no current flow (see Fig. 5). This phenomenon could be one of the factors that contributed to the development of higher Rintover time for MFCs that had matured under higher Rext, since the crystals are considered to be non-conductive and may have affected the resistivity of the biofilm.
The differences in biofilm microarchitecture were also most notable when comparing high Rext(5 kΩ, 10 kΩand OC) with low RextMFCs. Images acquired for high Rextanodic biofilm and OC control, revealed development of looser structures, rich in EPS and with visibly larger water channels in comparison to the low Rextanodic biofilms. In con-trast, the lowest Rext(50Ω) MFC developed a dense and uniform bio-film structure with little EPS content. Zhang et al. [22], quantified the EPS content and reported its inverse relationship with external re-sistance, which is not in line with thefindings of the current study. In that previous study, the results were normalised to the surface area of the carbon cloth electrode (as opposed to the biomass), in addition to using a different Rextrange (10–1000Ω).
[image:7.595.112.483.55.306.2]In addition to the influence of Rexton the anodic community com-position, as previously reported [24,26,27,49], the current study sug-gests that the biofilm microarchitecture was affected by Rextand played an important role in the evolution of the electrochemical MFC para-meters over time, reaching a desirable power efficiency. The observed differences between the lower and higher ranges of Rext, as well as the OC control, indicate that beyond a point, the biofilm was irreversibly
affected by its initial maturing conditions within the timeframe of ex-perimental period.
3.5. Quantitative analysis of dynamic changes in biofilm behaviour
To investigate the dynamics of changes recorded for electrochemical parameters of the biofilm, correlation analysis has been conducted, as shown onFig. 6. In thefirst stage of biofilm maturing, whenfixed Rext values were applied, positive correlation (R = 0.80) was only found for current profiles recorded in thefirst two weeks, which we consider as a startup period of the MFCs. The correlation coefficient gradually de-creased afterwards, confirming that most dynamic changes took place during the first 5 weeks of biofilm maturing. A similar pattern was observed for the power output, while the OCV profiles reached the highest correlation coefficients (0.82–0.99) among all of the para-meters, starting from the 2nd week of biofilm maturing. In contrast, following the 2nd week a positive correlation was observed for Rint
[image:8.595.43.549.56.490.2](0.35–0.76) and was decreasing with the increase of time; i.e. two neighbouring Rintprofiles (variables) were showing the highest corre-lation. These results suggest, that internal resistance was smoothly changing from one state to another due to the development of the biofilm growth. It can be also concluded, that current was the most dynamic biofilm parameter, while the OCV was the most stable one. Therefore, the data suggest that the power output of the MFCs was rather not affected by the redox potential of bacterial enzymes and resulting electrode overpotentials. This statement is supported by finding a positive correlation between power and current (0.51–0.93, excluding week 2) and negative correlation with Rint(−0.38 to−0.91, excluding week 9), while not even a weak correlation was found be-tween OCV and power output. Interestingly, the OCV was very well correlated with the Rintduring thefirst weeks of operation reaching R values of 0.77–0.86 following 2 weeks of biofilm maturing. Thus, Rint was the main factor determining the potential of the MFCs and reaching high OCV values were not determining for the power performance.
Fig. 6.Dynamic changes in correlation of electrochemical parameters reported for the whole population of MFCs in time. The numbers following each label correspond to week of operation, while colour intensity and diameter of the circle corresponds to the Pearson's correlation coefficient (r), as shown on colour key. Inverse correlation is reflected by negative R values, while positive correlation is reflected by positive r values. The following criteria were used to determine the strength of the correlation: weak ( ± 0.1 to ± 0.3), moderate ( ± 0.3 to ± 0.7), strong ( ± 0.7 to ± 0.9), very strong ( ± 0.9 to ± 1.0). Dashed lines indicate the regions of interest, which are discussed in the text. (For interpretation of the references to colour in thisfigure legend, the reader is referred to the Web version of this article.)
were not reflected by the dynamic behaviour reported for current. Although strong negative correlation values were reported for Rintand power in that period, power and current were also negatively correlated with original (stage 1) Rextwhere weak to moderate correlation was reported (R between−0.3 and−0.7). Therefore, as previously shown onFigs. 3 and 4, the external resistance affects the properties and ac-tivity of biofilm, which thus becomes irreversibly affected by its pre-liminary environmental conditions. Nevertheless, the overall correla-tion between Rext and any other investigated parameter was the strongest in thefirst stage of operation. The highest (negative and po-sitive) correlation coefficients were reported for 3rd week of operation, which we believe is the most significant period required to develop healthy and well-performing electroactive biofilm in MFC. Although MPPT method proved to be an efficient way of reducing the startup time and improving the performance of the MFCs, its application re-quires dedicated electronic circuit which affects the cost-efficiency of system [50,51]. In this study, the best performing biofilm was devel-oped when matured under 50Ω- an Rextapproximately 5 times lower than their lowest Rint, which we believe was a result of outstanding adaptive mechanisms of electroactive bacteria. Therefore, knowledge on internal resistance of the system prior to start-up is crucial for the field-applications, where the cost and available infrastructure may be the limiting factors.
4. Conclusions
Maturing the biofilm under various Rextcaused several changes in biofilm behaviour. It was shown, that growing the biofilm under higher suboptimal Rext had an adverse effect on its properties and activity. Maturing the biofilm under lower, yet suboptimal Rext, resulted in im-proved Rintand power output. The most dynamic changes in electro-chemical properties of the biofilm were observed in thefirst 5 weeks of operation. Implementing MPPT procedure after initial period of ma-turing was not sufficient to change the electrochemical profile-effect of the MFCs, i.e. dependence of the biofilm activity on initial (stage 1) Rext values. The connected Rexthad a significant effect on biofilm three-dimensional structure and composition. Thesefindings are important for developing the appropriate inoculation and maturing strategies to maximise the performance of MFCs.
Acknowledgements
This work was funded by the Bill and Melinda Gates Foundation grant no. OPP1094890. Grzegorz Pasternak is a Polish Ministry of Science and Higher Education Fellow. Ioannis Ieropoulos is an EPSRC Career Acceleration Fellow (grant number EP/L002132/1). The authors would like to thank Mr Daniel Sanchez Herranz for his help, advice and support.
[5] A. Prévoteau, K. Rabaey, Electroactive biofilms for sensing: reflections and per-spectives, ACS Sens. 2 (2017) 1072–1085,https://doi.org/10.1021/acssensors. 7b00418.
[6] K. Rabaey, R.A. Rozendal, Microbial electrosynthesis - revisiting the electrical route for microbial production, Nat. Rev. Microbiol. 8 (2010) 706–716,https://doi.org/ 10.1038/nrmicro2422.
[7] F.J. Hernández-Fernández, A. Pérez de los Ríos, M.J. Salar-García, V.M. Ortiz-Martínez, L.J. Lozano-Blanco, C. Godínez, F. Tomás-Alonso, J. Quesada-Medina, Recent progress and perspectives in microbial fuel cells for bioenergy generation and wastewater treatment, Fuel Process. Technol. 138 (2015) 284–297,https://doi. org/10.1016/j.fuproc.2015.05.022.
[8] L. He, P. Du, Y. Chen, H. Lu, X. Cheng, B. Chang, Z. Wang, Advances in microbial fuel cells for wastewater treatment, Renew. Sustain. Energy Rev. 71 (2017) 388–403,https://doi.org/10.1016/j.rser.2016.12.069.
[9] C. Santoro, F. Soavi, C. Arbizzani, A. Serov, S. Kabir, K. Carpenter, O. Bretschger, P. Atanassov, Co-generation of hydrogen and power/current pulses from super-capacitive MFCs using novel HER iron-based catalysts, Electrochim. Acta 220 (2016) 672–682,https://doi.org/10.1016/j.electacta.2016.10.154. [10] M. Kokko, F. Bayerköhler, J. Erben, R. Zengerle, P. Kurz, S. Kerzenmacher,
Molybdenum sulphides on carbon supports as electrocatalysts for hydrogen evo-lution in acidic industrial wastewater, Appl. Energy 190 (2017) 1221–1233,
https://doi.org/10.1016/j.apenergy.2016.12.097.
[11] I. Ieropoulos, J. Greenman, C. Melhuish, Urine utilisation by microbial fuel cells; energy fuel for the future, Phys. Chem. Chem. Phys. 14 (2012) 94–98,https://doi. org/10.1039/c1cp23213d.
[12] C. Santoro, R. Gokhale, B. Mecheri, A.D. Epifanio, Design of Iron ( II )
Phthalocyanine-derived Oxygen Reduction Electrocatalysts for High-power-density Microbial Fuel Cells, (2017), pp. 3243–3251,https://doi.org/10.1002/cssc. 201700851.
[13] S. Angioni, L. Millia, G. Bruni, D. Ravelli, P. Mustarelli, E. Quartarone, Novel composite polybenzimidazole-based proton exchange membranes as efficient and sustainable separators for microbial fuel cells, J. Power Sources 348 (2017) 57–65,
https://doi.org/10.1016/j.jpowsour.2017.02.084.
[14] V.M. Ortiz-Martínez, M.J. Salar-García, K. Touati, F.J. Hernández-Fernández, A.P. de los Ríos, F. Belhoucine, A.A. Berrabbah, Assessment of spinel-type mixed valence Cu/Co and Ni/Co-based oxides for power production in single-chamber microbial fuel cells, Energy 113 (2016) 1241–1249,https://doi.org/10.1016/j. energy.2016.07.127.
[15] S. Marzorati, A. Schievano, A. Colombo, G. Lucchini, Ligno-cellulosic materials as air-water separators in low-tech microbial fuel cells for nutrients recovery, J. Clean. Prod. 170 (2018) 1167–1176,https://doi.org/10.1016/j.jclepro.2017.09.142. [16] W.-W. Li, G.-P. Sheng, X.-W. Liu, H.-Q. Yu, Recent advances in the separators for
microbial fuel cells, Bioresour. Technol. 102 (2011) 244–252,https://doi.org/10. 1016/j.biortech.2010.03.090.
[17] I.A. Ieropoulos, A. Stinchcombe, I. Gajda, S. Forbes, I. Merino-Jimenez, G. Pasternak, D. Sanchez-Herranz, J. Greenman, Pee power urinal–microbial fuel cell technologyfield trials in the context of sanitation, Environ. Sci. Water Res. Technol. 2 (2016) 336–343,https://doi.org/10.1039/C5EW00270B.
[18] D.G. Allison, The biofilm matrix, Biofouling 19 (2003) 139–150,https://doi.org/ 10.1080/0892701031000072190.
[19] J.C. Wei, P. Liang, X.X. Cao, X. Huang, A new insight into potential regulation on growth and power generation of geobacter sulfurreducens in microbial fuel cells based on energy viewpoint, Environ. Sci. Technol. 44 (2010) 3187–3191,https:// doi.org/10.1021/es903758m.
[20] P. Aelterman, S. Freguia, J. Keller, W. Verstraete, K. Rabaey, The anode potential regulates bacterial activity in microbial fuel cells, Appl. Microbiol. Biotechnol. 78 (2008) 409–418,https://doi.org/10.1007/s00253-007-1327-8.
[21] X. Zhu, J.C. Tokash, Y. Hong, B.E. Logan, Controlling the occurrence of power overshoot by adapting microbial fuel cells to high anode potentials,
Bioelectrochemistry 90 (2013) 30–35,https://doi.org/10.1016/j.bioelechem.2012. 10.004.
Extracellular polymeric substances are transient media for microbial extracellular electron transfer, Sci. Adv. 3 (2017) 1–9,https://doi.org/10.1126/sciadv.1700623. [24] S. Jung, J.M. Regan, Influence of external resistance on electrogenesis,
methano-genesis, and anode prokaryotic communities in microbial fuel cells, Appl. Environ. Microbiol. 77 (2011) 564–571,https://doi.org/10.1128/AEM.01392-10. [25] P. Aelterman, M. Versichele, M. Marzorati, N. Boon, W. Verstraete, Loading rate and
external resistance control the electricity generation of microbial fuel cells with different three-dimensional anodes, Bioresour. Technol. 99 (2008) 8895–8902,
https://doi.org/10.1016/j.biortech.2008.04.061.
[26] H. Rismani-Yazdi, A.D. Christy, S.M. Carver, Z. Yu, B. a Dehority, O.H. Tuovinen, Effect of external resistance on bacterial diversity and metabolism in cellulose-fed microbial fuel cells, Bioresour. Technol. 102 (2011) 278–283,https://doi.org/10. 1016/j.biortech.2010.05.012.
[27] K.P. Katuri, K. Scott, I.M. Head, C. Picioreanu, T.P. Curtis, Microbial fuel cells meet with external resistance, Bioresour. Technol. 102 (2011) 2758–2766,https://doi. org/10.1016/j.biortech.2010.10.147.
[28] G. Pasternak, J. Greenman, I. Ieropoulos, Regeneration of the power performance of cathodes affected by biofouling, Appl. Energy 173 (2016),https://doi.org/10. 1016/j.apenergy.2016.04.009.
[29] N. Degrenne, F. Buret, B. Allard, P. Bevilacqua, Electrical energy generation from a large number of microbial fuel cells operating at maximum power point electrical load, J. Power Sources 205 (2012) 188–193,https://doi.org/10.1016/j.jpowsour. 2012.01.082.
[30] G. Pasternak, J. Greenman, I. Ieropoulos, Regeneration of the power performance of cathodes affected by biofouling, Appl. Energy 173 (2016) 431–437,https://doi. org/10.1016/j.apenergy.2016.04.009.
[31] I. Ieropoulos, G. Pasternak, J. Greenman, Urine Disinfection and in Situ Pathogen Killing Using a Microbial Fuel Cell cascade System, (n.d.). doi:10.1371/journal. pone.0176475.
[32] F. Zhao, R.C.T. Slade, J.R. Varcoe, Techniques for the study and development of microbial fuel cells: an electrochemical perspective, Chem. Soc. Rev. 38 (2009) 1926–1939,https://doi.org/10.1039/b819866g.
[33] B.E. Logan, B. Hamelers, R. Rozendal, U. Schröder, J. Keller, S. Freguia, P. Aelterman, W. Verstraete, K. Rabaey, Microbial fuel cells: methodology and technology, Environ. Sci. Technol. 40 (2006) 5181–5192,https://doi.org/10.1021/ es0605016.
[34] J. Winfield, I. Ieropoulos, J. Greenman, J. Dennis, The overshoot phenomenon as a function of internal resistance in microbial fuel cells, Bioelectrochemistry 81 (2011) 22–27,https://doi.org/10.1016/j.bioelechem.2011.01.001.
[35] G. Pasternak, J. Greenman, I. Ieropoulos, Comprehensive study on ceramic mem-branes for low-cost microbial fuel cells, ChemSusChem 9 (2016) 88–96,https://doi. org/10.1002/cssc.201501320.
[36] N.S. Malvankar, M.T. Tuominen, D.R. Lovley, Biofilm conductivity is a decisive variable for high-current-density Geobacter sulfurreducens microbial fuel cells, Energy Environ. Sci. 5 (2012) 5790,https://doi.org/10.1039/c2ee03388g. [37] S.T. Read, P. Dutta, P.L. Bond, J. Keller, K. Rabaey, Initial development and
structure of biofilms on microbial fuel cell anodes, BMC Microbiol. 10 (2010) 98,
https://doi.org/10.1186/1471-2180-10-98.
[38] P.G. Dennis, B. Virdis, I. Vanwonterghem, A. Hassan, P. Hugenholtz, G.W. Tyson, K. Rabaey, Anode potential influences the structure and function of anodic elec-trode and electrolyte-associated microbiomes, Sci. Rep. 6 (2016),https://doi.org/ 10.1038/srep39114.
[39] A.S. Commault, G. Lear, M.A. Packer, R.J. Weld, Influence of anode potentials on selection of Geobacter strains in microbial electrolysis cells, Bioresour. Technol. 139 (2013) 226–234,https://doi.org/10.1016/j.biortech.2013.04.047.
[40] S. Ishii, S. Suzuki, T.M. Norden-Krichmar, T. Phan, G. Wanger, K.H. Nealson, Y. Sekiguchi, Y.A. Gorby, O. Bretschger, Microbial population and functional dy-namics associated with surface potential and carbon metabolism, ISME J. 8 (2014) 963–978,https://doi.org/10.1038/ismej.2013.217.
[41] P. Ledezma, J. Greenman, I. Ieropoulos, Maximising electricity production by controlling the biofilm specific growth rate in microbial fuel cells, Bioresour. Technol. 118 (2012) 615–618,https://doi.org/10.1016/j.biortech.2012.05.054. [42] I. Ieropoulos, J. Winfield, J. Greenman, Effects offlow-rate, inoculum and time on
the internal resistance of microbial fuel cells, Bioresour. Technol. 101 (2010) 3520–3525,https://doi.org/10.1016/j.biortech.2009.12.108.
[43] H. Liu, S. Cheng, B.E. Logan, Power generation in fed-batch microbial fuel cells as a function of ionic strength, temperature, and reactor configuration, Environ. Sci. Technol. 39 (2005) 5488–5493,https://doi.org/10.1021/es050316c. [44] M. Santini, S. Marzorati, S. Fest-Santini, S. Trasatti, P. Cristiani, Carbonate scale
deactivating the biocathode in a microbial fuel cell, J. Power Sources 356 (2017) 400–407,https://doi.org/10.1016/j.jpowsour.2017.02.088.
[45] J. An, N. Li, L. Wan, L. Zhou, Q. Du, T. Li, X. Wang, Electricfield induced salt precipitation into activated carbon air-cathode causes power decay in microbial fuel cells, Water Res. 123 (2017) 369–377,https://doi.org/10.1016/j.watres.2017.06. 087.
[46] A. Paitier, A. Godain, D. Lyon, N. Haddour, T.M. Vogel, J.M. Monier, Microbial fuel cell anodic microbial population dynamics during MFC start-up, Biosens. Bioelectron. 92 (2017) 357–363,https://doi.org/10.1016/j.bios.2016.10.096. [47] N.J. Beecroft, F. Zhao, J.R. Varcoe, R.C.T. Slade, A.E. Thumser, C. Avignone-Rossa,
Dynamic changes in the microbial community composition in microbial fuel cells fed with sucrose, Appl. Microbiol. Biotechnol. 93 (2012) 423–437,https://doi.org/ 10.1007/s00253-011-3590-y.
[48] L. Rago, S. Zecchin, S. Marzorati, A. Goglio, L. Cavalca, P. Cristiani, A. Schievano, A study of microbial communities on terracotta separator and on biocathode of air breathing microbial fuel cells, Bioelectrochemistry 120 (2018) 18–26,https://doi. org/10.1016/j.bioelechem.2017.11.005.
[49] Z. Ren, H. Yan, W. Wang, M.M. Mench, J.M. Regan, Characterization of microbial fuel cells at microbially and electrochemically meaningful time scales, Environ. Sci. Technol. 45 (2011) 2435–2441,https://doi.org/10.1021/es103115a.
[50] H.C. Boghani, J.R. Kim, R.M. Dinsdale, A.J. Guwy, G.C. Premier, Control of power sourced from a microbial fuel cell reduces its start-up time and increases bioelec-trochemical activity, Bioresour. Technol. 140 (2013) 277–285,https://doi.org/10. 1016/j.biortech.2013.04.087.
[51] R.P. Pinto, B. Srinivasan, S.R. Guiot, B. Tartakovsky, The effect of real-time external resistance optimization on microbial fuel cell performance, Water Res. 45 (2011) 1571–1578,https://doi.org/10.1016/j.watres.2010.11.033.