Operationalising and measuring language dominance
Jeanine Treffers-Daller
To appear in the International Journal of Bilingualism, first issue of 2011.
University of the West of England, Bristol
Department of Languages, Linguistics and Area Studies Faculty of Social Science and Humanities
Frenchay Campus Coldharbour Lane Bristol
BS16 1QY
Tel.: 0117-3282390 Fax: 0117-3282820
Abstract
The aim of this article is to show how measures of lexical richness (Guiraud 1954; Malvern, Richards, Chipere and Durán, 2004) can be used to operationalise and measure language dominance among bilinguals. A typology of bilinguals is proposed based on these measures of lexical richness, and the validity of the typology is then investigated in an empirical study among two groups of bilingual informants with different language dominance profiles (25 Dutch-French bilinguals from Brussels and 24 French-English bilinguals from Paris). The most important advantage of the proposed operationalisation is that it allows researchers carry out precise measurements of bilingual ability in languages or language varieties for which no standardised tests exist and that these measures can be calculated on oral data that have been collected in an informal and unobtrusive way, in a naturalistic setting.
Acknowledgements
I would like to thank the Research Committee of Faculty of HLSS at UWE Bristol for giving me a sabbatical term and financial support for travelling to Brussels in 2006 and the
1. Introduction
In this article I hope to show how measures of lexical richness can be used to shed new light on what it means to be bilingual. While most researchers concur with Grosjean (1997, p. 167) that “bilinguals are specific and fully competent speakers-hearers who have developed a communicative competence that is equal but different in nature to that of monolinguals” , few researchers study the precise nature of this specific competence any further, and there is no universally agreed classification of bilinguals (Altarriba and Heredia, 2008, p. 19). Many researchers use the term language dominance without providing any measurements of their subjects‟ knowledge of either language, thereby leaving it unclear what language dominance
means in linguistic terms; that is to say, they fail to specify which components of the language system are more developed in one language than in the other in bilinguals.
Some researchers are reluctant to engage in precise assessments of bilinguals‟ language ability because this often leads to negative views of bilinguals. A comparison of bilinguals with monolinguals often leads to the bilingual being seen as deficient, in particular if bilinguals are compared to monolinguals in one of their languages only – often their weaker language (see Cook, 1997 on the monolingual bias that is built into SLA research) . As Grosjean (2008, p. 20) has pointed out, researchers who adopt a holistic view of bilinguals need to study both languages of a bilingual, and not just one of his/her languages.
make it possible to measure receptive and productive language ability in bilinguals have been developed. The question remains which test or tool is most suitable for a particular group.
The main aim of this article is to show that, if applied rigorously, measures of lexical richness are valid indices of (lexical aspects of) language ability in both languages of a bilingual. I also hope to show how lexical richness measures can be used to operationalise language dominance. These measures are being calculated with the help of computational tools for the analysis of spoken language that are available under CLAN, the computerised data analysis tools developed by MacWhinney and colleagues (MacWhinney, 2000). The approach taken here is similar to that of Yip and Matthews (2006), although they operationalised language dominance among bilingual children on the basis of MLU scores in the two languages. As the informants in this study are adults MLU scores cannot be used, and an alternative measure of language dominance for older bilinguals needs to be found.
2. Bilingual ability: constructs and measurements
Although there is no widely accepted typology of bilinguals, a good overview of different psychological dimensions of bilingual ability can be found in Hamers and Blanc (2000, p. 9). The first dimension they mention is based on the notion of language dominance, i.e. the relationship between the competencies in the two languages of the bilingual. A distinction is often made between balanced bilinguals who have equivalent competence in both languages, and dominant bilinguals whose competence in one language is more developed than that in the other (Hamers and Blanc, 2000: 8). It is interesting that Hamers and Blanc do not assume that being balanced necessarily implies a high level of competence in both languages: rather they assume it refers to a state of equilibrium. It is not entirely clear though when such a state of equilibrium is achieved, as the authors claim this does not necessarily imply being able to use both languages for all functions and all domains. Many researchers point out that completely balanced bilinguals are very rare. Rather, it is much more common for bilinguals to be dominant in one or the other language (Baker and Prys Jones, 1998, p. 12). To Grosjean (2008, p. 24) language dominance is a reflection of the complementarity principle, i.e. the fact that bilinguals use their two languages for different purposes (or different domains) in daily life.
component of language ability (Long and Richards, 2007). Bates and Goodman (1997) contend that the lexicon is important because the development of grammar in L1 acquisition is to a large extent dependent on the development of vocabulary. In addition, they claim that the “richness and diversity of linguistic forms within any particular language are now captured almost entirely by the lexicon” (1997, p. 508). This view is congruent with Chomsky (1995) who sees the lexicon as potentially the locus of all variation. Under this view, it becomes particularly relevant to establish how individuals vary with respect to the knowledge they have of the range of lexical items that are available in the language and how they use that knowledge. Therefore, in my view lexical knowledge is conceptually the most important component of variability in language ability, and ways to measure variation in lexical knowledge and deployment urgently need to be developed.
Although many researchers think that the lexicon is important, they appear to work with very different views of what vocabulary knowledge is, and how it is best measured (Read and Chappelle, 2001). Many vocabulary tests are based on the assumption that vocabulary is a separate component of language ability which can be measured through the analysis of individual word forms without taking into account the contexts in which these words occur. Vocabulary tests such as the Yes/No format (Meara and Buxton, 1987), the Levels Test (Nation, 1990), X-lex and the Peabody Picture Vocabulary test (PPVT) (Dunn and Dunn, 1959/2006) belong in this group because they all consist of a selection of individual lexical items which are offered without making reference to contexts in which they may occur. Other researchers question the existence of vocabulary as a separate construct (Singleton, 1999) or state that the case for a modular distinction between grammar and the lexicon has been overstated (Bates and Goodman, 1997, p. 507).
often take the view vocabulary deployment should be tested in specific usage contexts, preferably on the basis of more naturalistic tasks, such as interviews or story telling (Daller, Treffers-Daller and Van Hout, 2003; Dewaele and Pavlenko, 2003; Malvern, Richards, Chipere and Durán, 2004). A possible disadvantage of discrete, context-independent tests such as the Peabody Vocabulary Test is that they focus on a selection of lexical items only, whereas more naturalistic assessments are comprehensive in that they take into account all the vocabulary that is used in the context of the task (Read, 2000). On the other hand, an advantage of discrete, context-independent tests is that some of these, for example the PPVT, have been standardised, i.e. there are norms for its administration and interpretation, and results obtained from individuals or groups can be compared against a set of norms for different samples of the wider population. To my knowledge this has not been done for measures of lexical richness, which make these less useful for practitioners, e.g. those working in clinical contexts, who need to refer to a set of standardised scores.
In research on bilingual first language acquisition, language dominance is often invoked, but there is no consensus on how it should be defined and measured (Yip and Matthews, 2006, p. 98). Instead of comparing with monolingual control groups, Yip and Matthews proposed to operationalise language dominance by calculating the difference between MLU scores for a child‟s two languages at a given sampling point or (expressed as a
mean) over a period of development, and they show that this measure correctly predicts the directionality of code-mixing and children‟s language preferences.
Important support for the need to carry out precise measurements of vocabulary knowledge and use comes from the psycholinguistic literature on lexical access in bilinguals and L2 learners. According to Kroll, Bobb and Wodnieczka (2006, p. 128) we do not yet have a comprehensive overview of how language ability and relative language dominance affect the processes engaged during the planning of spoken utterances, but they point out that this is an important variable that researchers need to take seriously. Many researchers have shown that bilinguals are slower in picture naming tasks or lexical decision tasks, probably because using two languages has the consequence of lowering the functional frequency of each (Kroll et al, 2006). The bilinguals‟ disadvantage may however disappear if one controls for vocabulary size. Bialystok, Craik and Luk (2008) show that bilinguals whose lexical knowledge is matched to that of monolinguals (using the PPVT) outperform monolinguals on a task of letter fluency and word naming, because bilinguals have an advantage over monolinguals in tasks that involve executive control. Their study illustrates the importance of obtaining precise measurements of informants‟ vocabulary knowledge, which in this case, far from reinforcing existing negative views of bilinguals, contributed to the discovery of exciting new information about the advantages of being bilingual.
put this very aptly when they say that no “single index can represent competence or performance in relation to vocabulary, or for that matter, any other linguistic domain.” It is, therefore, important to argue why a particular dimension of vocabulary knowledge should be measured rather than another dimension.
Psychologists often use the Peabody Picture Vocabulary Test or the Mill Hill Vocabulary Scale (Raven, 1943) or X-lex (Meara and Milton, 2003) to measure receptive vocabulary size, but there is no discussion in the psycholinguistic literature on the reasons for choosing a measure of receptive rather than productive vocabulary knowledge. While vocabulary size (or breadth of vocabulary knowledge) is no doubt important (Meara, 1996), other dimensions of vocabulary knowledge (e.g. depth) are not being considered.
The availability of standardised tests for receptive vocabulary knowledge is of course an important argument for using the PPVT, but very often researchers as well as practitioners are confronted with a situation in which monolingual or bilingual informants speak languages or varieties for which no standardised tests exist. In those circumstances, using measures of vocabulary richness, calculated on the basis of a sample of naturalistic language, to assess language ability is a good alternative.
the use of French, I have used these new tools, for example, to show there are significant differences between Dutch-dominant bilinguals from Brussels and the French-dominant bilinguals from Paris in the diversity of the lexical items they used (Treffers-Daller, 2009).
While it is not possible to review all the studies in which measures of lexical diversity have been used, there is abundant evidence that generic measures such as the Index of Guiraud (Guiraud, 1954) and D (Malvern and Richards, 1997; Malvern, Richards, Chipere and Durán, 2004) are reliable tools and that they can bring to light important differences in lexical diversity between language samples from a range of sources, including learner language (see Van Hout and Vermeer, 2007 for an overview and a critical discussion of the different measures), but to our knowledge apart from the studies of Dewaele and Pavlenko (2003) and Daller et al (2003) measures of lexical diversity have hardly been used to measure bilingual ability across the two languages of bilinguals.
There are many advantages of using lexical richness measures to measure bilingual ability. First of all (because oral samples can be used), informants who cannot read or write in one of their two languages are not disadvantaged; second, elicitation materials (such as a story board) can be used which are appropriate for the ages, backgrounds and cultures of the target group. Third, all the vocabulary used in the language sample (not just a selection) can be analysed, and, moreover, analysed in context (not just isolated words) in a naturalistic setting (not a laboratory). Fourth, both languages of a bilingual can be studied, so that a comprehensive picture of a bilingual‟s language can be obtained. Finally, it is possible to
On the other hand, it should be noted that when measuring lexical richness the data need to be transcribed and formatted in order for the calculations to be carried out. This process is very time consuming, which makes it possibly less suitable as a tool for some clinical applications. While a potential disadvantage which may affect the results of the current approach using story boards to elicit speech, is that not everyone is a good storyteller or feels comfortable with a story telling task, similarly the results for alternative approaches could be depressed because there may be some informants who are uncomfortable with standardised, more formal tests. Consequently, the choice between elicitation tools or tests is a key issue that all researchers in the field need to consider.
3. The current study
In this study we propose to measure bilingual ability with the help of two indices of lexical diversity, the Index of Guiraud (Guiraud, 1954), i.e. the ratio of types (V) over the square root of tokens (N), and D (Malvern et al., 2004), which represents the single parameter of a mathematical function that models the falling curve of the type-token ratio (see also Jarvis, 2002 and McCarthy and Jarvis, 2007 for an appraisal of this measure). I have chosen to work with these two indices as new switches have recently become available under CLAN which make it possible to calculate lexical diversity on lemmatised data sets, in a variety of ways (see below for details). The availability of these tools under CLAN make them attractive options for researchers wishing to measures language ability among their subjects.
the seventeen municipalities of the Brussels-Capital region. They all speak the local varieties of Dutch and French, and some of them also speak the standard varieties of either language.
The second group consists of 24 French-English bilingual students from a business school in Paris where English is used as the medium of instructioni. They grew up with French only but learnt English (and other languages) at secondary school. This group is clearly French-dominant, as is obvious from their language history, even though they use English on a daily basis for all subjects of their studies.
A controlled productive task was chosen rather than a free productive task to ensure the comparability of the content across the three groups, which is particularly important in studies which focus on lexical items. Because the Brussels bilinguals regularly use French in conversation but are not necessarily biliterate, written language tests were not considered appropriate for the target group. Mayer‟s (1969) storybook Frog Where are you? which has frequently been used to study language use of monolinguals and bilinguals (e.g. Berman and Slobin, 1994) was used to elicit semi-spontaneous speech from all individuals in French. In order to avoid translation effects, all informants told another Frog story (Frog goes to dinner: Mayer, 1974) in Dutch or English. All informants were given some preparation time before telling their story individually to the researcher, either in their own home (the participants from Brussels) or in the university they attended (the students from Paris).
Brussels Dutch stories ( for example plateau “tray”, garçon “waiter”, voilà “there you are”,
surtout “above all” , caresseren “to stroke”, content “pleased”) , as well as a few Dutch borrowings in the Brussels French stories (e.g. kadeike “little boy”, kapot “broken”). As these
borrowings are characteristic of the local varieties spoken in Brussels (Baetens Beardsmore, 1971; Treffers-Daller, 1999) they were left in the data. Taking them out would have meant penalising bilinguals for displaying language behaviour that is typical of bilinguals, which is not correct in a holistic view of bilinguals.
For several reasons, using the mor tier for analyses of lexical richness is particularly useful. First, because this tier makes it possible to distinguish between homophones (e.g. tu
„you‟ as a personal pronoun and tu „was silent‟ as the past participle of the verb se taire „to be silent‟) which is only possible on the main tier by adding disambiguation codes by hand.
Second, on the mor tier all entries are lemmatised. The mor tier offers a lemmatisation standard that can be used by everyone. Third, new switches that can be used with the frequency command FREQ have recently become available under CLAN. These make type and token analyses of individual syntactic categories on the mor tier possible, which is extremely useful for studies of lexical richness.
One of the problems involved in using the mor tier is that the codes used on this tier for the different languages are somewhat different. This is understandable as different codes are needed for languages that are typologically different (see the CHAT manual, p. 101), but even for languages as closely related as French, English and Dutch, the coding systems are different. For French, for example, different forms of the verb trouver „to find‟, for example, are categorised on the mor tier with codes that appear before the pipe separator “|”. Past participle forms are indicated with the code “pp” (v:pp|trouver), infinitives with “inf” v:inf|trouver, progressives with “prog” (v:prog|trouver) and other forms with a simple “v”
for progressive forms are indicated after the pipe separator, so that talking is coded as follows: part|talk-PROG. In Dutch past participle are coded after the pipe separator, so that
gesproken “talked” is coded as v|praat&PERF.
In order to make calculations on the mor tier comparable across languages, I therefore needed to bring into line the codes that are used to classify verbs into different subcategories in the three languages. For the purposes of this paper I decided to erase the subcategories of verbs with the help of the change string command (CHSTRING), leaving only the codes for modal verbs (v:mdl) and auxiliairies (v:aux) in place, as the distinction between lexical uses of verbs such as avoir (il a un livre „he has a book‟) and auxiliary uses of this verb (il a acheté un livre „he bought a book‟) are obviously important for analyses of lexical richness in the three languages under study. ii All other verbs were therefore categorised as “v|” only.
The morphosyntactic coding on the main tier also needed to be checked by hand for inconsistencies as the post programme (which is used to disambiguate the output of the mor programme) is not error-free. For Dutch, the mor tier needed to be disambiguated by hand, as there is no post programme available for Dutch, and the lexicon needed to be supplemented with dialect items such as vors “frog”. Finally unintelligible speech that is represented on the main tier with xxx is coded as unknown word (unk|xxx) on the mor tier. In order to avoid CLAN counting these codes as separate types, I decided to erase the codes for unintelligible speech on the mor tier too. An example of a transcript with a corrected mor tier is given in appendix one.
French (Gf) and English (Ge). After that, I calculated D with the following command, which calculates D on the mor tier while merging all different inflections: vocd +t%mor -t* +s"*-%%" +s"*~+s"*-%%" +s"*&+s"*-%%" +f. The results of these calculations for Dutch, English and French were also entered into SPSS.
4. Results
4.1 Types, tokens and lexical richness
Before calculating any measures of lexical richness, it is interesting to see how the two groups differ from each other in the number of types they use for the frog stories in Dutch and French (Brussels), or French and English (Paris). Figure 1 gives the percentage of word types in each language, as calculated from the sum of the number of types produced by the informants in both languages. This graph clearly shows that the bilinguals from Brussels are Dutch-dominant in the sense that they use significantly more types for Dutch than for French (t for paired samples = 3.25, df = 24, p < .01), whereas the Paris group produce more types in French than in English (t for paired samples = 5.10, df = 23, p <.001). The differences
Figure 1 Percentage Dutch/French and English/French types (out of all types) for the bilinguals in Brussels and Paris
The differences between the groups from Paris and Brussels become significant if we calculate D for French (Df) (t =3.70, df =47, p < 0.01) or the Index of Guiraud for French (t= 2.45, df = 47, p < .05). It was then decided to use D for the operationalisation of bilingual ability because the Eta2 (a measure of the effect size) is higher for D (Eta2 = .23) than for the Index of Guiraud (Eta2 = .11). These Eta2 values are considerably lower than those reported in Treffers-Daller (2009), but this is due to the fact that the range of scores is much smaller in the current study, in which L2 learners are not included. In this project, only two groups are included (not three), and all informants are bilingual. Although many of the Brusselers in the
0
10
20
30
40
50
60
Brussels
Paris
Dutch/Eng
[image:17.595.77.535.169.412.2]current study are Dutch-dominant, their ability in French is significantly higher than that of the L2 learners of French from Aalst (Flanders), which were included in the previous study.
4.2 Operationalising language dominance
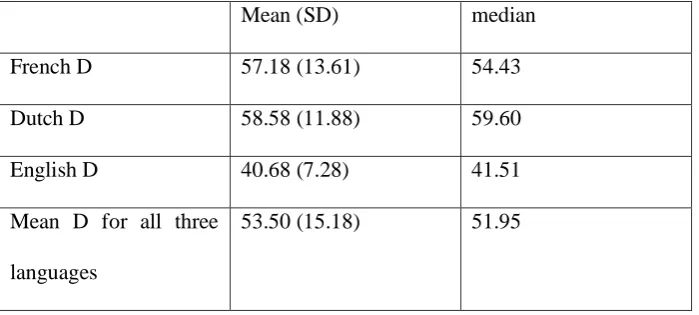
First of all the mean, median and mode of the D value for all three languages was calculated. As Table 1 shows, the mean and the median for the English D scores are relatively low in comparison with the D value for the other languages. The reason for this difference is probably that the informants who told the story in English all learnt English later in life. No stories were told in English by speakers who spoke English from birth, whereas the mean D values for Dutch and French were calculated on the basis of stories from speakers with a wide range of abilities, including those who learnt Dutch or French early in life.
[image:20.595.67.417.606.763.2]In order to divide the informants into a low ability group (group 1) and a high ability group (group 2) for all three languages, an overall group median was calculated for all D values from all three languages. Thus any informant with a D value below the overall group median was allocated to group 1, and informant with a D value above the median was allocated to group 2 for each language. This way, for French for example, fifteen informants in the Brussels group were allocated to group 1 and ten to group 2. Among the Paris group, eight informants were assigned to group 1 and sixteen to group 2.
Table 1 mean and median of D values for each language
Mean (SD) median
French D 57.18 (13.61) 54.43
Dutch D 58.58 (11.88) 59.60
English D 40.68 (7.28) 41.51
Mean D for all three
languages
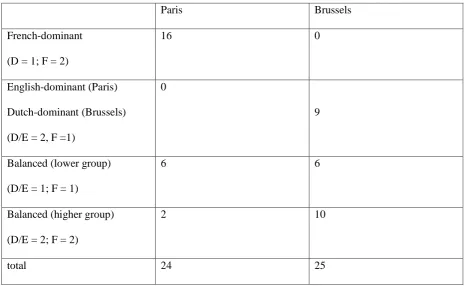
Language dominance was then operationalised using the D scores for both languages of each informant. Informants who were in group 1 for French and group 2 for Dutch were classified as Dutch-dominant, whereas those who were in group 2 for French and group 1 for Dutch were considered to be French-dominant. The remainder were split over two groups of
[image:21.595.65.535.428.714.2]balanced bilinguals: a higher group (in group 2 for both languages) and lower group (in group 1 for both languages). The resulting classification is shown in Table 2. The fact that there are six informants in each group who obtain low scores in both languages may be an indication that these informants were not entirely comfortable with the storytelling task. This cannot be investigated further here.
Table 2: Classification of language dominance among Paris and Brussels informants
Paris Brussels
French-dominant
(D = 1; F = 2)
16 0
English-dominant (Paris)
Dutch-dominant (Brussels)
(D/E = 2, F =1)
0
9
Balanced (lower group)
(D/E = 1; F = 1)
6 6
Balanced (higher group)
(D/E = 2; F = 2)
2 10
Of course a classification such as the one in Table 2 is only valid if it turns out to have a predictive value with respect to other variables. The validity of the classification will therefore be checked in three ways: first of all using Lanza‟s (2004, p. 173) proposal that the directionality of mixing can be an indicator of dominance in that bilinguals switch to the dominant language more often than to the non-dominant language. Second, I checked whether the classification into Dutch- and French-dominant bilinguals correctly predicts whether they use the prefabricated formula il y a NP qui “there is an X who/which” to introduce new referents. This simplified way of introducing referents in stories is often found in French children‟s stories (Jisa and Kern, 1998), and it is also a common feature of the story telling of bilinguals from Brussels (Treffers-Daller, 2009). If the dominance classification is correct, this phenomenon should be found less often among French-dominant bilinguals or highly proficient balanced bilinguals than among Dutch dominant or less proficient balanced bilinguals.
Third, according to the classification in Table 2, there are a large number of balanced bilinguals among the Brussels group, but not among the Paris group. If this classification is valid, there should therefore be a significant correlation between Dutch and French D values obtained for the bilinguals in Brussels, but not between the English and French D values found among the Paris group.
4.3 Language dominance and the directionality of code-switching among Brussels bilinguals
120) and twelve of the 25 informants from Brussels make use of this strategy by switching to Dutch when telling the story in French. They code-switch almost exclusively for metalinguistic reasons, as the task was to tell the story in French or Dutch, which did not encourage spontaneous code-switching. Some informants comment on the difficulty of the task, such as: “I have to look for French words” (informant 5) or asked the interviewer to provide words when they experienced word-finding problems: “what kind of animal is that?” (informant 7), whilst others used code-switching to alert the interviewer to their French ability, saying “that‟s easy enough for a Francophone” (informant 21) or “that goes much faster than in Flemish” (informant 10).
Code-switching in the other direction (to French during the Dutch story telling) is much more limited. Of the two informants who switch to French, one makes a metalinguistic comment on how she thinks something needs to be explained in Brussels dialect (informant 7), the other corrects herself that the animal on the picture is not a tortoise but a frog, using French non “no” to mark her correction (informant 25).
(1) ja ah schildpad non kikvors . “Yes right, tortoise, no frog.”
There is hardly any code-switching to French among the Paris group, probably because the informants were aware that the researchers who collected the data in English were not fluent in French. A further investigation of the directionality of code-switching among this group is therefore not very useful. One informant in the group makes a metalinguistic comment, but he chooses to make this comment in English rather than in French (informant 710), and another one uses a few French words the verb aterrir “to land” and the noun calin “cuddle” whilst telling the story in English (informant 610):
(2) After just before leaved the house, he make a calin en français with his dog . “… he gave his dog a cuddle, in French.”
4.4 The use of a prefabricated formula by Brussels bilinguals
The bilinguals‟ use of a prefabricated formula provides interesting information that can be
used to validate our operationalisation of language dominance. The focus is here on the construction il y a NPqui “there is NP who/which” illustrated in (3).
(3) Là le chien il pousse à l'arbre et il y a la la ruche qui tombe (informant 22) There the dog pushes against the tree and there is the the beehive which falls down.
Jisa and Kern (1998) show that French children frequently use this strategy to introduce new referents in frog stories, and the Brussels bilinguals use the same strategy to present new referents or new developments in the story. The prefabricated formula il y a NP qui is also frequent in L2 learners‟ spoken and written language (Guillot, 2005, p. 120). According to Guillot it is not necessarily an indication of non-nativeness however because it also occurs in unplanned native speaker speech.
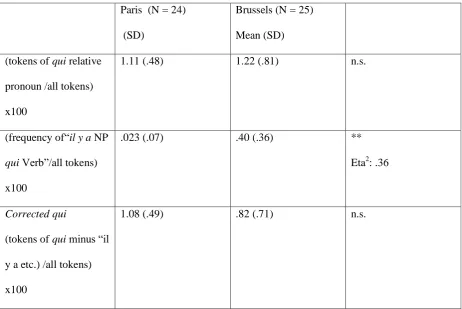
Table 3 Relative frequency of the relative pronoun qui by the Paris and the Brussels bilinguals
Paris (N = 24)
(SD)
Brussels (N = 25)
Mean (SD)
(tokens of qui relative
pronoun /all tokens)
x100
1.11 (.48) 1.22 (.81) n.s.
(frequency of“il y a NP
qui Verb”/all tokens)
x100
.023 (.07) .40 (.36) **
Eta2: .36
Corrected qui
(tokens of qui minus “il
y a etc.) /all tokens)
x100
1.08 (.49) .82 (.71) n.s.
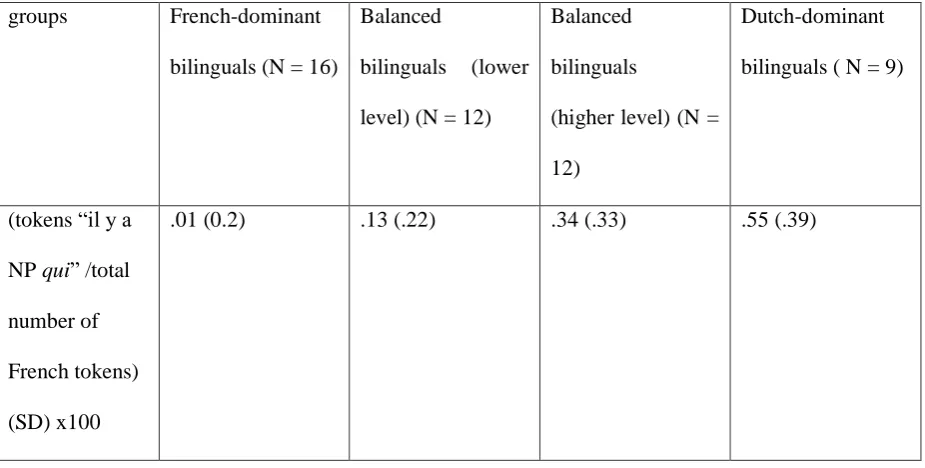
The differences between the two groups are probably best explained on the basis of language dominance, in that it is mainly Dutch-dominant bilinguals who overuse this relatively simple prefabricated frame to introduce new referents. We can test this hypothesis by counting the use of the prefabricated frame in the stories of French-dominant bilinguals and Dutch-dominant bilinguals, using our operationalisation of language dominance as the independent variable to create four groups of speakers.
[image:26.595.67.530.162.471.2]4.15, df = 8.03, p = <.01) and from the balanced bilinguals (higher level) (t= 3.48, df = 11.07, p <.01) , but not from the balanced bilinguals lower level (t = 1.91, df = 11.2, p=.08). Most importantly, if language dominance as defined here is used as the group variable, the Eta2 value obtained (Eta2 = .399) is higher than when we use the classification based on the geographical origin (Paris versus Brussels) of the speakers (Eta2 =.360). Thus, the language dominance criteria, based on D, are more powerful in predicting the use of the prefabricated formula “il y a NP qui” than the geographical criteriaiv.
Table 4 Relative frequency of the prefabricated formula “il y a NP qui” among
French-dominant bilinguals, balanced bilinguals and Dutch-French-dominant bilinguals
groups French-dominant
bilinguals (N = 16)
Balanced
bilinguals (lower
level) (N = 12)
Balanced
bilinguals
(higher level) (N =
12)
Dutch-dominant
bilinguals ( N = 9)
(tokens “il y a
NP qui” /total
number of
French tokens)
(SD) x100
.01 (0.2) .13 (.22) .34 (.33) .55 (.39)
[image:27.595.68.531.367.601.2]Table 5 Relative frequency of the English relative pronoun who
groups French-dominant
bilinguals (N = 16)
Balanced bilinguals (lower) (N =6)
Balanced bilinguals (higher) (N = 2)
(Tokens of who / all English tokens) x100 (SD)
.52 (.41) .42 (.50) .71 (.34)
4.4 Correlations between D-values
As we have seen in Table 2, there are twice as many balanced bilinguals in the Brussels group (namely sixteen) than in the Paris group, where there are only eight. If this classification is valid, we should find significant correlations between the D-values for both languages among the Brussels group, but not among the Paris group.
This prediction is borne out: a positive, fairly strong correlation exists between Dutch and French D-values (r =.484; df = 24, p<.05) but there is no significant correlation between the English and French D-values (r =.269, df = 24, p =.205). These results provide strong support for the validity of the language dominance criteria used here.
5. Conclusion
analyses were based were obtained from a group of 25 Dutch-French bilinguals from Brussels and a group of 24 French-English bilinguals from Paris. All informants told the frog story (frog where are you?) in French and another frog story (frog goes to dinner) in Dutch or English. All recordings were transcribed in CHAT format and carefully checked by hand. The calculations of lexical richness were made on the morphosyntactic tier of the transcripts, on which the data are lemmatised, to avoid indices of lexical richness in French being higher than those in Dutch or English simply because there is a wider range of inflections in French. As the morphosyntactic coding on the mor tier is somewhat different in the three languages, some changes had to be made to this coding to ensure comparability of the calculations across the three languages.
The median of the D-values for all three languages was then chosen as the cut-off point to divide the informants for each language into a lower ability group and a higher ability group. This classification was then used to allocate the participants to four different subgroups: French-dominant (high French, low Dutch/English), balanced at a high level (high French and high Dutch/English), balanced at a lower level (low French and low Dutch) and Dutch/English dominant (High Dutch/English and low French). According to this classification, the majority (sixteen) of the informants from Paris were French-dominant, and ten of the 25 Brusselers were Dutch-dominant. The number of balanced bilinguals was much larger in Brussels (fifteen) than among the informants from Paris (eight). There were no French-dominant bilinguals in Brussels and no English-dominant bilinguals in Paris.
French-English bilinguals hardly switched to French, but this was probably due to the fact that the researchers who collected the data were not seen to be proficient in French.
Second, the informants‟ use of the prefabricated formula il y a NP qui “there is an X who/which” was investigated. This confirms the findings of Jisa and Kern (1998) who
established that children often simplify the introduction of referents in stories in French using this formula, and the current study shows this is also a common feature of the story telling strategies of bilinguals from Brussels (Treffers-Daller, 2009). This phenomenon was found far less often among French-dominant bilinguals or highly proficient balanced bilinguals than among Dutch-dominant or less proficient balanced bilinguals. Most importantly, a calculation of the effect sizes showed that the language dominance classification, based on D, is more powerful in predicting the use of the prefabricated formula “il y a NP qui” than the
geographical criteria: the Eta2 value obtained (Eta2 = .399) is higher when the dominance classification is used as the group factor than when the geographical origin of the speakers (Paris versus Brussels) is used as the group factor (Eta2 =.360).
Third, according to the classification, there are a large number of balanced bilinguals among the Brussels group, but not among the Paris group. If this is indeed the case, positive, significant correlations should be found between D-values for both languages among the Brussels group, but not among the Paris group. This turned out to be the case.
informant are being analysed and not just a selection chosen by the researcher, that borrowings or code-switches can be included in the data analysis, and that elicitation tools (wordless storybooks) can be used that are appropriate for the ages, cultures and backgrounds of the informants in question.
Bibliography
ALTARRIBA, J. & HEREDIA, R. (2008). An Introduction to Bilingualism: Principles and Processes. CRC Press.
APPEL, R. & MUYSKEN, P. (1987). Language contact and bilingualism. London etc.: Edward Arnold.
BACHMAN, L. F. (1990). Fundamental considerations in language testing. Oxford: Oxford University Press.
BACHMAN, L. F., & PALMER, A. S. (1996). Language testing in practice: Designing and developing useful language tests. Oxford: Oxford University Press.
BAETENS BEARDSMORE, H. (1971). Le français régional de Bruxelles, Université Libre de Bruxelles, Institut de Phonétique, conférences et travaux 3. Bruxelles: Presses Universitaires de Bruxelles.
BAETENS BEARDSMORE, H. (1982). Bilingualism: Basic principles. Clevedon: Multilingual Matters.
BAKER, C. & JONES, S. P. (1998). Encyclopedia of bilingualism and bilingual education.
Clevedon, England: Multilingual Matters.
BATES, E. & GOODMAN, J.C. (1997). On the inseparability of grammar and the lexicon: Evidence from acquisition, aphasia, and real-time processing. Language and Cognitive Processes 12, 507-584.
BIALYSTOK, E., CRAIK, F.I.M. & LUK, G. (2008). Lexical access in bilinguals: Effects of vocabulary size and executive control. Journal of Neurolinguistics, 21(6), 522-538.
CHOMSKY, N. (1995). The Minimalist Program. Cambridge, MA: MIT Press.
COOK, V. (1997) Monolingual bias in second language acquisition research. Revista Canaria de Estudios Ingleses 34, 35-50.
DALLER, H., VAN HOUT, R. & TREFFERS-DALLER, J. (2003). Lexical richness in spontaneous speech of bilinguals. Applied Linguistics, 24(2), 197–222.
DEWAELE, J.-M. & PAVLENKO, A. (2003). Productivity and lexical diversity in native and non-native speech: A study of cross-cultural effects. In V. Cook (ed.), The effects of the second language on the first (pp. 120-141). Clevedon: Multilingual Matters.
DUNN, L. M. & DUNN, D. M. (1959, 2006). Peabody Picture Vocabulary Scale. Pearson Assessments.
GROSJEAN, F. (1997). The bilingual individual. Interpreting, 2(1/2), 163-187. GROSJEAN, F. (2008). Studying bilinguals. Oxford University Press.
GUILLOT, M.-N. (2005). Il y a des gens qui disent que ...„there are people who say that ...‟ Beyond grammatical accuracy in FL learners‟ writing: Issues of non-nativeness. International
Review of Applied Linguistics in Language Teaching,43(2), 109–128.
GUIRAUD, P. (1954). Les caractéristiques statistiques du vocabulaire. Paris: Presses Universitaires de France.
GUMPERZ, J. J. (1982). Discourse Strategies. Cambridge: Cambridge University Press. HAMERS, J.F. & BLANC, M.H. (2000). Bilinguality and Bilingualism. Cambridge: Cambridge University Press.
JARVIS, S.(2002). Short texts, best-fitting curves and new measures of lexical
diversity, Language Testing,19: 57–84.
JISA, H. & S. KERN, S. (1998). Relative clauses in French children‟s narrative texts. Journal of Child Language, 25(3), 623-652.
KROLL, J., BOBB, S. C. & WODNIECZKA, Z. (2006). Language selectivity is the exception, not the rule: Arguments against a fixed locus of language selection in bilingual speech. Bilingualism, Language and Cognition, 9(2), 119-135.
MACWHINNEY, B. (2000). The Childes Project. Tools for Analyzing Talk. Lawrence Erlbaum Associates. The most recent version is available on this website: http://childes.psy.cmu.edu/
MALVERN, D. D. & RICHARDS, B.J. (1997). A new measure of lexical diversity. In A. Ryan & A. Wray (eds.). Evolving models of language. Papers from the annual meeting of the British Association of Applied Linguistics held at the University of Wales, Swansea, September 1996 (pp. 58-71). Clevedon: Multilingual Matters.
MALVERN, D. D., RICHARDS, B. J., CHIPERE, N. & DURÁN, P. (2004). Lexical Diversity and Language Development: Quantification and Assessment. Houndmills, Basingstoke: Palgrave Macmillan.
MAYER, M. (1969). Frog Where are You? New York: Dial Books for Young Readers. MAYER, M. (1974). Frog goes to dinner. New York: Dial Books for Young Readers.
MCCARTHY, PH.M. & JARVIS, S. (2007). Vocd: A theoretical and empirical evaluation.
Language Testing, 24(4), 459-488.
MEARA, P. (1996). The dimensions of lexical competence. In G. Brown, K. Malmkjaer & J. Williams (eds.) The Bilingual Lexicon (pp. 279-297). Amsterdam/Philadelphia.
MEARA, P. & BUXTON, B. (1987). An alternative to multiple choice vocabulary tests.
MEARA, P. & MILTON, J.L. (2003). X-Lex. The Swansea Levels Test. Express Publishing MYERS-SCOTTON, C. (1993). Social motivations for Code-switching: Evidence from Africa. Oxford: Oxford University Press.
NATION, I.S.P. (1990). Teaching and Learning Vocabulary New York: Newbury House. RAVEN, J. C. (1943). The Mill Hill Vocabulary Scale. London: H. K. Lewis.
READ, J. (2000). Assessing vocabulary. Cambridge: CUP.
READ, J. & CHAPPELLE, C. (2001). A framework for second language vocabulary assessment. Language Testing 18(1), 1-32.
RICHARDS, B.J. & MALVERN, D.D. (2007). Validity and threats to the validity of vocabulary assessment. In: H. Daller, J. Milton & J. Treffers-Daller (eds.) Modelling and assessing vocabulary knowledge (pp. 79-92). Cambridge: Cambridge University Press. Singleton, D. 1999: Exploring the second language mental lexicon. Cambridge:
Cambridge University Press.
SKUTNAB-KANGAS, T. (1981). Bilingualism or not: The education of minorities. Clevedon, Avon, England: Multilingual Matters.
TREFFERS-DALLER, J. (1999). Borrowing and shift-induced interference: contrasting patterns in French-Germanic contact in Brussels and Strasbourg, Bilingualism: Language and Cognition, 2(1), 1-22.
TREFFERS-DALLER, J. (2009). Language dominance and lexical diversity: How bilinguals and L2 learners differ in their knowledge and use of French lexical and functional items. In B. Richards et al (eds.) Vocabulary Studies in first and second language acquisition. The interface between theory and applications (pp. 74-90). Houndmills Basingstoke: Palgrave Macmillan. YIP, V. & MATTHEWS, S. (2006). Assessing Language Dominance in
i
Two students in the Paris group failed to record their story in English, so the data from these students have been discarded from the data set.
ii Using switches such as +s"*-% %", which tell CLAN to ignore form variants, does not solve the problem,
because these switches only look at information after the pipe separator, not before.
iii
If the transcripts contain words from the interviewer as well as from the informants (as is the case for some informants from Brussels), the words from the interviewer can be ignored if an additional switch is added to the command line (-t*INV, where INV stands for the three letter code that represents the interviewer).
iv
One observer commented that there is a risk of circularity if D values are calculated on the basis of stories which contain the expression “il y a NP qui”. I therefore calculated the D values again for all French stories after deleting this prefabricated formula from the transcript. The differences between the two D-values are minimal, not statistically significant, and within the normal range of D values obtained upon different runs of the programme on the same data set. The original mean D-value for both groups is 57.18 and the revised value is 57.20. The two D-values correlate almost perfectly with each other (r=.999, p < .001; N = 49). Most