J. Mar. Sci. Eng. 2018, 6, x; doi: FOR PEER REVIEW www.mdpi.com/journal/jmse Article
1
DAMAGE CHARACTERIZATION OF
2
NANOINTERLEAVED CFRP UNDER STATIC AND
3
FATIGUE LOADING
4
Mohamad Fotouhi1*, Cristiano Fragassa2, Sakineh Fotouhi3, Hamed Saghafi4, Giangiacomo
5
Minak4
6
1 Department of Design and Mathematics; The University of the West of England; Bristol BS16 1QY; UK;
7
2 Department of Industrial Engineering, University of Bologna, Viale Risorgimento 2, 40136 Bologna, Italy
8
3 Mechanical Engineering Department; University of Tabriz; Tabriz; Iran
9
4 Department of Mechanical Engineering; Tafresh University, Tehran Road; 7961139518; Tafresh; Iran
10
* Correspondence: mohammad.fotouhi@uwe.ac.uk; Tel.: +447407266470
11
12
Received: date; Accepted: date; Published: date
13
Abstract: The use of high strength to weight ratio laminated fiber-reinforced composites is emerging
14
in engineering sectors such as aerospace, marine and automotive to improve productivity.
15
Nevertheless, delamination between the layers is a limiting factor for the wider application of
16
laminated composites, as it reduces the stiffness and strengths of the structure. Previous studies
17
have proven that ply interface nanofibrous fiber reinforcement has an effective influence on
18
delamination resistance of laminated composites materials. This paper aims to investigate the effect
19
of nanofiber ply interface reinforcement on mode I properties and failure responses when subjected
20
to static and fatigue loadings. For this purpose, virgin and nanomodified woven laminates were
21
subjected to Double Cantilever Beam (DCB) specimens. Static and fatigue tests were performed and
22
the acoustic emission data were acquired during the tests. The results showed a 130% increase of
23
delamination toughness for nanomodified specimens in the static loadings and more crack growth
24
resistance in the fatigue loading. The AE results showed that different types of failure mechanisms
25
were the cause of these improvements for the nanomodified composites compared with the virgin
26
ones.
27
Keywords: Nanofibers; Composites; Interleaving; Fatigue; Delamination; Acoustic Emission;
28
Failure Mechanisms.29
30
1. Introduction31
Carbon fiber reinforced polymer (CFRP) composites have many applications in different sectors,
32
such as aerospace, superstructure of ships, automotive, civil engineering and sports goods, due to
33
their high strength-to-weight ratio and rigidity. CFRP are usually produced by stacking several
34
sheets of prepregs together. Unlike the excellent in-plane properties of CFRP, they suffer from
35
damage between the plies such as delamination or cracks, which happen mostly in the matrix areas
36
[1–5].
37
Different methods such as matrix toughening, stitching of the plies, and three-dimensional
38
woven fabrics have been used to prevent delamination. Matrix-toughening has recently attracted a
39
lot of attention at which delamination toughness increases by using toughened material layers during
40
the manufacturing [6-8]. A lot of works have been done on toughening laminated composites using
41
nanofibers interleaving and the overall conclusion was that nanofibers can bring significant benefits
42
to the composite under certain conditions of resin-polymer compatibility, size and amount of
interleave, and type of material [9–11]. New observations showed that mode I fracture toughness of
44
epoxy-resin composites increased with the use of Nylon 66 nanofibers [12, 13] both in static and
45
fatigue loading conditions, if they are treated in a defined condition such as appropriate selection of
46
thickness of nanofibrous and curing temperature.
47
The aim of this paper is to identify failure mechanisms in the Nylon 66 nanofibers-interleaved
48
composites under static and fatigue loadings. Acoustic Emission (AE) technique was used to monitor
49
the generated AE signals originated from the failure mechanisms during static and fatigue loadings
50
of the Nylon 66 nanofiber-interleaved laminates. AE technique was used to identify the damage types
51
in laminated composite and it has been a useful and applicable method [14-21]. AE signal is an
52
intrinsic energy that is generated during various damage mechanisms under loading condition.
53
This paper reports a good correlation between the mechanical data and recorded AE signals that
54
were obtained from the experiments on CFRP interleaved with the Nylon 66 nanofibers under both
55
static and fatigue mode I interlaminar loadings.
56
57
2. Materials and Methods
58
Two types of samples, i.e. virgin and nano-interleaved, were fabricated and tested. The samples
59
were made from 14 plies of plain weave (PW) carbon-epoxy prepreg (GG204P-IMP503Z), with 220
60
gcm, which were stacked together. The prepreg was supplied by Impregnatex Composite Srl (Milan,
61
Italy). The virgin and nano-interleaved laminates were cut from two rectangular panels (300*170
62
mm2) that were cured in an autoclave at 60oC cycle for 2 hours and 130oC cycle for 1 hour, with 6 bar
63
pressure, below Nylon’s melting temperature which is 260oC. Later the rectangular plates were cut
64
to the size of the test samples according to ASTM D5528 standard [23] as illustrated in Figure 1. The
65
only difference between the virgin and nano-interleaved samples was the addition of a Nylon 66
66
nanofiber mat between plies 7 and 8 in the nano-interleaved samples. This nanofibre mat had a 40
67
µm thickness, 18 g/m2 areal density and 400 to 650 nm diameter nanofibers. Electrospinning
68
technology (see Figure 1a for the schematic) was used to fabricate the Nylon 66 nanofiber mats.
69
Electrospun non-woven mats were fabricated using an in-house electrospinning apparatus (Figure
70
1A) composed of: (1) a high voltage power supply, (2) a syringe pump (KDScientific 200 series), (3)
71
four syringes, (4) four Teflon tubes, (5) four needles with diameter of 0.6 mm and (6) a grounded
72
rotating collector (length = 500 mm, diameter = 160 mm) which position relative to needles can be
73
changed. The electrospinning process was carried out at room temperature and under applied
74
voltage of 12 kV, feed rate of 0.01 mL/min and 120 mm was the distance between the collector and
75
tip of the needle. More details regarding the manufacturing process of the composite samples can be
76
found in our previously published paper [13].
77
Although the nano-fibre mat had a 40 µm thickness, but no thickness difference was observed
78
between the nano-interleaved and virgin samples after the curing process and their thickness was
79
measured as 3.5±0.1 mm.
80
As illustrated in Figures 1c and 1d, ASTM D5528 standard was followed in fabrication and
81
testing of the virgin and nano-interleaved DCB specimens [23].
82
The quasi-static experiments were done in an Instron 8033 (a servo presses machine) with a 250
83
N load level, using displacement controlled system with a fixed crosshead speed of 3 mm/min. The
84
load and displacement data was captured by the Instron machine and the crack length was measured
85
by an optical microscope. Modified Beam Theory (MBT) recommended in [23] was used to evaluate
86
energy release rate in mode I.
87
The fatigue samples were identical to the static samples. A naturally developed fatigued crack
88
with 1mm length was created within the specimens prior to the main fatigue tests. This was done by
89
applying cyclic load and producing a 1 mm crack length before the main fatigue tests. ASTM D6115
90
was used for the Fatigue tests [24] and the experiments were done by the same machine used for the
91
static tests, with a 200 N load cell, under 3 Hz load frequency and in displacement control mode, with
92
max/min ratio of R=0.3 . Load, displacement and crack length values were used to evaluate Gmax as
suggested in [25]. Three samples were tested for the quasi-static test and just one sample was tested
94
for each fatigue condition.
[image:3.595.67.522.90.373.2]95
Figure 1. Electrospinning and testing equipment: (a) Schematic of the electrospinning process. (b) The
electrospinning equipment. (c) Schematic of the DCB specimens. (d) DCB specimens and experimental
setup.
96
PCI-2 AE system was used to record the AE wave forms with a sampling rate of 10 MHz. Figure
97
2 shows a schematic of AE wave form and its parameters. A piezoelectric sensor (PAC R15) was used
98
to record the AE signals. A preamplifier (2/4/6-AST) with the gain selector of the 40 dB and 35 dB
99
threshold was used. Calibration of the sensors was done with a pencil lead break test. The AE signal
100
parameters that contain amplitude, duration, counts, rise time, energy, etc. was calculated by AE
101
software (AEWin).
102
103
Figure 2. The definitions for acoustic-emission parameters [26].
[image:3.595.175.420.536.728.2]3. Results and discussion
105
3.1. Mechanical results
106
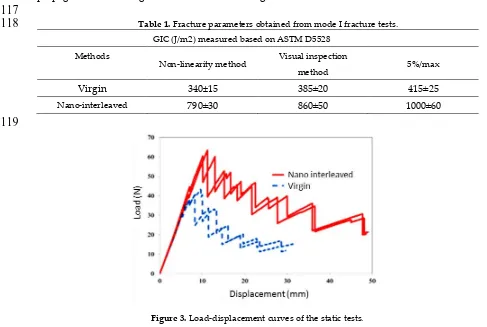
Load-displacement curves for the nano-interleaved and virgin samples are illustrated in Figure 3.
107
The energy release rates are calculated using Equation (1) and are reported in Figure 4. In Equation
108
(1), GIc is the critical energy release rate, P is the applied load, B is specimen’s width, a is the pre-crack
109
length and ∆ is the crack growth. For the fatigue samples, the energy release rates are calculated at
110
the peak value of different number of cycles using Equation (1). The results are clearly showing
111
improvement in the fracture toughness for both static and fatigue loadings.
112
113
Equation (1)
As summarized in table 1, the nano-interleaved samples have shown a 137% and a 124% increase of
114
GIC, compared to the virgin samples. The fracture toughness is improved at both crack initiation and
115
propagation for the fatigue tests as illustrated in Figure 4.
116
117
Table 1. Fracture parameters obtained from mode I fracture tests.
118
GIC (J/m2) measured based on ASTM D5528
Methods
Non-linearity method Visual inspection
method 5%/max
Virgin 340±15 385±20 415±25
Nano-interleaved 790±30 860±50 1000±60
[image:4.595.40.527.324.651.2]119
Figure 3. Load-displacement curves of the static tests.
Figure 4. GImax-Na for the fatigue tests calculated based on ASTM D6115 [22]. GImax is the critical energy
release rate that is required for the crack initiation under different number of cycles (Na).
3.2. AE results
121
Load-time and AE energy–time curves of a virgin sample is illustrated in Figure 5 as a representative
122
of the investigated samples behavior. The load-time is presented instead of the load-displacement
123
diagram to be able to present the mechanical and AE data in one graph. A similar trend was observed
124
for the nano-interleaved samples, where two different stages are observable regarding the
125
mechanical and AE behavior as illustrated in Figure 5.
126
1) Linear elastic region: this is before the initiation and propagation of delamination with no major
127
damage in the specimens, therefore no change in mechanical data, such as stiffness, and no AE
128
signals with high energy content.
129
2) Crack initiation and propagation: crack initiation is where the delamination initiates as the strain
130
energy level reaches the critical strain energy in the laminates. Delamination onset is recognizable
131
where the slope of the load curve versus time decreases (non-linearity point in ASTM5528 [21])
132
and the first significant AE signal is observable. In the propagation stage, the pre-crack is
133
extended and considerable AE signals appeared from delamination extension and arrest, and
134
therefore development of the failure mechanisms. Induced failure mechanisms generate different
135
types of AE signals that can provide valuable information about the type of these failures. The
136
crack arresting stage occurs when there is an increase in the load and therefore stored strain
137
energy. When the strain energy attains the critical value, the crack propagates again and causes
138
different types of damage modes such as fiber breakage, matrix cracking, etc.
Figure 5. Load–time and AE energy time curves for the reference laminate.
140
This section analyzes the AE signals to recognize the failure modes. There is a wide literature about
141
energy or amplitude based characterization of failure modes in composite laminates [27-33]. These
142
studies represent various energy and amplitude domains for the damage modes. These studies
143
reported that the high domains of energy, amplitude and frequency of AE signals are associated with
144
fibre failure, while the middle and low domains are related to delamination/debonding and
145
transverse/longitudinal crack of matrix, respectively. Therefore, three types of signals classification
146
is presented in table 2 based on the recorded AE signals in this paper. This classification is according
147
to previously published works in damage characterization of composite materials using AE [27-33].
148
149
Table 2. Classification of the AE signals based on their amplitude and energy content.
150
Signal type Amplitude (dB) Energy (aJ)
Matrix cracking 40–65 0–30
Debonding 60–85 30–800
Fibre failure 75–100 800–65,000
151
The received AE data are useful to realize the damage modes and help to understand the reason
152
behind the improvement in the fracture toughness of the laminates. Figures 6 and 7 show the
153
obtained AE signals classified based on the aforementioned criteria for the static and fatigue loadings,
154
respectively. The AE events appeared in the virgin samples are higher than the nano interleaved
155
samples (see Figure 6.b.). Matrix cracking related AE signals were less in the nano-interleaved
156
samples compared with the virgin samples as well.
157
Comparing the damage mechanisms in the fatigue loading in Figure 7, the initial damage in the virgin
158
sample is matrix cracking and debonding, whereas the damage in the nano-interleaved sample
159
started with a higher amplitude that is associated with fibre breakage. It means that the toughness
160
improvement in the modified samples is not due to the thicker resin area, and it is mainly due to the
161
existence of tough Nylon 66 nanofibers.
[image:6.595.145.452.470.537.2]Figure 6: (a) Classification of the AE data by Energy and Amplitude levels, (b) Number of the AE
signals associated with different damage modes for the static loading.
[image:7.595.85.506.70.214.2]163
Figure 7. Amplitude versus time distribution of the AE signals for the fatigued samples (a) Virgin
and (b) Nano-interleaved.
164
The morphology of the fractured surface for the virgin and nanomodified specimens is illustrated in
165
Figure 8. Fracture surface of the virgin specimen is mostly containing matrix cracking in the
resin-166
rich section near the fibers between two adjacent plies. On the other hand, fractured surface of the
167
nanomodified specimen is affected by the nanofiber interlayer, so a plastic zone occurred in front of
168
the crack tip during the crack growth.
[image:7.595.79.519.284.435.2]Figure 8. Morphology of the fractured surface for the a) virgin specimen and b) nano-modified
samples under quasi-static loading.
170
5. Conclusions
171
This paper investigated the effect of Nylon 66 nanofibers reinforcement effect on interlaminar
172
properties in mode I and resulted failure mechanisms of carbon/epoxy laminates under fatigue and
173
static loadings. Static test (based on ASTM5528) and fatigue tests (based on ASTM D6115) were
174
applied to the DCB specimens and the samples were monitored by the AE sensors during the tests.
175
The mechanical results proved the effectiveness of the interleaved Nylon 66 nanofibre mate to
176
improve fracture toughness in the delamination propagation and initiation stages for both of the
177
static and fatigue loading conditions. The AE results showed that the number of interlaminar
178
occurred failure modes reduced in the nano-interleaved samples. There were more matrix cracking
179
associated AE signals in the virgin samples compared with the nano-interleaved samples. It means
180
that the reason for the improved fracture toughness is due to the change in the appeared damage
181
mechanisms that require higher energy level to initiate and propagate. Finally, it can be concluded
182
that the nano-interleaved samples can improve the delamination resistance of laminated composites
183
under static and fatigue loadings.
184
Conflicts of Interest: The author(s) declared no potential conflicts of interest with respect to the research,
185
authorship, and/or publication of this article.
186
187
References
188
1. Tsai, G.C.; Chen, J.W. Effect of stitching on mode I strain energy release rate. Compos Struct 2005,69,1–9.
189
2. Wong, D.W.Y.; Lin L.; McGrail, P.T.; et al. Improved fracture toughness of carbon Ebre/epoxy composite
190
laminatesusing dissolvable thermoplastic Ebres. Compos Part A Appl Sci Manuf 2010,41,759–767.
191
3. Wang, CH.; Sidhu, K.; Yang, T.; et al. Interlayer self-healing and toughening of carbon fiber/epoxy
192
composites using copolymer films. Compos Part A Appl Sci Manuf 2012, 43, 512–518.
193
4. Pavlovic, A.; Fragassa, C.; Disic, A. Comparative numerical and experimental study of projectile impact on
194
reinforced concrete. Compos Part B: Engineering 2017,108, 122–130.
195
5. Tang, G.; Yan. Y; Chen, X.; et al. Dynamic damage and fracture mechanism of three-dimensional braided
196
carbon fiber/epoxy resin composites. Mater Design, 2001,22,21–25.
197
6. Van, V.P.; Ballout, W.; Daoust, D.; et al. Influence of thermoplastic diffusion on morphology gradient and
198
7. Sohn, M.S.; Hu, X.Z.; Kim, J.K.; et al. Impact damage characterization of carbon fiber/epoxy composites
200
with multi-layer reinforcement. Compos Part B Eng 2000,31,681–691.
201
8. Wu X; Yarin AL. Recent progress in interfacial toughening and damage selfhealing of polymer composites
202
based on electrospun and solution-blown nanofibers: an overview. J Appl Polym Sci 2013,130(4).
203
9. Koissin V; Warnet LL; Akkerman R. Delamination in carbon-fibre composites improved with in situ grown
204
nanofibres. Eng Fract Mech 2013,101,140–148.
205
10. Daelemans L; van der Heijden S; De Baere I; Rahier H; Van Paepegem W; De Clerck K. Using aligned
206
nanofibres for identifying the toughening micromechanisms in nanofibre interleaved laminates. Compos
207
Sci Technol 2016,124,17–26.
208
11. Yasaee, M.; Bond, I.P.; Trask, R.S.; et al. Mode I interfacial toughening through discontinuous interleaves
209
for damage suppression and control. Compos Part A Appl Sci Manuf 2012,43,198–207.
210
12. Saghafi, H.; Zucchelli, A.; Palazzetti, R.; Minak, G. The effect of interleaved composite nanofibrous mats on
211
delamination behavior of polymeric composite materials. Composite Structures 2014,109,41–47.
212
13. Brugo, T.M.; Minak, G.; Zucchelli, A.; Saghafi, H.; Fotouhi, M. An Investigation on the Fatigue based
213
Delamination of Woven Carbon-epoxy Composite Laminates Reinforced with Polyamide Nanofibers.
214
Procedia Engineering 2015,109,65–72.
215
14. Fotouhi, M.; Saghafi, H.; Brugo, T.; Minak, G.; Fragassa, C.; Zucchelli, A.; et al. Effect of PVDF nanofibers
216
on the fracture behavior of composite laminates for high-speed woodworking machines. P I Mech Eng C-J
217
Mec 2017,231,31-43.
218
15. Marec, A.; Thomas, J.H.; Guerjouma, E.R. Damage characterization of polymer-based composite materials:
219
multivariable analysis and wavelet transform for clustering acoustic emission data. Mech Sys Sig Proc
220
2008,22,1441–1464.
221
16. Uenoya, T. Acoustic emission analysis on interfacial fracture of laminated fabric polymer matrix
222
composites. J Acous Emiss 1995,13,95–102.
223
17. de Oliveira, R.; Marques, A.T.; Health monitoring of FRP using acoustic emission and artificial neural
224
networks. Comput Struct 2008,86,367–373.
225
18. Fotouhi, M.; Pashmforoush, F.; Ahmadi, M.; et al. Monitoring of initiation and growth of delaminationin
226
composite materials using acoustic emission under quasi-static 3-point bending test. J Reinf Plast Compos
227
2011,30,1481.
228
19. Pashmforoush, F.; Fotouhi, M.; Ahmadi, M. Acoustic emission-based damage classification of
229
glass/polyester composites using harmony search k-means algorithm. J Reinf Plast Compos 2012,31, 671–680.
230
20. Saeedifar, M.; Fotouhi, M.; Ahmadi, M.; et al. Prediction of delamination growth in laminated composites
231
using acoustic emission and cohesive zone modeling techniques. J Compos Struct 2015,124,120–127.
232
21. Fotouhi, M.; Ahmadi, M. Acoustic emission based study to characterize the initiation of mode I
233
delamination in composite materials. J Thermoplast Compos Mater 2014,519–537.
234
22. Bohse, J. Acoustic emission characteristics of micro-failure processes in polymer blends and composites
235
Compos Sci Technol 2000,60,1213-1226.
236
23. ASTM D5528. Standard test method for Mode I interlaminar fracture toughness of unidirectional
fiber-237
reinforced polymer matrix composites. Annual Book of ASTM Standards, 2007.
238
24. ASTM D6115. Standard Test Method for Mode I Fatigue Delamination Growth Onset of Unidirectional.
239
Annual Book of ASTM Standards, 1997.
240
25. Ishbir, C.; Banks-Sills, L.; Fourman, V.; Eliasi, R. Delamination propagation in a multidirectional woven
241
composite DCB specimen subjected to fatigue loading. Composites Part B: Engineering 2014,66,180–189.
242
26. Huang, M.; Jiang, L.; Liaw, P.K.; Brooks, Ch.R.; Seeley, R.; Klarstrom, D.L.; Using acoustic emission in
243
fatigue and fracture materials research. Nondestruct Eval Overview 1998,50,11.
244
27. Barré, S.; Benzeggagh, M.L. On the use of acoustic emission to investigate damage mechanisms in
glass-245
fibre-reinforced poly-propylene. Compos Sci Technol 1994,52,369-376.
246
28. Benmedakhene, S.; Kenane, M.; Benzeggagh, M.L. Initiation and growth of delamination in glass/epoxy
247
composites subjected to static and dynamic loading by acoustic emission monitoring. Compos Sci Technol
248
1999,59,201-208.
249
29. Guerjouma, R.E.; Baboux, J.C.; Ducret, D.; Godin, N.; Guy, P.; Huguet, S.; et al. Nondestructive evaluation
250
of damage and failure of fiber reinforced polymer composites using ultrasonic waves and acoustic emission
251
Adv Eng Mater 2001,3,601-608.
252
30. Woo, S.C.; Choi, N.S. Analysis of fracture process in single-edge-notched laminated composites based on
253
31. Palazzetti, R.; Zucchelli,A.; Gualandi, C.; Focarete, M.L.; Donati, L.; Minak, G. Influence of electrospun
255
Nylon 6,6 nanofibrous mats on the interlaminar properties of Gr–epoxy composite laminates. Compos Struct
256
2012,94,571-579.
257
32. Fotouhi ,M.; Ahmadi, M. Investigation of the mixed-mode delamination in polymer-matrix composites
258
using acoustic emission technique. J Reinf Plastic Comp 2014,33,1767-1782.
259
33. Fotouhi, M.; Suwarta, P.; Jalalvand, M.; Czel, G.; Wisnom, M.R. Detection of fibre fracture and ply
260
fragmentation in thin-ply UD carbon/glass hybrid laminates using acoustic emission. Compos A Appl Sci
261
Manuf 2016, 10.1016/j.compositesa.2016.04.003.
262
263
264
© 2018 by the authors. Submitted for possible open access publication under the terms and
265
conditions of the Creative Commons Attribution (CC BY) license
266
![Figure 2. The definitions for acoustic-emission parameters [26].](https://thumb-us.123doks.com/thumbv2/123dok_us/567274.556190/3.595.67.522.90.373/figure-the-definitions-for-acoustic-emission-parameters.webp)
![Figure 4. GImax-Na for the fatigue tests calculated based on ASTM D6115 [22]. GImax is the critical energy](https://thumb-us.123doks.com/thumbv2/123dok_us/567274.556190/5.595.175.422.74.259/figure-gimax-fatigue-tests-calculated-gimax-critical-energy.webp)


