Fast Catheter Segmentation From Echocardiographic
Sequences Based on Segmentation From
Corresponding X-Ray Fluoroscopy for
Cardiac Catheterization Interventions
Xianliang Wu*, James Housden, YingLiang Ma, Benjamin Razavi, Kawal Rhode, and Daniel Rueckert
Abstract—Echocardiography is a potential alternative to X-ray fluoroscopy in cardiac catheterization given its richness in soft tissue information and its lack of ionizing radiation. However, its small field of view and acoustic artifacts make direct automatic segmentation of the catheters very challenging. In this study, a fast catheter segmentation framework for echocardiographic imaging guided by the segmentation of corresponding X-ray fluo-roscopic imaging is proposed. The complete framework consists of: 1) catheter initialization in the first X-ray frame; 2) catheter tracking in the rest of the X-ray sequence; 3) fast registration of corresponding X-ray and ultrasound frames; and 4) catheter segmentation in ultrasound images guided by the results of both X-ray tracking and fast registration. The main contributions include: 1) a Kalman filter-based growing strategy with more clin-ical data evalution; 2) a SURF detector applied in a constrained search space for catheter segmentation in ultrasound images; 3) a two layer hierarchical graph model to integrate and smooth catheter fragments into a complete catheter; and 4) the integration of these components into a system for clinical applications. This framework is evaluated on five sequences of porcine data and four sequences of patient data comprising more than 3000 X-ray frames and more than 1000 ultrasound frames. The results show that our algorithm is able to track the catheter in ultrasound im-ages at 1.3 s per frame, with an error of less than 2 mm. However, although this may satisfy the accuracy for visualization purposes and is also fast, the algorithm still needs to be further accelerated for real-time clinical applications.
Index Terms—Cardiac catheterization, echocardiography, fluo-roscopy, segmentation, tracking.
I. INTRODUCTION
C
ARDIAC catheterization is a category of minimally inva-sive surgery (MIS) procedures in which catheters are in-serted into the heart through a small incision in a patient's neck, arm, or groin. Catheter-based ablation is a minimally invasiveManuscript received August 06, 2014; accepted September 21, 2014. Date of publication September 30, 2014; date of current version March 31, 2015.
Asterisk indicates corresponding author.
*X. Wu is with the Department of Computing, Imperial College London, SW7 2AZ London, U.K. (e-mail: [email protected]).
J. Housden, Y. Ma, B. Razavi, and K. Rhode are with the Division of Imaging Sciences and Biomedical Engineering, King's College London, SE1 7EH London, U.K.
D. Rueckert is with the Department of Computing, Imperial College London, SW7 2AZ London, U.K. (e-mail: [email protected]).
Color versions of one or more of the figures in this paper are available online at http://ieeexplore.ieee.org.
Digital Object Identifier 10.1109/TMI.2014.2360988
procedure to correct a cardiac arrhythmia, such as atrial fibrilla-tion, by ablating specific parts of the cardiac tissue. In this pro-cedure an ablation catheter is used to destroy the abnormal tissue by emitting high-frequency electrical energy from the catheter tip. Other types of catheters such as a lasso catheter or coronary sinus catheter are used to measure the electrical activity of the heart and observe the result of the ablation [1].
Any type of catheterization procedure needs to be closely monitored and guided by intra-operative imaging techniques. Currently, X-ray fluoroscopy and echocardiography (also known as ultrasound, US) are two modalities that are widely used in real-time cardiac interventions. X-ray fluoroscopy is particularly suited to visualizing catheters and is the standard modality to monitor cardiac catheter ablation interventions, but does have limitations: specifically a lack of 3-D soft tissue information and use of harmful radiation. In contrast, echocar-diography does not have the above limitations and can be seen as a good alternative for catheterization procedures. However, acoustic artifacts and a small field of view render guidance only by ultrasound extremely challenging [2]. Catheter visualization is particularly difficult in echocardiography, even for experi-enced physicians, due to the acoustic artifacts and the general difficulty of interpreting ultrasound images. Thus, computer assisted techniques are required to enhance the visualization of the catheters. A fast, accurate and stable algorithm for the detection and tracking of catheters will aid the physician in MIS interventions, by highlighting the catheter location in real-time in the images.
A. Related Work
Most of the earlier approaches focusing on catheter tracking in X-ray images are catheter tip type-specific and cannot be extended to other types. These works have specifically addressed the segmentation and tracking of circumferential mapping catheter tip [3], coronary sinus (CS) catheter tip [4], [5], and multiple CS catheter tips [6]. Recent approaches have focused on tracking the entire catheter (low-contrast sheaths or guide wires) rather than just the catheter tip. A fast parameterized curve tracking strategy has been proposed in [7]and applied to guide-wire tracking based on a discrete optimization framework. Since then, discrete optimization has been preferred to address flexible curve tracking and most of the more recent studies have employed a discrete optimization
framework. In [8], to track deformable guide-wires, the data term of the optimization was modelled through support vector regression based on learning the relationship between features and tracking errors. [9]proposed a hybrid tracking model which combines a graph-based B-spline curve model and geometric landmark matching through a discrete Markov random field (MRF) optimization. In [10], a hierarchical scheme was devel-oped to track a deforming guidewire by combining a semantic guidewire model, a learning-based detector and an online appearance model. A recent study based on guide-wire tracking [7], [11]evaluated several discrete optimization methods and suggested that fast primal-dual (Fast-PD) is one of the most efficient making it ideally suited for real-time applications. However, these discrete optimization approaches can only track an approximately fixed portion of the catheter without large tangential motions. This is mainly because in this optimization framework the corresponding search range along the tangential direction for each control point of the B-spline model is limited, and large tangential motions may cause the control points to move out of the search range. We will elaborate on this in the Methodology section.
In ultrasound imaging, early efforts regarding surgical tool tracking require external markers [12]that are usually impos-sible to attach to micro tools. Biopsy needle tracking in US has been studied previously [13]–[16]but the methods cannot be ex-tended to catheter tracking due to the inherent nonrigidity of catheters and interference from other catheter-like structures. In [17], only the catheter tips were tracked. Although the final pur-pose of catheter tracking is often to localize the catheter tip, it is important that the entire catheters are segmented so that the tip localization is constrained. Recently, several methods have been developed that register the X-ray images to ultrasound images [2], [18]–[21]. Thus, the information from the corresponding X-ray images can assist in detecting or segmenting structures in ultrasound.
Our previous work in [22], [23]provides a framework which employs the transformation between these two modalities to constrain the catheter segmentation in the ultrasound image. This involves three main parts: 1) catheter tracking in the X-ray images; 2) registration of the X-ray and echo images; 3) catheter tracking in the echo images. The first two parts are also used in this paper and will be introduced in detail with more clinical data than in the original work [22], [23]. The last part is to extract the catheter in the echo images based on the results of the first two steps. A curved surface in the 3-D echo image, which corre-sponds to the extracted results in 2-D X-ray images, is back-pro-jected based on this transformation. Then a 3-D SURF detector is used to detect tubular-like features around this surface and a graph model is defined to organize these features. Two end points are defined in this graph and the shortest path between these two ends through this graph model is found. This path is considered as the position of the catheter in the echo images.
B. Challenges and Contributions
[22] and [23]provide a framework for catheter extraction from echo data. However, it fails on most clinical data. The failure is due to three aspects of the method that are unsuitable for the complexities seen in clinical data: 1) the search space
corresponds to a region around the back-projected surface. Due to the surface being curved, normal searches from nearby points on the initial catheter location can lead to an out-of-order set of landmarks defining the new catheter, because of the search regions intersecting on the inside of the curve. Besides, the 3-D SURF detector used in [22]and [23]is designed to detect blob structures, which are different to tubular structures. Thus it is not suitable for tubular structure measurement in 3-D echo volumes; 2) the previous method used a shortest path model in a single layer graph to extract the catheter from the back-projected surface. Clinical data requires a more complex model, especially when the catheter is in an upright position, perpendicular to the X-ray, in the curved surface. Furthermore, the single layer graph method cannot model catheters with discontinuities, meaning that a catheter fragmented by echo artefacts cannot be detected beyond one fragment; and 3) the previous proposed framework has a small tolerance to the registration error, thus the registration obtained from one frame can not be used for the other. Registration has to be carried out every frame.
In this paper we propose an improved framework for catheter tracking in 3-D transesophageal echocardiography (TEE) for cardiac interventions.
Our key contributions lie in the part of catheter segmentation in echo images. 1) A search space around the curved surface is defined with a unified normal search direction and it is straightened to form a rectangular space. The 2-D Speed Up Robust Feature (SURF) detector is used to detect the blob-like structure on the cross-sectional planes of this straightened space where the catheter passes through perpendicularly. This strategy is proved to achieve better performances than some popular vesselness filtering techiniques [24], [25]and the 3-D SURF detector used in [22], [23]. 2) A two-layer graph model, with its corresponding optimal path, is proposed to address catheters with discontinuities and upright positions, which cannot be tackled by the single layer graph in [22], [23]. 3) As to the Kalman filter based growing strategy for catheter extraction, it is our original contribution in the previous work [22], [23]but with insufficient introduction and unconvincing phantom data experiments. Given that no similar study has been performed previously on sufficient clinical data, experimental validation was carefully carried out here. 4) To the best of our knowledge, the proposed system is the first complete system combining X-ray and echo imaging with sufficient clinical data validation. The way how to integrate different modules is also improved to [22], [23]. The registration can be carried out once and then used for other frames. More details, such as the extent of manual interventions, are also specified here. Performance metrics are devised to give a suitable evaluation of the pro-posed system, reflecting not only the real-time performance, segmentation error and completeness of catheter tracking, but also its stability and robustness.
II. METHODOLOGY
A. Pipeline Overview
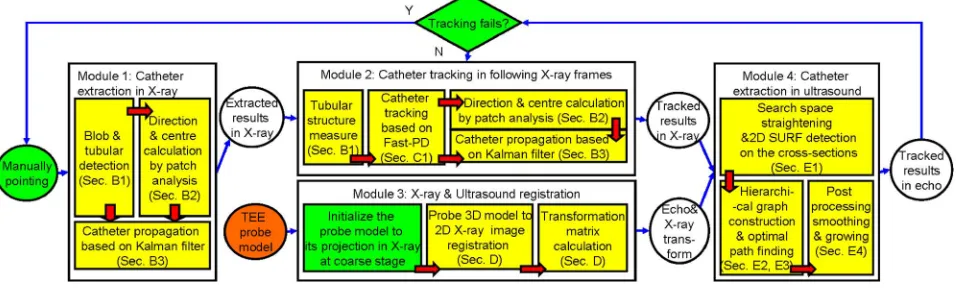
Fig. 1. Overview of the algorithm. Complete algorithm consists of four main modules: catheter extraction as an initialization in the X-ray sequence, catheter tracking in X-ray, X-ray and ultrasound registration, and catheter segmentation in ultrasound. Each module consists of several sub-steps colored in yellow in the figure which will be detailed in the following sections. Blocks in green indicate a potential manual intervention. Block in orange is the offline procedure. Facts regarding manual interventions were not taken into account since the previous system can be fully automatic on phantom data in [22]and [23].
in the first X-ray frame (Section II-B). The semiautomatic approach is necessary when other catheters or catheter-like structures, such as the TEE probe, are simultaneously in the field of view but need not be tracked; then the desired catheters must be specified manually. Electrodes are detected using SURF features and flexible tube is detected using Frangi-based tubular structure detection. Then Kalman filter is employed to extend the extraction from the local electrodes to the whole catheter. After segmentation of the first X-ray frame, the tracking is used to identify the catheter in the following frames (Section II-C). Fast-PD is used to track movements normal to the catheter and a Kalman filter is used to extend the tracked parts to a larger portion of the length of the catheter. This Kalman filter allows for tangential movement of the catheter, which would not be detected by Fast-PD. The X-ray and ultra-sound images are registered by mapping a previously obtained 3-D TEE probe model to its projection image in the X-ray frame [18](Section II-D). This registration is only required at the beginning of the tracking. This is different from our previous framework. In particular there is no reason for registration in every frame since: 1) the registration mainly varies according to respiration but this type of motion is small in our application; 2) our catheter extraction in the echo volume tolerates small errors in the registration. With the results of the X-ray segmentation, the search space in ultrasound is reduced to a narrow region around the curved surface defined by back-projecting the line detected in the X-ray (Section II-E). This reduced space is then transformed to a straightened volume. A SURF detector is used to detect key features on the cross-sectional planes of the 3-D search space and then these features are organized as a two-layer graph model. The optimal path combining the shortest path on the bottom layer graph and the longest path on the top is solved as an estimation of the catheter location in ultrasound. An optional growing stage is used again to ensure that as much of the catheter as possible is tracked.
B. Catheter Initialization in X-Ray Images
The catheter extraction in the X-ray images enables the whole system to be initialized or to recover from a tracking failure. Fig. 2 illustrates each stage of the extraction method.
1) Blob Detection and Tubular Structure Detection: Most catheters have electrodes on the tip, which appear as blob-like structures in the X-ray images. To detect these, the method of Speed Up Robust Features (SURF) detector [26], which is based on integral images, is employed. It is straightforward to extract candidate blobs in the image by setting the threshold for the response of the SURF detector [Fig. 2(b)]. Note that in this paper only the overall SURF detector response is used rather than the 64 dimensional vector response of the SURF descriptor. However, not all detected blobs are retained since not all are located on the shaft of the catheter. To decide which blobs to retain we look for tubular structures in the neighborhood of each blob.
While SURF is used for blob-like electrode detection, the flexible shaft of the catheter requires a different detector. For this the Frangi vesselness filter [24]is a good choice. This de-tector yields a response for a local patch of the image indicating whether a tubular structure passes through [Fig. 2(c)]. We use another threshold, , on the response to determine whether or not a tubular structure is passing through each patch. The fea-ture responses above the threshold are also later used as scores to indicate the likelihood of a catheter fragment being present.
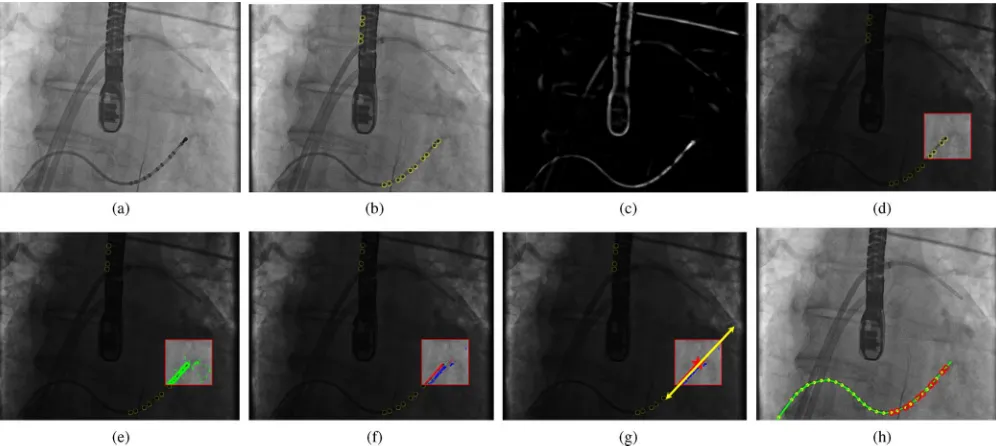
Fig. 2. Catheter extraction as an initialization in X-ray. (a) Example of an original X-ray image. (b) Blob-like structures (including real electrodes and outliers) detected by SURF, highlighted in yellow. (c) Image after Frangi vesselness filtering. (d) Patch located on a potentially relevant blob. (e) Edge points and their gradients extracted within the patch. (f) Edge points classified into two groups corresponding to the two sides of the catheter. (g) Edge points (after RanSaC outlier removal) used to calculate the growing direction and update the centerline. (h) Result of growing using patch analysis and Kalman filtering step-by-step.
The basic assumption is that the section of the catheter in-side the local patch is straight. The basic patch analysis can be divided into edge point extraction, point classification, outlier removal and centerline fitting.
Edge Point Extraction: First, the border of the catheter in the patch is detected using Sobel features [27]based on two Haar filters along the and directions in the integral image. The filter responses of the two directions at a point are collected
into vector . Then the magnitude and the
orientation of the vector are calculated. By thresholding the magnitude of with and selecting the maximum response in a neighborhood, a set of candidate edge points are identified:
[Fig. 2(e)].
Point Classification: Based on the edge points, a histogram
for is constructed. We use rather than for
the histogram so that parallel but opposite edges map to the same histogram bin. The maximum value in the histogram defines the most likely direction of the catheter. Two angles are then defined
from this maximum: and so that . All edge
points are then classified as catheter edges if they are within a certain range of these angles, usually . Edge points are therefore classified into three categories
if if otherwise
(1)
where and represent opposite edges of the catheter [Fig. 2(f)] and contains all other edge points.
Before calculating and , a mask is used to filter the his-togram and set some bins to zero if these correspond to unlikely directions as identified by prior knowledge (if there is avail-able prior knowledge such as the tangential direction calculated in a nearby patch). Patches are analyzed one by one and the prior knowledge can be the output direction from the last patch
analysis in an adjacent patch. The purpose is to ensure only the correct direction, consistent with the direction of the centerline in the previous patch, is calculated. This adds robustness for patches which contain two catheters intersecting each other.
Outlier Removal: Because of the assumption that the section of the catheter inside the local patch is straight, the edge points can be modelled using linear equations. Thus each set and can be modelled with a line equation corresponding to one edge of the catheter within the local patch. Assuming that the proportion of outlier points is below 50%, Random Sample Con-sensus (RanSaC) [28]is a good choice to remove these. In our application, two points (the minimal required quantity to model a line equation) are sampled and a line equation is fitted through them. The distances between this line and the other points are then calculated. If the number of points in the vincinity of the line is above a threshold, the line is accepted and the supporting points are retained while the others are removed as outliers. Out-liers are moved from sets to .
Centerline Fitting: After outliers are eliminated from the two sets, a line equation is determined using [Fig. 2(g)]. This line equation encodes direction and position information and can be
written as . Points from fitting to this line
can be denoted by
(2)
Given the 2-D coordinates of the points from , the
coordinates can be rewritten as . Finding
the centerline can then be easily transformed to a linear opti-mization problem to find the solution that sat-isfies
where and is the total number of points in set . This can be solved using singular value decomposition (SVD). After the parameters of the center-line are determined, the direction angle and the intersection of the centerline and the perpendicular line through the center of the patch are given by
if
if (4)
(5)
where is the center of the patch.
Multiple Line Equation Fitting: In a clinical scenario, mul-tiple catheters may be present in one view simultaneously. It is likely that two or more catheters will be close or intersect each other. Even if only one catheter is present, it may have sharp turns and in the corresponding local patches the line fitting may fail. In such cases, multiple line equations may need to be fitted simultaneously within one patch. A feasible solution is to repeat the above procedure iteratively: in each iteration we perform the above line fitting and the corresponding supporting edge points and are then removed from the histogram. Thus, a dif-ferent line equation is fitted in the next iteration. This procedure is repeated until a stopping criterion is reached, with the cri-terion depending on the numbers of edge points in and and the number of iterations. If the ratio of the numbers of points
and approximates 1 ( in our application) and the sum of these two numbers is above a threshold , then the line equation is accepted. If there is an accepted line fitted and the number of the iteration is below 3, then the loop con-tinues; otherwise it stops. We choose a maximum of 3 iterations because in most of cases the number of catheters in the same patch would not beyond 3.
Parallel Lines Within One Patch: An exception for multiple catheter patch analysis is the case with parallel catheters in one patch. The above strategy cannot work in this case, because the supporting edge points for all parallel catheters are within the same bin in the orientation histogram. Thus they need to be sep-arated first in order to correspond to edges of different catheters. Given a direction , the 2-D spatial positions of all points in and are projected onto an axis with direction . An-other histogram is then constructed with the number of projected points in each bin of this projected axis (the length of the bin is two pixels). Peaks of the histogram which have a large number of projected points (above at least 20), may correspond to the parallel catheters. Points within the bins in the neighborhood of the peak (three pixels distance to the peak) are then used to cal-culate the line equation.
3) Kalman Filter-Based Growing: Given a set of initial blobs detected using SURF, the catheter can be extracted by growing it from each blob to form the whole catheter. At each step of growth, the centerline fitting via local patch analysis is carried out. The measurements (direction and updated center) from the previous step are employed to locate the next patch. If a patch yields no fitted line or the border of the image has been reached, the process is terminated [Fig. 2(h)]. This process can be
inte-grated into a Kalman filter framework. The system model of the Kalman filter is defined as
(6)
The state vector , where and
de-note positions while and denote angular displacement and velocity at th time respectively, is updated at every step as well as its corresponding covariance matrix . is the sampling
time and . We use to denote the
instanta-neous velocity which is then defined as a function of angular velocity
(7)
should be within and (usually set to 1) denotes how sensitive the velocity is in response to the change of . This means that the step size for the growth is proportional to the size of the instantaneous angular velocity. As a result, land-marks are sampled more densely on sharper turns of the curve and more sparsely on smoother sections. The state vector
el-ements and are directly measured by the
values of and obtained from patch analysis.
The system and measurement equations of the Kalman filter can then be written as follows:
(8) (9)
with system matrix
(10) and measurement matrix
(11)
where and .
is the measurement error covariance matrix which is set to
(12)
The coordinate and the direction obtained from the initial patch analysis are used to initialize the first three states in the state vector , , and . is set to zero. The corresponding co-variance matrix is initialized as a diagonal matrix with diag-onal entries (5,5,0.25,0.25). By applying the extended Kalman filter equations, a sequence of sorted displacements
Fig. 3. Catheter tracking in X-ray. (a) An example of a previous frame in X-ray with the result of catheter extraction marked in blue. (b) Next frame with the projection of the previous result in blue and the new result acquired by Fast-PD in red. Dotted lines in green show the search range. (c) An untracked part of the catheter in yellow has been extracted by Kalman filter growing.
C. Catheter Tracking in X-Ray Sequences
1) Fast-PD Catheter Tracking: Fast-PD [29]is a fast dis-crete multi-label approach for optimization of Markov Random Fields (MRF). In our application, the catheter defined by a set of key points can be considered as a graph in which two consec-utive points are linked by an edge. The weight of edges is equal to one. Each point defines a search region in the next frame and each potential location of the catheter in the search region cor-responds to a discrete label. Thus, all of the pixels in the search region of any key point define a label space . The energy func-tion to be minimized using Fast-PD is defined as
(13)
Here, is the selected position in the search
region for each point, also known as the label assignment. The
unary term and the pairwise term are defined
as
if
if (14)
(15)
Given , the unary term depends on the value of , which checks if there is at least one catheter passing through the local patch. If there is no catheter, i.e.
, the unary term will be related to a similarity function , in this case normalized cross-correlation between the previous and current image. The pairwise term is the planar dis-tance between two locations in the search area corresponding to the two labels. is a parameter that trades off the unary and pairwise terms and is chosen manually. The result is a partial segmentation of the catheter in the new frame accounting for motion normal to the catheter [see Fig. 3(b)].
2) Kalman Filter-Based Growing for Tracking: A large search range for the Fast-PD would dramatically slow down the whole algorithm. In our application, we ignore the search range in the tangential direction and retain that of the normal direction because the normal direction is initially more impor-tant. However, the tradeoff is that a large amount of motion in the tangential direction of the catheter could cause the catheter to move out of the search range. To address this, the Kalman filter-based growing is introduced in Section II-B3 to compensate for this.
The Fast-PD optimization yields a sequence of sorted points corresponding to the potential catheter in the next frame. Starting from the two end points of the catheter, each point is checked in turn for whether there is a catheter passing through
using . For each point with the point
is removed and the next adjacent point is checked; for each point with the point is set as the new end point and the process is terminated. As a result, the catheter may be shortened but will have reliable points ( ) as end points. The Kalman filter-based growing is then used to detect new sections starting from the ends which allows for a longer catheter than in the previous view [Fig. 3(c)].
D. Registration of TEE and X-Ray Fluoroscopy
The two modalities are registered using the method in [18]. The transformation matrix between X-ray image space and ul-trasound image space is obtained by registering a previously acquired nano-CT image of the TEE probe to the projection image of the probe in the X-ray. In this registration process, dig-itally reconstructed radiographs (DRRs) are used to simulate the process of X-ray projection and projections of the 3-D probe are generated. The best match between its DRR and the real X-ray projection is then obtained by iteratively adjusting the position and orientation of the 3-D probe image.
The transformation matrix mapping each TEE volume from the TEE image coordinate system to the X-ray coordinate system consists of the three terms
(16)
where transforms the 3-D US volume to the US probe space, denotes the 3-D position of the US probe in the 3-D space of the X-ray scanner, and denotes the projection of the 3-D position in X-ray space to the 2-D X-ray image. and can be acquired from the corresponding imaging de-vices directly or through calibration, while is calculated by a GPU accelerated 2-D/3-D registration as described above. The 2-D error projected on X-ray is reported to be within 2 mm in [18]. An example registration is shown in Fig. 4(a) and the reader is referred to [18]for further details of the registration algorithm.
E. Catheter Extraction in Echocardiographic Images
Fig. 4. Registration of X-ray and ultrasound and an example of the curved sur-face in US corresponding to the catheter curve in X-ray. (a) Registration is car-ried out by registering a previously acquired 3-D probe model to its projection image in X-ray. (b) Flattened image of the curved surface in US which corre-sponds to the curve of the catheter in X-ray.
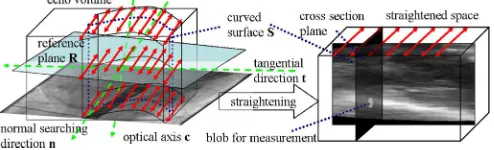
Fig. 5. Search space straightening. Due to X-ray tracking errors and registra-tion errors, the search should be not only within the curved surface defined by the catheter curve in X-ray but also in a margin around the surface. This space is extracted from the 3-D echo image and straightened along the tangential di-rection corresponding to the vector pointing from the last landmark to the first on the catheter.
be extended to ultrasound imaging because no electrodes can be detected in the ultrasound images. In addition, the line fitting based on patch analysis used in the X-ray images becomes very computationally expensive if extended from 2-D to 3-D. The Frangi vesselness filter is also unsuitable because it is sensitive to artifacts in ultrasound. This filter detects too many outlier tubular structures with an inconsistent tangential direction. If the tangential direction is roughly known, then the catheter will show a blob-like appearance in the intersection of the normal plane perpendicular to the tangential direction. Thus, a blob-like detector, using the prior knowledge of the tangential direction, should be more suitable.
Given the extracted result from the corresponding X-ray image and the transformation matrix between these two modali-ties, a curved surface in the 3-D US volume, which corresponds to the curve in 2-D X-ray, can be extracted and the location of the catheter in US is ideally located within this surface. However, in practice, the correct location of the catheter is likely to be near, but not exactly on, this surface because of both X-ray extraction errors and registration errors. Thus, the search for features should not be restricted to the 2-D curved surface but should also be carried out along the direction perpendicular to the surface (see Fig. 5). Because of the curved nature of the surface, the perpendicular lines at different locations on the surface will be in different directions and may intersect each other. This intersection will cause an inconsistent order of the candidate landmarks along these directions compared with the
original order. In order to cope with this, we define only one unified normal search direction for every location on the curved surface. As a result, all normal axes are parallel to each other and no intersection occurs.
We rewrite the transformation matrix as .
For the th landmark location on the X-ray
image, the corresponding ray equation in the 3-D echo volume is then denoted by
(17)
where represents the coordinates of the
voxels in the US volume corresponding to the th landmark in the X-ray image. The rays corresponding to locations on the catheter in the X-ray image form a curved surface . The optical axis of the X-ray imaging system in US space is normal to the X-ray plane. The plane which crosses the center of the US volume with a normal vector along the optical axis is defined as a reference plane . The vector, on this plane , pointing from the projection of one end to the other end of the catheter, is defined as a tangential direction . After that, the normal search direction is defined perpendicular to both and (see Fig. 5). After the unified normal search direction, , and the reference plane, , are defined, the search space surrounding the curved surface is straightened along the tangential direction, , into a regular rectangular volume, . First the direction of each ray corresponding to a landmark on the catheter in X-ray, and the corresponding intersection with the reference plane , are calculated using (17). Then the ray equations can be denoted by
where is bounded by . and
correspond to the intersections of the ray with the border of the original echo volume. Next, the value of each voxel in the straightened volume is calculated by
(18)
where and . is the
intensity value of coordinate in the original echo volume. If is not in the volume, the value is set to zero. The normal search
direction is also bounded by where
restricts the size of the search space along the normal direction. This equation maps the original pixels to their corresponding locations in the straightened space.
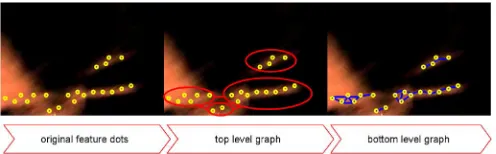
[image:7.592.42.289.274.349.2]po-Fig. 6. Hierarchical graph. Original features (“o” in the figure) are organized in a two-layer graph: a top layer graph taking each cluster of features as nodes (red); and several bottom layer graphs corresponding to each cluster where the features inside the cluster are nodes related by edges (blue) based on distances.
sition. By setting a threshold , a set of candidate locations with corresponding responses , for the th feature on the th ray, are selected for the next steps.
2) Two Layer Hierarchical Graph Construction: Because we know approximately where the catheter may start and end given the information from the X-ray, it is appropriate to include this prior information via a graphical model with corresponding starting and ending nodes.
Given a set of feature location on each ray , they are first clustered into small clusters by a single linkage clustering technique [30]based on the spatial distance. Each cluster cor-responds to a section of a catheter-like structure. Inside each cluster, a low-level graph is constructed based on the feature lo-cations within the cluster and the shortest path corresponds to a potential section of the catheter. Given a set of catheter sections, a high level graph is then constructed considering each section as a node. These two layers are connected via end nodes of the low-level graph. In other words, considering two clusters to be connected, the connecting edge is constructed by connecting the end node of one cluster to the start node of the other cluster. By finding the longest path through this graph, a set of catheter sec-tions are selected and linked together to form a more complete catheter model. The whole path, consisting of an inter-cluster path and several corresponding intra-cluster paths, is finally se-lected as the potential catheter model (Fig. 6). The purpose of this two level hierarchical graph is to preserve the integrity of each catheter-like structure at the low level, but also link them together in an appropriate way.
To achieve this, each ray and pair of consecutive rays is con-sidered. If the distance between a pair of features on these ray(s) is below a threshold , then an edge is allocated to link the two feature locations with a cost of the distance between them. After the single linkage clustering, features are organized
as a set of clusters where the features
in-side each cluster are linked to each other directly or via other features.
Within a cluster, the features ( is the ray index and is the feature index on this ray) with no direct link to other features that have a smaller ray index than are selected as the candi-date starting nodes. Features with no direct link to those with a larger index than its ray index are selected as the candidate ending nodes. Only one pair of starting and ending nodes is se-lected among the candidates for each cluster by maximizing the distance between the starting and ending nodes. This strategy aims to make the corresponding catheter fragment as long as possible. Next, clusters are combined if one cluster 's start or
end point is very close to another cluster 's start or end point , and their directions are almost co-linear. Suppose for clus-ters and , the opposite end or start point is and , then the combination should satisfy
(19) (20)
where represents the angle between vectors and . The starting and ending points are swapped if the start has a larger ray index than the end after cluster combination. Finally, a sub-graph with starting and ending nodes for each cluster is con-structed. These sub-graphs are considered as the bottom layer graphs for the hierarchical graph model.
Following this, a top layer graph is constructed by taking only the start and end of each cluster as the nodes and estab-lishing directed edges among them. The rule of linking edges is as follows: for each cluster , an edge (intra-cluster edge) is created from the start to the end points. For any pair of the clusters which are not combined but are likely co-linear, an edge (inter-cluster edge) is created from the end point of one cluster to the start point of the other cluster. The result is a directed acyclic graph satisfying the assumptions of solving the longest path problem. The weight of an edge should penalize the linked endpoints which are far from each other or the end-points whose corresponding catheter fragments are less likely co-linear. Thus, the weight allocated to each edge is de-signed as
if
if (21)
where is the vector length within the cluster , and is the distance between the ending point of cluster and the starting point of cluster , along .
is the average value of the SURF responses among the features of the cluster. is the turning angle from to and
is the turning angle from to . .
After the top layer graph is constructed, the next step is to find the optimal path.
3) Finding the Optimal Path: At this stage, a two layer hier-archical graph has been constructed. The top layer is a directed acyclic graph. The start and end points of each cluster are nodes in the graph. The edges and their weights are defined by the co-linearity of nearby clusters according to (21). The bottom layer contains several graphs, one for each cluster. The feature locations are the nodes and the edges are the directed links be-tween two features within a threshold. The cost of the edge de-pends on the 3-D distance of two linked nodes. The longest path is selected in the top-layer graph using a dynamic programming technique [31].
[image:8.592.42.290.63.140.2]A shortest path is solved using the algorithm. Each intra-cluster edge of the longest path is then replaced by the corresponding shortest path. As a result, the optimized path not only links some likely catheter segments, but also preserves and smoothes the shape of each catheter segment. In order to extract more than one catheter in the same view, multiple optimal paths can be extracted. This is achieved by repeatedly finding the longest path on the top-layer graph. At the end of each iteration, the nodes which are already selected as the active nodes on the path are ruled out to ensure the extracted optimal paths do not overlap each other.
When multiple catheters are overlapped in the X-ray images, the corresponding search space in echo would have multiple catheters in the view. In this case, the optimal path finding pro-cedure can be performed iteratively to extract multiple catheter candidates. After each iteration, the weights on the extracted path should be altered in order to not extract the same path again in the next iteration. As data containing multiple catheters are rare, this feature of the method is not evaluated here.
4) Postprocessing: The above operations are performed in the straightened space . In the final postprocessing operations, all catheter points are transformed back to the original echo volume. These points are then used to define a B-spline curve that models the catheter. The direction of each point on the catheter is then computed using a first-order derivative of the B-spline curve at .
Because the overlap of the X-ray and echo images is some-times limited by registration errors or only a small percentage of the catheter is extracted from the X-ray, we optionally use a growing step to extend the extracted part of the catheter to the unextracted parts. Because the patch analysis in 3-D is compu-tationally expensive, it cannot be used to obtain accurate mea-surements for the Kalman filter framework. We therefore do not use the same method used above for X-ray images. How-ever, since the catheter is smoother in 3-D than in 2-D (the pro-jection effect in 2-D can cause sharp changes of direction), a straightforward and simple strategy can be applied here: Before applying the growing method, we compute Frangis vesselness response for each point, starting at each end point and working inwards. Points are discarded as end points until a response is found above a threshold . This ensures that incorrectly tracked parts of the catheter, which are caused by a change of length or shape, are ignored.
This is followed by the growing step. Starting from the cur-rent estimate of the end points of the catheter, the growing di-rection is along for the first landmark and for the last one. Given two adjacent landmarks and , the step size for the catheter growing is
(22)
where and are the maximum and minimum size of growth step. This means that smaller steps are used when a sharp turn occurs and larger steps are used if the catheter is linear. The catheter growth direction combined with the step size points to the next candidate position
(23)
The final position of the next landmark is determined by finding the voxel within a defined neighborhood (in our case 10 voxel distance) of with the largest Frangi vesselness response in this neighborhood. The Frangi response is used because the 2-D SURF measurements are only applicable in the straight-ened space but not in the original space. The growth will be terminated if all of the candidates' responses within the neigh-borhood are below the threshold .
III. EXPERIMENTS
Two types ofin vivodata, consisting of five short sequences of porcine data and four long sequences of patient data, were used in our experimental evaluation. The porcine data simulated an electrophysiology procedure. This type of data was used to evaluate the extraction and tracking algorithm in X-ray images. For each frame, three X-ray images were taken simultaneously at different angles. All of the images are high dose X-ray im-ages for improved image quality. The patient data were taken during trans-catheter aortic valve implantation procedures. All of these X-ray images were low dose images. All images con-tain a guide wire as well as a catheter. The frame rate of the porcine X-ray sequences is 15 fps and approximately 8 10 frames cover one heartbeat. The frame rate of the patient X-ray images is 30 fps and approximately 30 35 frames cover one heartbeat. The frame rate of the patient echo data is around 6 7 fps and 6 8 frames cover one heartbeat. The main movement type is cardiac motion rather than respiratory motion for both types of data. For the echo data, we also estimate the motion between two adjacent frames given its low frame rate, which means the motion between two adjacent frames is expected to be large and difficult to address. The average movements be-tween frames along the normal and tangential directions are ap-proximately 4 and 6 mm, respectively. The X-ray and echo se-quences for both the porcine and patient data were synchronized by manually matching temporal image frames. The ground truth catheter locations in the X-ray and echo images were defined by manual marking. For X-ray images, the ground truth is easy to identify and the inter-user variability for ground truth marking should be low. However, the ground truth for the echo images is more ambiguous. To simulate the inter-user variability with only one ground truth marker, we have randomly sampled 40 frames from all datasets: for each frame the ground truth was marked five times by the same observer on different days. For each con-secutive pair of ground truth markings, the average error and the percentage of overlap were calculated between the two ground truths. The overall error and the overlap percentage are 0.7 mm and 87.3%. Table I summarizes the details of the datasets. Ex-periments were performed on an Ubuntu Linux PC system using a 3.40 GHz CPU and 8 GB RAM.
The following performance metrics were defined to evaluate each algorithm's speed, accuracy, and robustness.
• Average frame rate. This evaluates the speed of the
tracking, which directly determines performance for real-time applications.
• Average tracking error. For each landmark , the shortest
TABLE I DATASETINFORMATION
There are three X-ray images corresponding to each frame. They are taken at different angles and the angle between positions is .
Each pair is a combination of one X-ray image and one echo image which are taken almost simultaneously. Due to the differing frame rates, there are two or three X-ray frames corresponding to each echo frame and thus the number of pairs is more than twice the number of echo frames.
The porcine data is only used for the X-ray experiments due to having only a small amount of porcine echo data available.
with . The average of among correctly tracked landmarks is defined as the tracking error.
• Incorrect tracking percentage (ITP). ITP is defined as
the number of incorrectly tracked landmarks over the total number of landmarks. ITP indicates the reliability of the tracking results.
• Failed tracking percentage (FTP). For each landmark
on the ground truth, the minimum distance to the tracked curve is calculated. The landmark is considered as success-fully tracked if the distance is below . FTP is defined as the number of ground truth landmarks that are not suc-cessfully tracked over the total number of landmarks in the ground truth. It evaluates to what extent the whole catheter can be tracked.
• Ratio of failed tracked frames (ROF). If the FTP or ITP
is 100%, we regard this as a failure. The number of frames where a tracking failure is detected over the total number of frames indicates how often re-initialisation of the tracking is needed. It also indicates the stability and robustness of the system.
A. Catheter Extraction and Tracking in X-Ray Sequences This section evaluates the catheter extraction and tracking in X-ray sequences. This was evaluated on all available X-ray im-ages including the high-dose porcine imim-ages and low-dose pa-tient images. The catheters in these sequences were moving not only along the normal direction but also along the tangential direction. In this sense, the length of the tracked catheter is al-ways changing. The following experiments compare our pro-posed tracking strategy with the method using only Fast-PD, which has been suggested in [7]. The purpose here is to eval-uate Kalman filter-based growing in both first-frame extraction and tracking applications.
Parameters were selected based on either prior information or experiments on a range of candidate values. Some of them, such as the scale of the SURF features, are dependent on the data and were selected based on prior knowledge for each dataset such as the size of the catheter. The scales of both the Frangi and SURF detectors are set to 4 and 6. These are the recommended values for the standard deviation of the Gaussian smoothing in the Hessian matrix calculation for both detectors. Thus, a few scales rather than a full range of scales can be used here in order to accelerate the algorithm. Other parameters were se-lected based on experiments, such as the threshold of the SURF response , the threshold of the tubular score , the threshold of the edge points in patch anal-ysis , the size of the patch for patch analysis (10 pixels), the thresholds for ending the multiple line analysis
iterations ( and ), and the maximum
and minimum growth step size ( , ) for Kalman filter-based growing. Based on the performance in accuracy as
measure by ITP and FTP a value of , which is
the balance coefficient of the Fast-PD tracking function, gives robust performance. We set . Another critical param-eter is the search range of the Fast-PD tracking framework. Ide-ally, by allocating a sufficiently large search region, the tracking can capture any large movements including abrupt catheter po-sition changes. However, a larger search region means a higher risk of two or more catheters appearing in this region simultane-ously. This would cause confusion for the tracking system and would increase the required manual interaction. Another draw-back is that the computational cost would rise dramatically if the search region were enlarged. Thus, for the above consider-ation, we set the search range to be along a line normal to the catheter, with a range of 10 pixels. This 1-D range means that the search region has no margin in the tangential direction. This strategy makes the tracking fast but unable to track tangential movements. However, tracking this tangential motion is not our aim during the Fast-PD step since the tangential movements can be tackled by Kalman filter-based growing. All parameter set-tings are applied to both porcine and patient data.
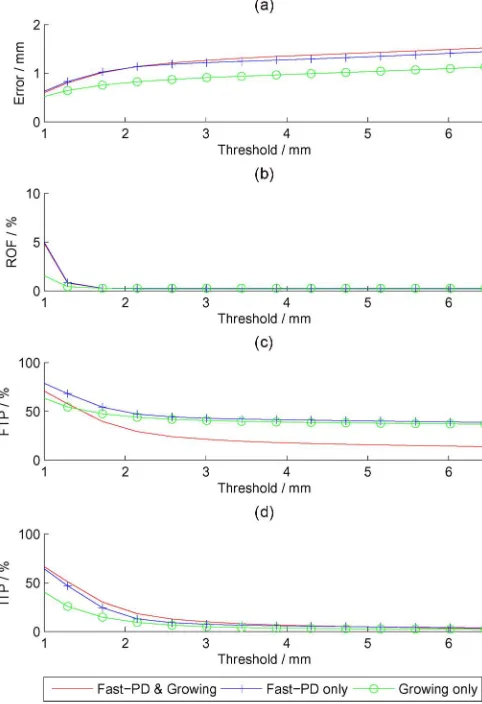
Fig. 7 shows the comparison results for different (0.4–6.5) based on the porcine data and the clinical data. Three main strategies are compared in this experiment: 1) the combination of Fast-PD and Kalman filter-based growing; 2) Fast-PD only; and 3) Kalman filter-based growing only (which is the same strategy as the first-frame initialization applied to every frame). The speeds of these approaches are on average 31, 31, and 1667 fps, respectively. From these figures, it is clear that the combined strategy achieves a significantly lower FTP with a trade-off of higher ITP. The growing-only strategy achieves the fastest speed (0.0006 s per frame while the other two take 0.032 s) and the lowest error. The results are shown in Table II for . Figs. 8 and 9 show some example frames comparing results of the three methods for porcine and patient X-ray data respectively. The figures also show that the proposed methods can gradually extract the whole catheter even when the initialization is incomplete.
Fig. 7. Comparison experimental results on X-ray sequences. All subfigures have the threshold as the x-axis label because all performance metrics depend on this value. Thus, figures (a)–(d) show the performance error, ROF, FTP, and ITP, respectively, on a range of values of –6.5. The methods evaluated include our proposed method combining Fast-PD and Kalman filter (red line without dots), Fast-PD only (blue line with “ ” dots) and growing only (green line with “o” dots).
TABLE II
COMPARISONRESULTS ONX-RAYSEQUENCES
The growing-only extraction strategy gives a detailed initial-ization with a fast speed and low error, but no consistency is preserved because every adjacent frame is processed indepen-dently. Thus, it is less stable (higher ROF). An FTP below 40% can only be achieved by combining Fast-PD and the Kalman filter-based growing strategies.
B. Catheter Extraction in Ultrasound Sequences
First, the proposed method is compared to the strategy without the postprocessing growing to demonstrate the ad-vantage of catheter growing in cases with large tangential movements in echo images. The advantages of the proposed similarity measurement are also demonstrated by comparison
with other vesselness filtering methods, specifically Frangi's and Sato's methods proposed in [24]and [25], respectively. Finally, the overall algorithm is compared with our previous method [22], [23]. This highlights the limitations of the pre-vious method when using real clinical data.
When using the 2-D SURF detector, only three scales ( , 6, and 8) are used to calculate the responses in order to speed up the computation. A threshold is used to select featured locations. The search range along the normal direction for each voxel on the curved surface depends on how accurate the transformation between the X-ray and echo images is. Usually, it is set to 10 pixels which means the catheter is on or very near the curved surface. For poor quality registrations or synchronizations, the value can be set to 30. At the stage of graph construction, the threshold for the minimum distances for the sub-graph construction or clustering is set to . The threshold to decide whether to merge any two clusters is set
to and . For the growing stage, the
maximum and minimum growing steps are set to and respectively.
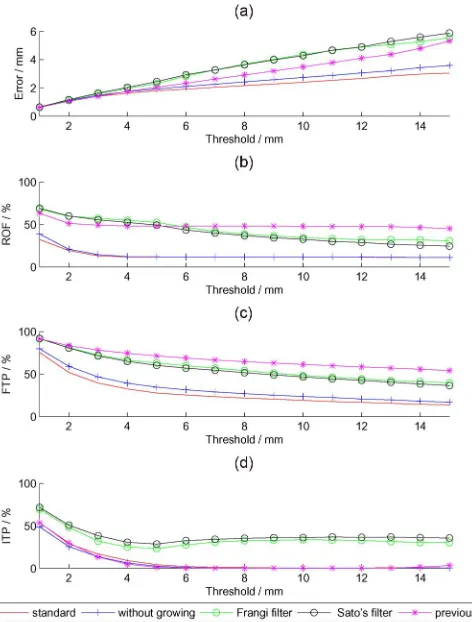
Fig. 10 shows the results for the error, FTP, ITP and ROF. The average time per frame is 1.35, 0.74, 4.30, 4.35, and 0.50 sec-onds for the proposed method with and without growing, Frangi filtering, Sato's vesselness filtering, and the method in [23], re-spectively. The vesselness filtering methods have the largest er-rors and highest ITP, and are only better than the strategy in [23]in terms of ROF and FTP. The method in [23]is based on a simple single layer graph and is much worse than the posed strategy in all performance metrics except ITP. The pro-posed method with or without the growing strategy is the best in almost any performance metric and for any threshold value . Use of the growing strategy achieves lower error, ROF and FTP. The trade-off is a slightly longer processing time and a very small rise in ITP. Fig. 11 shows example results for the dif-ferent methods. Given , our standard method achieves a speed of 1.35 s per frame and an error of 1.79 mm, with FTP of 27.7%, ITP of 4.19% and a failure ratio of 11.6%. Although the performance is worse than that in X-ray images, this is reason-able given that X-ray imaging has more clearly defined borders of the catheter compared to the echo images.
Although the growing strategy can be extended to the tracking of more of the catheter and extract the part of the catheter which does not overlap with the X-ray image, the trade-off is a larger computational cost and a higher incorrect tracking percentage. In clinical scenarios, whether or not the growing function should be used depends on whether the whole catheter is preserved in the straightened space. If not, this is likely due to some parts of the catheter not being in the field-of-view of the X-ray images or an inaccurate registration between these two modalities. Thus, a growing strategy is recommended if some parts of the catheter are missing in the straightened space.
Fig. 8. Examples of the tracking result on porcine X-ray data. Rows (a), (b), (c), and (d) correspond to the original data, the results of growing extraction only, Fast-PD only and the proposed strategy combining Fast-PD and Kalman filter-based growing. Tracked curves are marked in green. For each row, the six columns correspond to frame nos. 1, 21, 41, 61, 81, and 101.
catheter (along the -axis) that is already known to us. Thus, the or cross-sectional planes should exhibit a blob-like structure where the catheter passes through. The size of the catheter is available as prior information and thus the scale of the SURF operation can be optimized for this. Compared with other vesselness filtering methods, this strategy only extracts tubular structures along the -axis. Any outliers, which may occur during the vesselness filtering, are eliminated at this stage.
IV. DISCUSSION
Although this work is evaluated on a very limited range of catheter types (lasso catheters, ablation catheters, and coronary sinus catheters) mainly used for catheter-based atrial fibrillation ablation, it is possible to extend the approach to other types of catheters for more general catheter-based cardiac interventions. One potential problem is that some types of catheters lack elec-trodes which provide salient blob-like features in X-ray images. In this case, lowering the threshold of the SURF detector re-sponse could allow tubular-like structures to also be detected as blob-like structures, because the SURF response for tubular
structures is weaker than on blobs, but stronger than on other structures. However, this could cause a large number of candi-date “blobs” (including nonblob tubular structures) and cause the whole algorithm to be rather slow. We have successfully dealt with a catheter without electrodes in the patients X-ray sequence in Fig. 9. As the main function of blob detection is to identify a start point for catheter growing, another possi-bility if it is known that no blob-like features can be detected on some types of catheters, such as pigtail catheters, is for the user to introduce a start point manually. However, this strategy downgrades the proposed system from a fully-automatic to a semi-automatic system. Another potential limitation of the ap-plication to other types is the higher curvature. Currently our algorithm is tested on lower curvature cases. For some high cur-vature catheters such as the tip of the pigtail and lasso catheters, it is expected that the algorithm will work if more control points are used, although the performance could still be reduced since higher curvature will cause higher error during the search space straightening step.
Fig. 9. Examples of the tracking result on patient X-ray data. Rows (a), (b), (c), and (d) correspond to the original data, the results of growing extraction only, Fast-PD only and the proposed strategy combining Fast-PD and Kalman filter-based growing. The tracked curves are marked in green. For each row, the six columns correspond to frame nos. 1, 21, 41, 61, 81, and 101.
are expected to: 1) specify the catheter being tracked at the (re)-initialization stage; 2) initialize the registration between the probe model to its projection in X-ray once at the beginning; and 3) identify tracking failures. For 1), the catheters being tracked are specified by clicking a point on or near the curves and the growing strategy does the rest. This could be replaced by a fully-automatic procedure in which prior information, such as the number of electrodes and the length and direction of the catheter, is used to automatically detect the correct catheter. For 2) the initialization of the registration is required only once at the start. Registration in the following frames can then be initialized by previous registrations. Finally, within every frame loop, the user is expected to monitor the tracking results, detecting tracking failures and re-initializing. This could also be replaced by an automatic procedure, e.g., a failure could be indicated if the average SURF or Frangi response is below a threshold.
For X-ray extraction and tracking, the extraction algorithm (mainly based on Kalman filter growing) can extract a catheter without any prior information from earlier X-ray images and can do so quickly. It therefore satisfies the real-time require-ment without any hardware acceleration such as use of a GPU.
Fig. 10. Comparison experimental results on ultrasound sequences. All subfig-ures have the threshold as the x-axis label because all performance metrics de-pend on this definition. Thus, figures (a)–(d) show the performance error, ROF, FTP, and ITP, respectively, on a range of values of –15. The methods eval-uated include our proposed algorithm with growing strategy (red line without dots) and without growing (blue line with “ ” dots), the method based on simi-larity measurement Frangi vesselness filtering (green line with “o” dots), Sato's vesselness filtering (black line with “o” dots), and a previous method proposed in [23](purple line with “ ” dots).
or if an incorrectly tracked structure will cause more serious problems than a partially untracked catheter, then the growing is unnecessary and best avoided. However, in our application, the growing approach is preferred. The extraction (initializa-tion) for the first X-ray frame also uses the growing strategy. We set the threshold to stop growing to a high value. This initially leads to under-growing in the first frame, as can be seen in Fig. 8(d) and Fig. 9(d). However, during the tracking stage, the correct length is extracted in later frames. This con-servative approach prevents instability from potentially large amounts of overgrowing.
Given the experimental results of different methods for extraction in echo images, we find the 2-D SURF blob detector performs better than the vesselness filtering methods in this ap-plication. The advantage of the blob detector in this application is that the direction of the catheter can be well estimated based on the result of X-ray tracking and the registration between X-ray and echo images. If the catheter direction is known, it is easy to locate a series of planes through which the catheter should show a blob-like image on the intersection of the plane and the catheter. The 2-D SURF detector is then best suited for the blob detection in 2-D planes. The vesselness filtering
techniques are more general and certainly can be more widely used. These estimate the direction of the tubular structure by analyzing the eigenvalues of the Hessian matrix of second derivatives. However, if the quality of the imaging modality is poor, the Hessian matrix calculated from the image is not reliable. Thus, the analysis on the eigenvalues does not produce an accurate estimate of the direction and a correct filtering of the catheter structures. The vesselness filtering also ignores the prior information from the X-ray segmentation. For these reasons, it is a less effective method and this is supported by our experimental results. However, if there were a failure in the X-ray segmentation or the X-ray to echo registration, so that the prior information of the catheter direction would not be available to the echo volume, vesselness filtering would be the only viable option.
The previous graph model strategy shows a good perfor-mance on phantom data [23], but fails in most of the frames in clinical data. The reason is that in the clinical sequences, the catheter does not always follow the shortest path model in the constructed graph if the start and end nodes cannot be fixed. Usually, the objective of the model is to maximize the likelihood of a path to represent the catheter. This maximiza-tion problem can be transformed to a longest path problem rather than a shortest path problem. Suppose that a catheter image comprises a set of broken fragments rather than a com-plete continuous catheter. The shortest path then corresponds to only one catheter fragment, whereas the longest path is able to preserve the whole catheter. In the clinical sequences, the poor quality of ultrasound imaging means that this occurs fre-quently. On the other hand, to model each catheter fragment, from which we know the starting and ending nodes, it is more appropriate to use a shortest path model. This is because for each fragment, the purpose is not to maximize the likelihood of it being a catheter, but to obtain a smooth representation of the catheter fragment. With known start and end points, this problem can be easily solved by finding the shortest path. In order to combine the two models together, a two layer hier-archical graph model, with the top layer determining how to organize the catheter fragments, and a bottom layer to achieve a better representation of each fragment, is proposed for this application.
The complete system can run fast but not in real-time (the re-quirement is at least 10 fps for echo) on the platform on which we have carried out the experiments. However, since the com-putation on each pixel or voxel is independent, the system could easily be parallelized with GPU techniques. The whole compu-tation time per frame can be written as
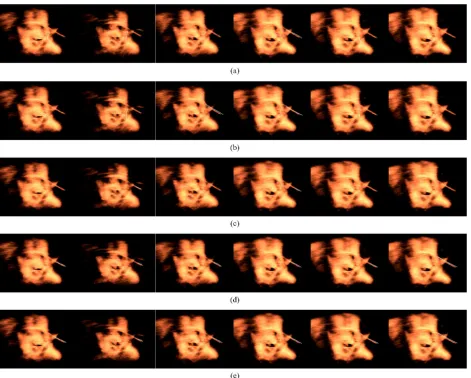
Fig. 11. Examples of the tracking result on patient echo data. Rows (a), (b), (c), (d), and (e) correspond to the results using a vesselness filter [24]and [25], a previous graph-based extraction method [23], and the proposed method without and with the growing postprocessing. Tracked curves are marked in green. For each row, the six columns correspond to frame nos. 1, 21, 41, 61, 81, and 101.
Fig. 12. A side effect of the growing strategy: a small rise in ITP. One echo frame is used to illustrate this effect with the ground truth marked in green (with a green arrow pointing the end). Left and the right sub-figure show the results without and with the growing strategy in light blue (with a light blue arrow pointing the end), respectively. It is clear that the strategy without growing cannot detect the entire length while the one with growing can, but with a small error in tracked length.
0.03 s, with nearly all of this time taken for the step of can-didate measurements in the search region. During this step, the nearly in the search region can be examined indepen-dently and could be processed simultaneously. Thus could potentially be reduced significantly on a GPU platform. Mean-while, the improvement potential for echo image extraction is even larger, given that the echo volume is 3-D. During the stage of echo extraction, the preprocessing and feature searching, on
both the original volume and the straightened volume, which takes 0.7 s in total, can be fully parallelized by examining each voxel independently and simultaneously on a GPU. The rest of the computation, such as growing, cannot be fully paral-lelized directly and costs around 0.7 s. However, the main cost is calculation of measurements on each voxel independently and these computations could be calculated in advance and stored
in memory. The average total echo time on a
CPU and the minimal real-time requirement is 10 fps. Given the easily parallelizable nature of the proposed algorithm, the required speed-up of 10 times may well be achievable with a GPU or multi-GPU implementation.
[image:15.592.40.286.495.574.2]V. CONCLUSION
We have proposed a fast X-ray assisted catheter segmentation strategy for ultrasound imaging in cardiac catheterization. The experimental results show that it can track catheter motions in ultrasound at 1.3 s per frame, with an error of less than 2 mm. Fewer than 4.5% of the tracked results are incorrect and more than 72% of the ground truth is tracked. Fewer than 12% of frames have a tracking failure. Compared with [23], our method is better in any performance metric.
The growing strategy for both X-ray and echo tracking trades off a small rise in the percentage of incorrectly tracked features (increased ITP), but is able to track a larger proportion of the catheter (reduced FTP). This strategy makes the system more adaptive to the cases where the catheter moves tangentially and causes a change in the visible length of the catheter. The 2-D SURF detector in the straightened space gives better measure-ments than the widely used vesselness filtering methods. The two-layer hierarchical graph model is more suitable in this ap-plication than the single layer model that finds only the shortest path. Future work will include the GPU parallelization of this system and will look at catheter tip tracking in real-time.
REFERENCES
[1] R. K. Thakur, G. J. Klein, and R. Yee, “Radiofrequency catheter abla-tion in patients with Wolff-Parkinson-White syndrome,”CMAJ: Can. Med. Assoc. J., vol. 151, no. 6, pp. 771–776, 1994.
[2] R. J. Housden, A. Arujuna, Y. Ma, N. Nijhof, G. Gijsbers, R. Bullens, M. ONeill, M. Cooklin, C. A. Rinaldi, and J. Gillet al., “Evaluation of a real-time hybrid three-dimensional echo and X-ray imaging system for guidance of cardiac catheterisation procedures,” inMedical Image Computing and Computer-Assisted Intervention–MICCAI 2012, 2012, pp. 25–32.
[3] A. Brost and R. Liaoet al., “3-D respiratory motion compensation during EP procedures by image-based 3-D lasso catheter model gener-ation and tracking,” inMICCAI, 2009, pp. 394–401.
[4] Y. Ma and A. Kinget al., “Real-time respiratory motion correction for cardiac electrophysiology procedures using image-based coronary sinus catheter tracking,” inMICCAI, 2010, pp. 391–399.
[5] W. Wu and T. Chenet al., “Learning-based hypothesis fusion for ro-bust catheter tracking in 2-D X-ray fluoroscopy,” inCVPR, 2011, pp. 1097–1104.
[6] F. Milletari, N. Navab, and P. Fallavollita, “Automatic detection of multiple and overlapping EP catheters in fluoroscopic sequences,” inMICCAI 2013. Berlin, Germany: Springer, 2013, vol. 8151, pp. 371–379.
[7] T. Heibel and B. Glockeret al., “Discrete tracking of parametrized curves,” inCVPR, Jun. 2009, pp. 1754–1761.
[8] P. Wang and T. Chen et al., “Robust guidewire tracking in fluo-roscopy,” inCVPR, 2009, pp. 691–698.
[9] O. Pauly, H. Heibel, and N. Navab, “A machine learning approach for deformable guide-wire tracking in fluoroscopic sequences,” in
MICCAI, 2010, pp. 343–350.
[10] N. Honnorat, R. Vaillant, and N. Paragios, “Graph-based geometric-iconic guide-wire tracking,” inMICCAI, 2011, vol. 6891, pp. 9–16.
[11] H. Heibel, B. Glocker, M. Groher, M. Pfister, and N. Navab, “Inter-ventional tool tracking using discrete optimization,”IEEE Trans. Med. Imag., vol. 32, no. 3, pp. 544–555, Mar. 2013.
[12] J. Mung, F. Vignon, and A. Jain, “A non-disruptive technology for robust 3-D tool tracking for ultrasound-guided interventions,” in
MICCAI, 2011, pp. 153–160.
[13] B. Dong, E. Savitsky, and S. Osher, “A novel method for enhanced needle localization using ultrasound-guidance,” inAdv. Vis. Comput., 2009, pp. 914–923.
[14] M. Uhercik, J. Kybic, H. Liebgott, and C. Cachard, “Model fitting using RANSAC for surgical tool localization in 3-D ultrasound im-ages,”IEEE Trans. Biomed. Eng., vol. 57, no. 8, pp. 1907–1916, Aug. 2010.
[15] F. Gaufillet, H. Liegbott, M. Uhercik, F. Cervenansky, J. Kybic, and C. Cachard, “3-D ultrasound real-time monitoring of surgical tools,” inUltrason. Symp., 2010, pp. 2360–2363.
[16] Y. Zhao, H. Liebgott, and C. Cachard, “Tracking micro tool in a dy-namic 3-D ultrasound situation using Kalman filter and RANSAC al-gorithm,” inISBI, 2012, pp. 1076–1079.
[17] K. Cao, D. Mills, and K. Patwardhan, “Automated catheter detection in volumetric ultrasound,” inProc. IEEE 10th Int. Symp. Biomed. Imag., 2013, pp. 37–40.
[18] G. Gao and G. Penneyet al., “Rapid image registration of three-di-mensional transesophageal echocardiography and X-ray fluoroscopy for the guidance of cardiac interventions,” inIPCAI, 2010, vol. 6135, pp. 124–134.
[19] P. Mountney, R. Ionasec, M. Kaizer, S. Mamaghani, W. Wu, T. Chen, M. John, J. Boese, and D. Comaniciu, “Ultrasound and fluoroscopic images fusion by autonomous ultrasound probe detection,” in Med-ical Image Computing and Computer-Assisted Intervention–MICCAI 2012. New York: Springer, 2012, pp. 544–551.
[20] G. Gao, G. Penney, Y. Ma, N. Gogin, P. Cathier, A. Arujuna, G. Morton, D. Caulfield, J. Gill, and C. Aldo Rinaldiet al., “Registration of 3-D trans-esophageal echocardiography to X-ray fluoroscopy using image-based probe tracking,”Med. Image Anal., vol. 16, no. 1, pp. 38–49, 2012.
[21] T. Heimann, P. Mountney, M. John, and R. Ionasec, “Learning without labeling: Domain adaptation for ultrasound transducer localization,” in
MICCAI 2013. Berlin, Germany: Springer, 2013, 8151, pp. 49–56. [22] X. Wu and J. Housdenet al., “Real-time catheter extraction from 2-D
X-ray fluoroscopic and 3-D echocardiographic images for cardiac in-terventions,” inSTACOM, 2012.
[23] X. Wu and J. Housdenet al., “Catheter tracking in 3-D echocardio-graphic sequences based on tracking in 2-D X-ray sequences for car-diac catheterization interventions,” inISBI, 2013, pp. 25–28. [24] A. Frangi and W. Niessenet al., “Multiscale vessel enhancement
fil-tering,” inMICCAI, 1998, pp. 130–137.
[25] Y. Sato and S. Nakajimaet al., “3-D multi-scale line filter for segmen-tation and visualization of curvilinear structures in medical images,” in
CVRMed-MRCAS'97, 1997, pp. 213–222.
[26] H. Bay and A. Ess et al., “Speeded-up robust features (SURF),”
Comput. Vis. Image Understand., vol. 110, no. 3, pp. 346–359, 2008. [27] K. Engel, M. Hadwiger, J. M. Kniss, C. Rezk-Salama, and D. Weiskopf,
Real-Time Volume Graphics. Natick, MA: AK Peters, 2006. [28] M. A. Fischler and R. C. Bolles, “Random sample consensus: A
par-adigm for model fitting with applications to image analysis and auto-mated cartography,”Commun. ACM, vol. 24, no. 6, pp. 381–395, 1981. [29] N. Komodakis, G. Tziritas, and N. Paragios, “Fast, approximately op-timal solutions for single and dynamic MRFs,” inCVPR, 2007, pp. 1–8. [30] R. Sibson, “SLINK: An optimally efficient algorithm for the single-link
cluster method,”Comput. J., vol. 16, no. 1, pp. 30–34, 1973. [31] R. Sedgewick and K. Wayne, Algorithms, 4th ed. Reading, MA: