Investigation of ceramic MFC stacks for urine energy extraction
Asimina Tremouli
a,b, John Greenman
a, Ioannis Ieropoulos
a,⁎
aBristol BioEnergy Centre, BRL, University of the West of England, T-Block, Frenchay Campus, Bristol BS16 1QY, UK b
School of Chemical Engineering, National Technical University of Athens, Heroon Polytechniou 9, 15780 Zografou, Athens, Greece
a b s t r a c t
a r t i c l e i n f o
Article history:
Received 12 December 2017
Received in revised form 19 March 2018 Accepted 19 March 2018
Available online 21 March 2018
Two ceramic stacks, terracotta (t-stack) and mullite (m-stack), were developed to produce energy when fed with neat undiluted urine. Each stack consisted of twelve identical microbial fuel cells (MFCs) which were arranged in cascades and tested under different electrical configurations. Despite voltage reversal, the m-stack produced a maximum power of 800μW whereas the t-stack produced a maximum of 520μW after 62.6 h of operation. More-over, during the operation, both systems were subject to blockage possibly due to struvite. To the Authors' best knowledge, this is thefirst time that such a phenomenon in ceramic MFC membranes is shown to be the direct result of sub-optimal performance, which confirms the hypothesis that ceramic membranes can continue oper-ating long-term, if the MFCs produce maximum power (high rate of e−transfer). Furthermore, it is shown that once the ceramic membrane is blocked, it may prove difficult to recoverin-situ.
© 2018 The Authors. Published by Elsevier B.V. This is an open access article under the CC BY license (http:// creativecommons.org/licenses/by/4.0/). Keywords:
MFC Stack Voltage reversal Ceramic Urine
1. Introduction
Microbial fuel cells (MFCs) are systems that convert biomass directly into electricity through the metabolic activity of microorganisms [1,2]. In recent years, the interest for this technology has rapidly increased, since MFCs offer the advantage of simultaneous treatment of wastewa-ter and energy generation in the form of electricity [3,4]. Several MFC designs have been reported with optimised parameters for power pro-duction and wastewater treatment, when fed with different types of feedstock [2,5,6].
In order to better exploit the advantages offered by MFCs, system configurations must be operationally and economically sustainable. Al-though several bioreactor designs have been investigated, under differ-ent operating conditions and both expensive and cheap materials have been tested with various substrates, the MFC technology has still not been commercialised [2,5]. The main obstacles that this technology has to overcome are the low energy generated when compared to more conventional mature technologies such as chemical fuel cells, bat-teries, photovoltaics (although the per-unit power output can be com-parable to single PV cells that collectively make up a PV panel) as well as the high cost of some of the materials used [7,8].
Stacking MFCs could enhance power production and wastewater treatment efficiency. However, there may be challenges when connecting multiple units together as this can be done in a number of different ways (series, parallel and series/parallel combined). Multiple MFC connection could result in losses via the conductive fluidic
connections of interconnected units and it can affect the performance depending on whether or not feeding is in series from a common tank or individually fed from the source [9–13]. Moreover, the material selec-tion for the optimisaselec-tion of the MFC performance is of utmost impor-tance. In order for MFCs to be widely deployed, research towards the effective use of inexpensive and sustainable materials must be carried out. Recently, researchers have started using ceramics with encouraging results, suggesting that these inexpensive materials may be the solution towards MFC implementation. There have even been reports of MFCs made from paper and other biodegradable materials, which in a way opens up new opportunities for low-cost,fixed-term MFC deployment [14,15]. Studies have demonstrated that ceramics can provide stability, improve power and treatment efficiency, create a better environment for the electro-active bacteria to achieve resource recovery and even kill pathogens [6,16–18].
Urine is an abundant waste product and it has already been reported as an excellent fuel for generating electricity in MFCs [19]. The daily pro-duction of human urine is estimated to be in the range of 17.4 billion L, based on a world population of 6.97 billion and considering that an adult produces an average of 2.5 L in a day [19,20].
The main objective of this study was therefore to investigate the per-formance of MFCs when operated under adverse conditions in order to evaluate the limits of the ceramic separators. Two ceramic stacks were constructed and operated under sub-optimal feed/flow conditions, whilst efforts to optimise power production were attempted. MFCs within the stack were fed from a common tank with a dripping mecha-nism. Neat, urine was used as a feedstock whilst ceramic (terracotta and mullite) was used as (i) the structural material and (ii) the separator for ion exchange. To the Authors' best knowledge, this is thefirst time that
⁎ Corresponding author.
E-mail address:ioannis.ieropoulos@brl.ac.uk(I. Ieropoulos).
https://doi.org/10.1016/j.bioelechem.2018.03.010
1567-5394/© 2018 The Authors. Published by Elsevier B.V. This is an open access article under the CC BY license (http://creativecommons.org/licenses/by/4.0/).
Contents lists available atScienceDirect
Bioelectrochemistry
membrane blockage is shown to be the direct result of MFC under-performance. It is also shown that once the ceramic membrane is blocked it may be difficult to recover in-situ.
2. Materials and methods
2.1. MFC design
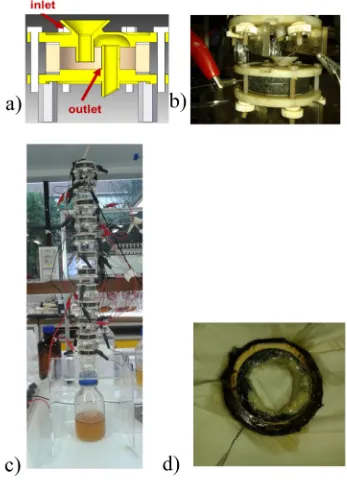
Each MFC unit consisted of a single cylindrical ceramic chamber, whose internal volume was used as the anode chamber, and the exter-nal surface was used as the open-to-air cathode. Two circular 3D printed lids made from acrylo-nitrile butadiene styrene (ABS) material sealed the top and the bottom of the chamber. The inlet was at the top, with the feedstockflowing towards the bottom of the anodic chamber, for betterfluid percolation. The effluent went out from the top of the anodic chamber, with the use of a constant-level outlet tube. A schematic cross section and a photo of the unit are shown inFig. 1a and b.
Untreated carbonfibre veil material (PRF Composites, Dorset, UK) with a density of 20 g/cm2and a total surface area of 64.8 cm2was folded and used as the anode electrode. The cathode electrode (13.75 cm2) was prepared by coating activated carbon (AC) (G Baldwin & Co) paste on polytetrafluoroethylene (PTFE) (60 wt% Sigma-Aldrich) treated carbon cloth and was tightly wrapped around the outside wall of the ceramic, with the AC side facing the ceramic material. The paste was prepared by mixing AC powder, PTFE solution and distilled water (80 g/140 mL), as previously described [21]. Stainless steel wire (0.5 mm, Scientific Wire Company) was threaded through the elec-trodes, which were connected with stainless steel crocodile clips acting as current collectors.
2.2. MFC stacking
[image:2.595.118.465.249.729.2]Two stacks were fabricated and each one consisted of twelve identi-cal MFCs as previously described (Fig. 1). The units in the stack were
arranged in cascades such that the effluent from the upstream MFC
flowed as the influent into the downstream MFC. MFCs within the cas-cades were connected electrically together and a dripping mechanism (to introduce an air-gap) was used forfluidic isolation and thus electri-cal insulation between MFCs. Mullite (Anderman Ceramics Ltd, Hartlebury Trading Estate, Hartlebury, UK) was used for thefirst stack (m-stack) and terracotta (Weston Mill Pottery, Sutton on Trend, UK) for the second stack (t-stack). The height of the terracotta cylinders was 11 mm with 3 mm wall thickness, whilst mullite cylinders had 11.5 mm height and 5 mm wall thickness. All cylinders had an external diameter of 40 mm and an open porosity of approximately 27%.
2.3. MFC enrichment and operation
The two stacks were operated under identical conditions in order to compare the performance of the two ceramic materials. The enrichment and adaptation of the electrochemically active bacteria in the MFCs were performed in batch mode, under afixed external load of 2 kΩfor each cell. During inoculation, 50% of activated sewage sludge supplied from the Wessex Water Scientific Laboratory (Saltford, UK) and 50% of fresh urine was used as the feedstock. Urine was collected from healthy individuals aged between 18 and 70 years old, with no known medical conditions. Following the enrichment of cells, the operation was shifted to continuous mode, using only fresh urine as the feed. Thefirst unit placed at the top of each stack was being fed directly from the inlet res-ervoir using a peristaltic pump (205 U, Watson Marlow, Falmouth, UK). The 2 kΩexternal resistive loads were removed and a 1 kΩload was connected to each stack. Due to practical limitations such as urine avail-ability, the MFCs were operated at a sub-optimally slowflow rate 7.51 ml/h (HRT 0.8 h). The anodic liquid volume was 4 ml during batch operation. This volume gradually decreased to approximately 1 ml, as a result of struvite precipitation, probably due to the slow
flow rate.
In an attempt to improve performance and recover power to at least the levels produced at the start of the experiment, a series of tests and parameter changes were performed such as: hydration of the cathode electrodes with deionized water, changing the electrical configuration, changing theflow rate, as well as replacing all the cathode electrodes with new identical ones. Moreover, the cells were disassembled and the struvite, which had accumulated on the anode electrodes, was re-moved. Thefinal step was to examine if the ceramic material was blocked and for this the anode and cathode electrodes were replaced with new identical ones, but keeping the same ceramic chassis. All ex-periments were performed at room temperature (22 ± 2 °C).
2.4. Data collection
Electrode output for each MFC was individually recorded in volts (V) versus time using an Agilent data logger (KEYSIGHT, 34972A LXI data acquisition/Switch) unit. The current and power produced from the MFCs were calculated using Ohm's lawI=V/R, whereVis the mea-sured voltage in volts (V) andRis the known value of the external load resistor in ohms (Ω). Power (P) in watts (W) was calculated by multi-plying voltage with current;P=I×V. Power densities were calculated by dividing output with the anodic liquid volume (4 ml for individual MFCs).
2.5. Polarisation experiments
The polarisation experiments were performed using a decade vari-able resistor box (Centrad Boite A Decades De Resistances DR07). Data were produced by sweeping resistor values from 1 MΩto 0Ω. The time interval between resistance changes was 3 min and two different electrical configurations were assessed. During thefirst electrical con-nection, the top four (1–4), the middle four (5–8) and the bottom four MFCs (9–12), where connected in parallel, and the three parallel groups
were connected in series (3s4p). During the second electrical confi gura-tion MFCs 1, 2, 11, 12; 3, 4, 9, 10 and 5, 6, 7, 8, were connected in parallel, and the three respective parallel groups were then connected in series. MFCs were named based on their position in the cascade i.e. from MFC1 (the first to receive feedstock) up to MFC12 (the last to receive feedstock).
3. Results and discussion
3.1. MFCs start-up
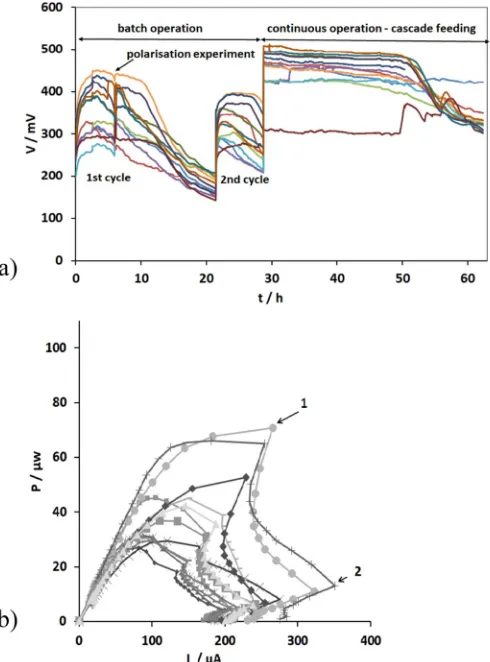
[image:3.595.314.559.357.688.2]In order to inoculate the anodic electrodes with electroactive bacte-ria, the MFC units were initially operated in batch mode. The beginning of each cycle was marked by the feedstock replacement with 50% of fresh activated sewage sludge and 50% of fresh urine whilst the end of a cycle was marked by the MFC voltage dropping to approximately zero. Following, a relatively reproducible cell performance for the last cycles, the twelve identical MFCs were arranged in cascades and fed in continuous mode (7.51 ml/h). During the batch and continuous mode operations, each MFC unit operated under afixed external load of 2 kΩ. Fig. 2a shows the changes in the monitored cell voltage during the start-up stage for the last two reproducible batch cycles and the cascade feeding of the m-stack. It can be clearly seen that the peak voltages for thefirst cycles were in the range of 270–450 mV (0.14–0.23 mA) whilst the second cycles were in the range of 260–390 mV (0.13–0.20 mA). Al-though the peak voltage levels were not fully stabilised between the two cycles, since there is variance with fresh urine, the acclimation
period was considered completed as no further increase in peak output levels was recorded.
As can been seen inFig. 2a, when the cells were arranged in cascades and fed in continuous mode (t = 28.7 h), the voltage levels depicted a sharp increase of 17–27.7%. The enhanced performance remained stable for approximately 22 h whilst the voltage for all MFC units, except m1, subsequently decreased. This result is attributed to the insufficient car-bon energy source for cells m2–m12, due to the lowflow rate 7.51 ml/h of urine [22].
The data presented inFig. 2b show the power curves of the cells for thefirst cycle (t = 5.9 h,Fig. 2a). As can been seen fromFig. 2b (points 1 and 2), a double overshoot effect was observed for all units. This result indicated possible biofilm immaturity on the anode electrodes or sub-optimal ionic conditions in the anodic environment [23]. Overshoot oc-curs when power and current decrease simultaneously [24]. A similar behaviour was observed during the start–up phase of the t-stack (data not shown).
3.2. Voltage/power behaviour of the stacks under different electrical configurations
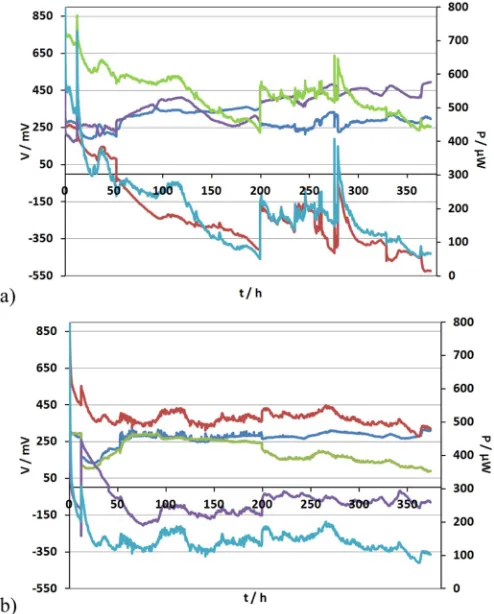
The m-stack operated for ~63 h under thefirst electrical connection whilst the t-stack for almost ~91.1 h.Fig. 3shows the changes in the monitored voltage V of the quadruples and the stacks and the power output of the m-stack and t-stack, respectively. The voltage of the bot-tom four MFCs (m9–12; t9–12) in both stacks reversed in polarity and the effect was almost immediate. This result is attributed to substrate imbalance along the MFC cascade. This imbalance caused a dispropor-tional variation in internal resistance among units, which further caused the reversal in polarity [9]. Despite these adverse conditions, the
m-stack produced a maximum power of 800μW whilst the t-stack pro-duced a maximum power of 520μW after 62.6 h of operation (Fig. 4).
Without exception, all MFCs showed a power overshoot behaviour, which is a sign of biofilm immaturity or suboptimal system perfor-mance; given the length of time this experiment has been running for, it was evident that there were intrinsic factors negatively affecting the performance.
In order to overcome this barrier, the electrical configuration was changed to compensate for the sequential treatment in the cascade that would inevitably starve the bottom MFCs. Specifically, MFCs 1, 2, 11, 12; 3, 4, 9, 10 and 5, 6, 7, 8, were connected in parallel, respectively. The external load applied to each stack was 1 kΩ. The stacks operated for ~373.9 h under this electrical configuration.Fig. 4shows the changes in the monitored voltage V of the quadruples and stacks and the power output of the m-stack and t-stack, respectively. Under this electrical configuration the parallel group formed by MFCs 5, 6, 7, 8 reversed in polarity. The maximum power obtained immediately after the new electrical configuration (t = 0 h) was 610μW for both stacks whereas after 373 h of continuous operation, it decreased to 260μW and 220
μW for the t-stack and the m-stack, respectively (Fig. 5).
3.3. Effect of different electrical connections on the individual MFC units within the stacks
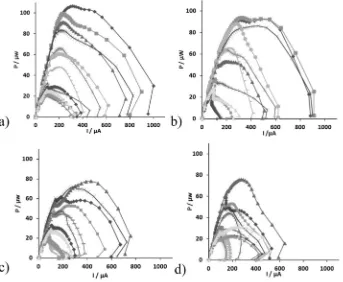
[image:4.595.304.551.391.698.2]In order to determine the effect of different electrical connections on power output of the individual MFC units, two polarisation experiments were conducted at the following times: the 1st was 60 h into thefirst electrical configuration and the 2nd was again after 60 h under the sec-ond electrical configuration, for both stacks. The power curves for the individual MFCs were produced after the cells were electrically discon-nected within the cascades (Fig. 6). As can be seen fromFig. 6a, b the
Fig. 3.Voltage behaviour of the quadruplets of (a) the m-stack versus time (V/m1–4: , V/m5–8: , V/m9–12: , V/m-stack: , m5: P/m-stack: ) and (b) the t-stack versus time (V/t1–4: , V/t5–8: , V/t9–12: , V/t-stack: , m5: P/t-stack:
[image:4.595.34.281.395.701.2]). Right axis: Power behaviour of the stacks during time.
power curves generated after the operation of the cells under the two electrical configurations, exhibited a different performance compared to their individual running during the start-up phase (Fig. 2b). In partic-ular, when the mullite cells were electrically connected their perfor-mance enhanced whilst there was less of an overshoot phenomenon.
Specifically, during thefirst electrical connection, the polarisation experiments indicated that the top four (1–4) units produced more power in comparison with the middle four (5–8) and with the bottom four MFCs (9–12) cells. Specifically, the maximum power produced was in the range of: 83–107 μW (maximum power density of 20.8–27 W/m3) for thefirst four cells of the m-stack (m1–m4); 33–66
μW (maximum power density of 8–16.4 W/m3) for the middle four (m5–m8); and 24.8–29 μW (maximum power density of 5.4–12.1 W/m3) for the bottom four cells (m9
–m12) (Table 1).
Furthermore, the bottom four MFCs (m9–m12) exhibited a double overshoot phenomenon although the overshoot peaks were less exag-gerated in comparison with those generated during the start-up phase (Fig. 6a). The declining performance in the downstream MFCs is attrib-uted to the depletion of organic matter.
[image:5.595.132.473.54.195.2]Similar behaviour was observed from the individual MFC units of the t-stack. However, terracotta cells were less powerful compared to the mullite cells when operated under the same conditions. Moreover, a double overshoot phenomenon was observed in almost all cells within the stack (Fig. 6c). In particular, the maximum power produced from MFCs t1–t4, was in the range of 53–78μW (maximum power density of 13–19.4 W/m3), from the middle four, t5–t8, was in the range of 22–48μW (maximum power density of 5.5–12 W/m3) and from the bottom four cells, t9–t12, was in the range of 21–44.5μW (maximum Fig. 5.Power and polarisation curves for (a) the m-stack (b) the t-stack. V1 ( ), V2 ( ), V3 ( ), P1 ( ), P2 ( ) and P3 ( ) represent different points in time during the maturing phase of the stacks.
[image:5.595.133.476.412.694.2]power density of 5.2–8.2 W/m3) (Table 2) The overshoot phenomenon is an indication of suboptimal performance and internal resistance var-iation, and this is in agreement with previous work [23].
Similar behaviour of the power curves was observed during the sec-ond electrical connection for the individual MFC units of both stacks (Tables 1 and 2) Although the different electrical configurations had an effect on the parallel groups, which reversed in polarity in both stacks, the power curves of the individual MFCs remained on more or less similar values and pattern for both connections (Fig. 6b, d).
3.4. Identification of the factors that caused the power decrease
After approximately 453.1 h of continuous operation, the voltage and the power output of both stacks gradually decreased. In order to identify the factors that caused this decrease and to enhance the perfor-mance of the stacks, a series of relevant targeted experiments were conducted.
3.4.1. Effect of cathode dehydration
Initially the cathode electrodes of the t-stack were hydrated with de-ionized water. Following thefirst hydration of the cathodes, an increase of 37.5% in cell voltage of the t-stack (Vcell= 330 mV) was observed. However, this decreased (within 60 h) to its previous values. When the second hydration occurred, a similar increase of 43.5% of cell voltage was observed. The cell voltage dropped again to its previous levels after 60 h of continuous operation, despite a third cathode hydration, 18.3 h after the second hydration. Thus, dehydration of cathodes was possibly one of the contributing factors to the decreasing performance of stacks.
3.4.2. Effect of electrical configuration
Since the level of voltage was not completely recovered to its initial value after the hydration of the cathodes, more tests were performed in order to identify the reasons detrimentally affecting performance. The electrical configuration was shifted to the optimum electrical connec-tion of the cells (all in parallel) and 100Ωload was applied to each stack. In order to examine if the activity of the biofilm was negatively af-fected by the voltage reversal, a second enrichment and adaptation of electrochemically active bacteria in the cells was performed in batch mode. During the second inoculation, 50% of anolyte from a separate stack, running under identical conditions, was added mixed with 50% fresh urine, used as feedstock, but no performance improvement was observed.
3.4.3. Effect of catalyst layer coating
The possibility that the activated layer of the cathode electrode coat-ing was degradcoat-ing (foulcoat-ing) over time was also examined. In order to assess this, the cathode electrodes were replaced with new identical ones, approximately 2 weeks after the start of the parallel configuration. Once again, no improvement in performance was observed. The re-placement of the cathode electrodes was followed by hydration with
deionized water, which improved performance by 22%. However, ap-proximately 16 h after this, the voltage returned to previous levels achieved before replacing the cathodes.
3.4.4. Effect of struvite deposition
As already mentioned, the greatest challenge was fuel availability, which resulted in having to run the MFCs at very low–and quite possi-bly suboptimal–flow rates (7.51 ml/h). This was certainly a contribut-ing factor both to the detriment of performance, but also to the deposition of struvite inside the anode chamber (seeFig. 1d). In order to examine this, and check whether struvite was blocking the biofilm and preventing fuel from percolating through, the cells were opened and the struvite, which accumulated on the anode electrodes was re-moved, after approximately 1 month (756.1 h) from the start of the par-allel configuration; once again there was no significant improvement recorded following this step.
3.4.5. Investigation of ceramic material blockage
Thefinal step of the investigation was to examine if the ceramic ma-terial was gradually blocked during time. In order to examine this pa-rameter, the anode and cathode electrodes were replaced by fresh identical ones, whilst keeping the same ceramic materials as the mem-brane. The cells were inoculated and matured exactly in the same way as before, i.e. in batch mode, under afixed external load of 2 kΩfor each cell. During inoculation, 50% of activated sewage sludge and 50% of fresh urine was used as feed. These attempts proved unsuccessful, in-dicating the distinct possibility that the ceramic material itself was blocked by the slow rate of ion transfer and accumulation of struvite. This was probably due to the sub-optimally lowflow rate, which would have promoted slow growing organisms and - as proven - a sig-nificant accumulation of struvite. It is also possible that the open poros-ity might have played a key role to the detriment of performance, since it was higher than the open porosity known to work better with ceramic MFCs. The higher porosity may, on the one hand, have facilitated a freer movement of ions and macromolecules, but on the other hand, due to the low rate of electron (and concomitant cation) transfer, the presence of such macromolecules might have resulted in holding-up slowly mov-ing ions, and thus blockmov-ing the passage. This may not have been the case if the material porosity was different or the material itself was of a dif-ferent composition.
[image:6.595.33.556.86.121.2]Although the performance did not improve, following the various at-tempts of recovery, it is worth noting that through these experiments (final step in particular) it was shown that the ceramic material can ac-tually block, (just like any otherfilter/porous material). This is usually if the movement of particles through the material is not continuous or is occurring at an unfavourable rate of transfer. The MFC operation is based on charged movement of electrons and ions, which if continuous and at optimum rates, then the movement across the membrane will also be continuous with minimum or zero‘stuck’molecules. Further work will investigate more thoroughly this parameter and study how Table 1
Maximum power produced from mullite cells (m) under two different electrical configurations (MFCs were named based on their position in the cascade i.e. from m1 (thefirst to receive feedstock) up to m12 (the last to receive feedstock)).
MFC unit: m1 m2 m3 m4 m5 m6 m7 m8 m9 m10 m11 m12
Pmax (μW)/1st electrical configuration 106.7 99.7 91.2 83.3 65.9 66.7 32.8 48.2 21.8 29.1 21.8 25.8 Pmax (μW)/2nd electrical configuration 92.3 93.8 53.2 86 64 88 36.5 66 22.7 21.9 37.3 28.4
Table 2
Maximum power produced from terracotta cells (t) under two different electrical configurations. (MFCs were named based on their position in the cascade i.e. from t1 (thefirst to receive feedstock) up to t12 (the last to receive feedstock)).
MFC unit: t1 t2 t3 t4 t5 t6 t7 t8 t9 t10 t11 t12
[image:6.595.37.551.709.744.2]power output can directly affect (or not) the blockage of the ceramic separator. In addition, the study of factors contributing to the stable per-formance of the stacks and improving system perper-formance will also be investigated. In particular, the role of ceramic material properties (po-rosity, composition, geometry and size) on stack performance, in addi-tion to different operating condiaddi-tions (electrical connecaddi-tion,flow rate) are critical parameters that should be considered for stack improvement and use in practical applications.
4. Conclusions
A newly designed, ceramic MFC unit was operated as part of two twelve cell cascade stacks using urine as the feedstock. The best perfor-mance occurred during thefirst electrical connection which produced a maximum power of 0.8 mW after 62.6 h of continuous operation. How-ever, the voltage and the power output of both the m-stack and t- stack gradually decreased. In an attempt to improve performance, a series of targeted tests were performed. These experiments indicated that during continuous operation, mullite and terracotta were blocked by the struvite precipitation, which was the result offlow rate and electrode conformation.
Acknowledgments
The work has been funded by the Bill & Melinda Gates Foundation, grant no. OPP1094890. During the time of this work, Ioannis Ieropoulos was funded by EPSRC, grant no. EP/L002132/1. The Authors would like to thank Mr. Andrew Stinchcombe for his invaluable technical support.
References
[1] H.P. Bennetto, Electricity generation by microorganisms, Biotechnol. Educ. 1 (1990) 163–168,https://doi.org/10.2166/wst.2011.822.
[2] D. Pant, G. Van Bogaert, L. Diels, K. Vanbroekhoven, A review of the substrates used in microbial fuel cells (MFCs) for sustainable energy production, Bioresour. Technol. 101 (2010) 1533–1543,https://doi.org/10.1016/j.biortech.2009.10.017.
[3] W. Habermann, E.H. Pommer, Biological fuel cells with sulphide storage capacity, Appl. Microbiol. Biotechnol. 35 (1991) 128–133, https://doi.org/10.1007/ BF00180650.
[4] N. Lu, S. Zhou, L. Zhuang, J. Zhang, J. Ni, Electricity generation from starch processing wastewater using microbial fuel cell technology, Biochem. Eng. J. 43 (2009) 246–251,https://doi.org/10.1016/j.bej.2008.10.005.
[5] P. Pandey, V.N. Shinde, R.L. Deopurkar, S.P. Kale, S.A. Patil, D. Pant, Recent advances in the use of different substrates in microbial fuel cells toward wastewater treat-ment and simultaneous energy recovery, Appl. Energy 168 (2016) 706–723,
https://doi.org/10.1016/j.apenergy.2016.01.056.
[6] J. Winfield, I. Gajda, J. Greenman, I. Ieropoulos, A review into the use of ceramics in microbial fuel cells, Bioresour. Technol. 215 (2016) 296–303,https://doi.org/10. 1016/j.biortech.2016.03.135.
[7] C. Santoro, C. Arbizzani, B. Erable, I. Ieropoulos, Microbial fuel cells: from fundamen-tals to applications. A review, J. Power Sources 356 (2017) 225–244,https://doi.org/ 10.1016/j.jpowsour.2017.03.109.
[8] B. Min, I. Angelidaki, Innovative microbial fuel cell for electricity production from anaerobic reactors, J. Power Sources 180 (2008) 641–647,https://doi.org/10.1016/ j.jpowsour.2008.01.076.
[9] I. Ieropoulos, J. Greenman, C. Melhuish, Microbial fuel cells based on carbon veil electrodes: stack configuration and scalability, Int. J. Energy Res. 32 (2008) 1228–1240,https://doi.org/10.1002/er.1419.
[10] H. Yazdi, L. Alzate-Gaviria, Z.J. Ren, Pluggable microbial fuel cell stacks for septic wastewater treatment and electricity production, Bioresour. Technol. 180 (2015) 258–263,https://doi.org/10.1016/j.biortech.2014.12.100.
[11] L. Zhuang, Y. Zheng, S. Zhou, Y. Yuan, H. Yuan, Y. Chen, Scalable microbial fuel cell (MFC) stack for continuous real wastewater treatment, Bioresour. Technol. 106 (2012) 82–88,https://doi.org/10.1016/j.biortech.2011.11.019.
[12] Y. Dong, Y. Qu, W. He, Y. Du, J. Liu, X. Han, Y. Feng, A 90-liter stackable baffled micro-bial fuel cell for brewery wastewater treatment based on energy self-sufficient mode, Bioresour. Technol. 195 (2015) 66–72,https://doi.org/10.1016/j.biortech. 2015.06.026.
[13] Y. Feng, W. He, J. Liu, X. Wang, Y. Qu, N. Ren, A horizontal plugflow and stackable pilot microbial fuel cell for municipal wastewater treatment, Bioresour. Technol. 156 (2014) 132–138,https://doi.org/10.1016/j.biortech.2013.12.104.
[14] J. Winfield, L.D. Chambers, J. Rossiter, J. Greenman, I. Ieropoulos, Towards disposable microbial fuel cells: natural rubber glove membranes, Int. J. Hydrog. Energy 39 (2014) 21803–21810,https://doi.org/10.1016/j.ijhydene.2014.09.071.
[15] J. Winfield, L.D. Chambers, J. Rossiter, J. Greenman, I. Ieropoulos, Urine-activated ori-gami microbial fuel cells to signal proof of life, J. Mater. Chem. A 3 (2015) 7058–7065,https://doi.org/10.1039/C5TA00687B.
[16] I. Ieropoulos, G. Pasternak, J. Greenman, Urine Disinfection and In Situ Pathogen Kill-ing UsKill-ing a Microbial Fuel Cell Cascade System, 2017 1–12.
[17] G. Pasternak, J. Greenman, I. Ieropoulos, Comprehensive study on ceramic mem-branes for low-cost microbial fuel cells, ChemSusChem 9 (2016) 88–96,https:// doi.org/10.1002/cssc.201501320.
[18] G. Pasternak, J. Greenman, I. Ieropoulos, Regeneration of the power performance of cathodes affected by biofouling, Appl. Energy 173 (2016) 431–437,https://doi.org/ 10.1016/j.apenergy.2016.04.009.
[19] I. Ieropoulos, J. Greenman, C. Melhuish, Urine utilisation by microbial fuel cells; en-ergy fuel for the future, Phys. Chem. Chem. Phys. 14 (2012) 94–98,https://doi.org/ 10.1039/C1CP23213D.
[20] I. Merino Jimenez, J. Greenman, I. Ieropoulos, Electricity and catholyte production from ceramic MFCs treating urine, Int. J. Hydrog. Energy 42 (2017) 1791–1799,
https://doi.org/10.1016/j.ijhydene.2016.09.163.
[21] I. Gajda, J. Greenman, C. Melhuish, I. Ieropoulos, Simultaneous electricity generation and microbially-assisted electrosynthesis in ceramic MFCs, Bioelectrochemistry 104 (2015) 58–64,https://doi.org/10.1016/j.bioelechem.2015.03.001.
[22] J. Winfield, I. Ieropoulos, J. Greenman, Investigating a cascade of seven hydraulically connected microbial fuel cells, Bioresour. Technol. 110 (2012) 245–250,https://doi. org/10.1016/j.biortech.2012.01.095.
[23] J. Winfield, I. Ieropoulos, J. Greenman, J. Dennis, The overshoot phenomenon as a function of internal resistance in microbial fuel cells, Bioelectrochemistry 81 (2011) 22–27,https://doi.org/10.1016/j.bioelechem.2011.01.001.