Using data in decision-making: analysis from the music industry
Glenn Parry
Bristol Business School, University of the West of England [email protected]
Ferran Vendrell-Herrero
Birmingham Business School, University of Birmingham [email protected]
Oscar F. Bustinza
Management Department, University of Granada [email protected]
Biographical Notes
Glenn C Parry, Ph.D.(Cantab) is an Associate Professor of Strategy and Operations Management at the University of the West of England, UK. His work aims to capture leading practice, moving companies forward through transformations based upon data driven analysis. He has been published in a number of international journals and has published the books, “Build to Order: The Road to the 5-day Car”,
“Complex Engineering Service Systems” and "Service Design and Delivery" which was ranked in The IIJ top 20 upcoming design books for innovators.
Ferran Vendrell-Herrero, Ph.D.(Universitat Autonoma de Barcelona) is a lecturer in managerial economics in the University of Birmingham, UK.His research interests focused on assessment of innovation policies for SMEs and the servitization process in creative industries. Dr. Vendrell-Herrero’s research has been published in the International Journal of Production Economics, Small Business Economics, Regional Studies and Supply Chain Management among other outlets.
Oscar F. Bustinza, Ph.D.(University of Granada) is an Associate Professor of strategy and operations management at the University of Granada, Spain. His work aims to capture successful business practices, analyzing drivers of firm’s boundaries choice and the leveraging of supplier, customer or inter-firm relationships based upon data driven analysis. Dr. Bustinza’s research has been published in the International Journal of Operations and Production Management, International Journal of Production Economics, Journal of Supply Chain Management,
International Journal of Production Research, and British Journal of Management among other outlets.
Acknowledgements:
Abstract:
Internet use provides an increasing amount of data that has potential value for managers and policy makers. However, without a precise understanding of the meaning of data, erroneous conclusions may be drawn which could adversely affect future decisions made by managers.
The aim of this paper is to reveal to stakeholders the weaknesses and biases of reports which use analysis from large data sets and to highlight key areas and questions they may ask.
This paper examines empirical research in the music industry and critiques a report using ‘clickstream data’, a data source that collects information on the navigation patterns of Internet users through the ‘clicks’ they make on website.
The paper focuses critique on a report published by the European Commission which provides analytically weak and potentially industry damaging conclusions about the relationship between file sharing activity and purchasing behaviour.
Introduction
As individuals spend more time online, large data sets providing detail of their activities, preference and likes are becoming available for analysis. The results of analysis of such ‘big data’ are increasingly used to inform strategic decisions (Strategic Direction, 2013). Whilst analysis of big data provides valuable insight for strategy, the complexity of analysis means that any theoretical weaknesses in such analysis can create misleading conclusions. This paper focusses upon one particularly interesting and valuable ‘big data’ source, clickstream data, and uses a published EU Commission Joint Research Centre report (Aguiar and Martens, 2013) as an exemplar of the potential issues that imprecision in the usage of data can have for decision makers.
An Internet users activity (i.e. webpages visited) may be captured in a computer register and used to generate datasets, usually described as clickstream data. Clickstream data reports page views, so is useful in charting a journey of a user as they navigate through the internet and in further gaining information of the users’ potential interests. Clickstream datasets are potentially valuable for companies and governments as data that gathered is richer than traditional customer survey data as customers' online browsing behaviour can be followed extensively, creating very large datasets. However, it does not capture the context of use, such as actual activity on a page, any user interpretation of content, the users intent or the value they seek to gain from the experience when on a webpage (Bucklin and Sismeiro, 2009; Moe and Fader 2004). Whilst popular media increasingly talk of the value of big data there is a need for a note of caution. The paper is set in the context of the music industry and highlights the need for managers and policy makers to question carefully any analysis presented to them and provides a set of questions to be addressed.
Data and the Music Industry
Market data from the music industry sector shows that total revenues have been in decline since the start of the twenty first century (IFPI, 2011; Liebowitz, 2008; Parry
(Bustinza et al., 2013). The first explanation has been named purchase substitution or sales displacement (Liebowitz, 2006) and proposes that consumers substitute legal purchases for illegal downloads through what is known as file sharing or pirating music. Illegal file sharing directly violates the Intellectual Property Rights (IPR) of creators and distributors (Siwek, 2007). The second explanation deals with the difficulties of the music industry in adapting to the new digital requirements of its consumers, which implies that industry leaders need to innovate and find more suitable business models for the new market conditions (Teece, 2010). The file sharing explanation can be used directly in calls for politicians and governments to develop regulation, while the business model explanation requires the strategy leaders of the industry to adapt the market offerings. Understanding the nature of this dyad requires the determination of the extent of piracy, a non-trivial challenge for data scientists.
presented with reports based on large data sets which may be used to shape strategic and policy decisions.
The research of Aguiar and Martens (2013), A&M thereafter, uses Nielsen Clickstream Data. This data captures mouse clicks, webpage URL, the time and length of page visit and a classification of the webpage according to its content. A&M analysis looks at the relationship between Internet clicks on illegal download website pages and clicks made by computer users on the webpages of music purchasing websites, which provides a new and potentially valuable methodological approach.
The results and conclusions A&M draw from their analysis support the idea that piracy is good for the music industry. Piracy is a heavily debated topic in the creative industries and a suggestion that it is beneficial which is backed by empirical analysis undertaken by the EU Commission research centre is controversial and potentially damaging if untrue as it clearly suggests to industry that they should embrace piracy and to policy makers that they need not introduce antipiracy measures. The results of such analyses have significant political and industry implications and therefore they need to be robust and conclusive before managers’ act and politicians change existing regulation. The aim of this paper is to reveal to policy makers and industry stakeholders the weaknesses and biases of the theory and evidence which may be provided to them to inform their decisions and to highlight key areas to challenge and questions they may ask, taking the EU commission report produced by A&M as an example for critique.
Theoretical weaknesses Economic issues
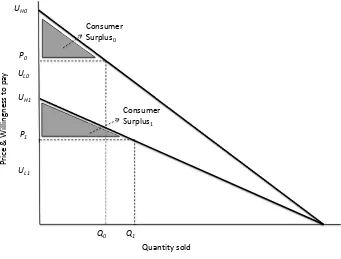
Reports which present analysis of data are usually created around a scenario or context and the starting point of the A&M (2013) argumentation is based in economics. They define a system that, in the absence of file sharing, for a given price of goods, P0, consumers who’s valuation of the good is larger than the price (UH>P0)
would make a purchase. Other consumers would decide not to purchase because their valuation is below the market price (UL<P0). With the appearance of a free alternative
to achieve the same music good (PFS=0) a proportion of consumers with high
valuation for music goods (λ*NH) and a proportion of those with a low valuation
of, by definition, a ratio between 0 and 1. A&M recognise at this point in their model that there is some degree of purchase substitution. In this framework the group of consumers who place a low valuation on the goods and who use illegal file sharing sites are not seen as problematic as they were not purchasers in the initial situation. Having been provided with a given initial situation/scenario by A&M it is important to ask: is their framework correct? what are their implicit assumptions?
Under a common framework of price competition with homogeneous goods, Bertrand (1883) states that if only two firms compete in a market the equilibrium could be the same as that of perfect competition, which would be selling goods at a price that equals marginal cost. The marginal cost for a consumer of a downloaded file taken from a file-sharing network is assumed to be close to zero. In the given competitive context incumbent music industry companies would go out of business as they could not survive if to compete they needed to make their output market price equal or lower than their marginal cost. This situation would imply a sales displacement of one (λ=1). Therefore, if A&M consider that sales displacement could be smaller than one, they are assuming that file sharing sites and the music industry compete with heterogeneous goods. This is consistent with Casadesus-Masanell and Hervas-Drane (2010) who posit that commercial legal online content providers can optimize and deliver new experiences to consumers (i.e. speed, quality, fashion), which cannot be matched by decentralized, self-sustained P2P networks. Therefore there is agreement in the literature with A&M that there is a degree of sales displacement and that file sharing sites and commercial music firms are providers of non-homogeneous goods and hence have different prices.
However, there are issues around subsequent conclusions which are made based on this finding. A&M conclude that file sharing sites in the music industry increase welfare, converting some producer’s revenues into consumer surplus. Recently Greenstein and McDevitt (2011, p. 631) stated, “No careful method exists for calculating the consumer surplus for an unprized good with widespread user contributions”. The increase in welfare conclusion may not be directly derived as argued by A&M. In fact, such a conclusion would need two additional implicit assumptions to be made. Both the demand function (in the simplified framework defined by UHand UL) and price of commercial music must hold constant before and
after the appearance of illegal file sharing networks (P0=P1). For instance if P0>P1
some consumers who were previously in the UL group could be transformed into
buyers. This would not necessarily be true if the utility of those consumers also decreased. For example, if a consumer found that many people had taken for free what they had paid for, they may lower the valuation they place on that good. This is an argument which is seated in the theory of positional goods (Frank, 1985).
Positional goods are defined as those goods whose value depends upon how they are compared with things owned by others. Hence, a certain degree of uniqueness is a requirement for an increase in the value of a given positional good. When more of a good is made available, in the case of digital files a copy available on an illegal file sharing site, valuations fall. For digital copies of a file made available on illegal networks outside of controlled industry channels, supply becomes potentially infinite and this reduces the valuation and the willingness to pay of those consumers with initial high valuation (UH). Such a rise in supply volume could
transform high valuation individuals into individuals with low valuation (UL). Figure
1 provides a graphical example of what could be happening (without considering the consumer surplus of illegal downloads). If prices and willingness to pay have decreased then the consumer surplus has simply changed, but information is not available to identify if the surplus has increased or decreased. Whilst further investigation of the effect of illegal file sharing on consumer valuation is a matter for future research, the work shows that logical tests could reveal the potential weakness in conclusions and lead to further tests for robustness.
[Insert Figure 1] Innovation issues
of one of the most cited papers in the field, Elberse (2010), not cited in A&M report. The evidence provided by Elberse comes from consumer transaction data provided by Nielsen SoundScan, the same provider of the A&M dataset, though not Clickstream as she instead uses information on dollar expenditure. Elberse found that the dollar amounts gained through song sales remain far below the level needed to offset the revenues lost due to lower album sales. The cost of bringing an individual song track to market is virtually the same as bringing an album to market (Rifkin, 2000) and coupled with evidence from literature challenges the A&M argument that music industry successfully reacted to file-sharing through offering new business models.
The ability of incumbent firms to innovate, develop and deploy new business models to transition into the digital age is an on-going challenge and incumbents may not survive the transition (Ng, 2013). The ability to survive the transition to the digital age and the role of data will be the focus of future studies.
Data construction issues
When utilizing data sources it is important to consider the manner in which the data was collected and understand the impact that may have upon results and hence decisions. To collect clickstream data the user voluntarily installs a piece of software that tracks their behaviour (Moe and Fader, 2004). Installation of tracking software is not typical of consumers, so sample bias is arguably stronger than would be found in research based on consumer surveys. Moreover, the individual is reminded that they are being observed every time they identify themselves on a machine via a login. External observation may change behaviour, a phenomena known as the Hawthorne effect (Simoff et al., 2008). Due to the monitoring, consumers with the software installed in one computer may well use another computer for private or illegal activity. These are important limitations of the use of clickstream or other data collected in this way. The implication for the A&M report is that illegal activity might be under-represented.
information for a subsample of 16,290, effectively dropping relevant observations of 8,710, 34.8% of the sample. Examination reveals that the data problem caused by the group of consumers excluded from the analysis is that they did not visit the webpages pre-selected by the researchers as sites for illegal downloading, legal streaming or legal purchase. The data analysis spread sheet for the ‘non-visiting’ consumers would have zeros within the cells related to them but these should not be treated as ‘missing data’, as these consumers were active online, just not within the boundaries set by the researchers. When interpreting results decision-makers and academics should always question why complete datasets were not used, what was done with the ‘missing’ data and why authors do not perform robustness tests with subsamples.
The use of proxy variables is usual in quantitative methodologies when the variable of interest is not observable (Trenkler and Toutenburg, 1992). Proxy variables must always be treated with caution and their logic questioned. In this case A&M use clickstream data as a proxy for expenditure in digital stores. Taking this proxy is questionable as current research is still unclear as to consumer browsing behaviour within a website (Bucklin and Sismeiro, 2009) or predicting when consumer website visits convert into purchase (Moe and Fader, 2004). A first condition for using a proxy is that they must be positively correlated with the original variable. A&M do not provide evidence that clickstream data is positively correlated with purchasing. Indeed, there is some literature arguing that the value of a click differs between consumers so the conditional probability of purchasing after a click is not homogeneous in the sample. As an example Moe (2003) argues that there are four uses for clicks when navigating commercial websites: buying, browsing, searching, or knowledge building. This heterogeneity challenges the correlation of clicks with purchasing.
music. This kind of variable construction may be taken to invalidate credible interpretation of the parameters estimated as, from a given dataset, it is difficult to know what is happening.
Further examining actual consumer behaviour, clickstream data is currently unable to provide information of consumer behaviour within large multi-offering websites like Amazon. It is important to recognise when data is interpreted and excluded, particularly when the data in question may be related to a large number of clicks or a significant firm in a market. A&M recognise this limitation and provide an interpretation in a footnote (p.7 in their report) where they argue that the inclusion of these clicks would produce a larger measure of the legal purchasing variable and hence they expect this effect to have downward bias on their estimates. This interpretation has an assumption of ‘purchase’ behaviour, but clickstream gives information of Internet usage not purchasing behaviour. For instance, the claim that their parameter is biased downwards, meaning that their estimated elasticity is smaller than actual, makes little statistical sense. There remains a possibility that those who purchase from Amazon are non-file sharers and if they were non-file sharers their parameter would be biased upwards, which could imply that the actual elasticity could be negative, as found in previous literature regarding purchase substitution (Liebowitz, 2006). The report accepts that their estimated elasticity is biased, but such claims of bias needs to be examined.
Econometric issues
as economically relevant. The correlation of streaming and buying clicks is 0.3634 and is statistically different from zero at 1%. According to Krzanowski (2000) this would be classified between weakly (0.2) and moderately (0.5) positive. To confirm this small association we calculate an approximation of the ratio of explained variance, or R2 of a model, where downloading clicks and streaming clicks are
explanatory variables of buying clicks.
Compared with Figure 1 of the A&M (2013) paper, where the different type of music consumers are showed in percentage terms, we are going to present one of the traditional analyses that must be undertaken after calculating a correlation matrix. To decide which variables should be evaluated for further inclusion in an analysis of causal relations it is necessary to calculate the percentage of variance explained by each variable, as opposed to the percentage of people who belong to each group. In doing so we calculate partial correlations and semi-partial correlations by taking the correlation matrix of the paper:
The unique variance will be (0.03886)2 = 0.0015. That value, 0.15%, is the
unique variance explained by X1, the downloading variable. Then, we can calculate
common variance X1, X2 = (0.0559)2 - 0.0015 = 0.0016. If we do the same for X2, the
streaming variable:
The unique variance will be (0.36115)2 = 0.1304. That value, 13.04%, is the
unique variance explained by X2, the streaming variable. If we add these values we
0.15%+13.04%+0.16%= 13.35% (R2 = 0.1335). Variance unexplained by X
1, X2 =
1-0.1335=0.8665 (86.65%).
This would imply that only 13.35% of the variation in the buying variable can be explained by the explanatory variables (streaming explains 13.04% and downloading only 0.15%). The remaining 86.65% can be attributed to unknowns, the lurking variables which are not discussed or apparent in the analysis or discussions. This approximation is close to the R2 reported in the A&M baseline model (Table 5, Column 1, R2=0.162), which includes some control variables such as personal characteristics and total time spent on the Internet. Overall, through applying the process recommended by statistical manuals before carrying out a regression analysis, even in lognormal cases, the unique variance explained by the downloading variable is 0.15% (over 100% the variable explains only 0.15%). So, the variable can only explain a fraction of the purchasing behaviour observed. The value obtained for the downloading unique variance means that it is not recommended for inclusion due to the low prior predictive effect (See Hair et al., 2001). These calculations clarify the statistical appropriateness of the use of the variables, using a similar diagram as shown in Figure 2.
[Insert Figure 2]
Adoption of the wrong premise during analysis is not only a problem with regards the statistical appropriateness of the variables selected by A&M (2013). Another source of misleading results comes from the consistency between variables and the methodology used. Some measures require a more sophisticated method. For instance, clickstream data is not continuous; instead it is discrete and has a counting nature (number of clicks on purchasing websites) which must be treated with Poisson or Negative Binomial regression models. Again, A&M are imprecise in the method selected. In order to make the analysis more robust they must provide econometric models correcting for the nature of the dependent variable, in this case simply not taking logarithms in the dependent variable. According to Figure 1 of A&M (2013) the dependent variable has 43.4% zeros. The fact that the sample has a large quantity of zeros may imply that in this case a Negative Binomial will outperform a Poisson regression (Greene, 2003).
directionality. The objective of the A&M (2013) paper is to analyze the “causal” relationship between illegal downloading and digital purchasing. They only analyze how piracy influences purchasing, not the relationship in the opposite direction, how purchasing influences piracy, and the acknowledged limitations in the report only touch upon this. To provide clarity on this point, the A&M results could be consistent with file sharers visiting purchasing websites to discover new music or to check some relevant information about a song they are searching for before moving to illegal websites to download music for free. The problem in the analysis is caused by reverse causality; they do not provide empirical evidence that someone clicking on an illegal download websites did not first go to a legal digital purchase site.
Let us present the problem more formally based on Wooldridge (2002) and Stock and Watson (2012) and discussed in depth by Visnjic and Van Looy (2013). A&M acknowledge an important source of endogeneity; missing variable syndrome. The missing variables may be correlated with both error terms, dependent variable (clicks on purchasing sites) and independent variable (clicks on illegal download sites). This results in endogeneity and means the parameters used are biased and inefficient. Another common cause of correlation between the error terms and the independent variables that generates endogeneity is the presence of simultaneous causality. This is not acknowledged by A&M and it is complex to deal with. Econometricians recommend using the instrumental variables approach to avoid simultaneous causality (Sargan, 1958). The instrumental variables approach is a system of equations where the (endogenous) independent variable is first ‘regressed’ on another variable (named the ‘instrument’), which is used to explain the independent variable and is unrelated to the dependent variable. Instruments are ‘strong’ when they can sufficiently explain the independent variable and are ‘independent’ or ‘exogenous’ when they are unrelated to the error term and the dependent variable. Managers must take care when presented with analysis which uses instruments. Finding a strong instrument is challenging as, due to the idiosyncratic nature of independent variables, there is limited theory available as to how to select appropriate instruments (Wooldridge, 2012).
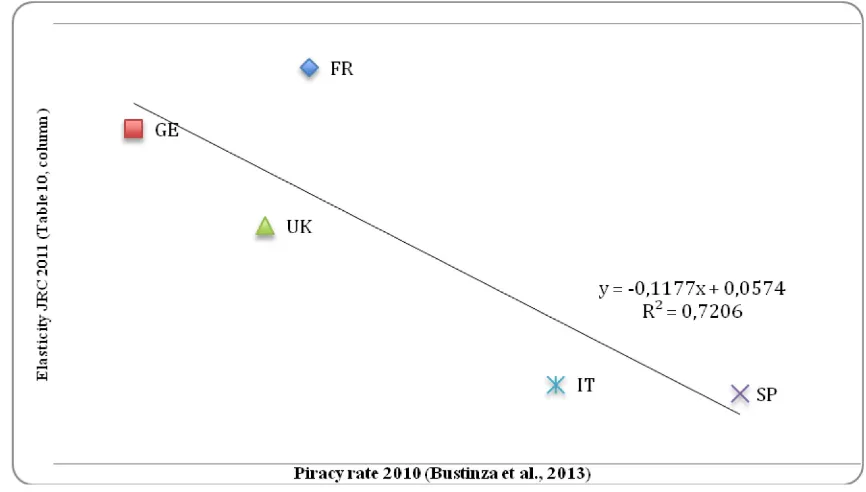
It is important to sense check findings against other work. One way of doing this is to compare the aggregate values of the variables at country level. In a recent article published by Bustinza et al. (2013) the country reported to have the highest piracy rate in the sample studied was Spain (44% of population) and the country with the lowest piracy was Germany (14%). The findings are consistent with the results found in the A&M clickstream sample, in which Spain has 10.38 clicks per person and Germany 6.24 clicks per person. Other similarities with previous research are found in the relationships between working status and gender and illegal downloading. For example Cox (2012, p.162) found that females and individuals who have a high income are less likely to pirate music than males and the unemployed. These similarities imply that Clickstream measurements show a high degree of consistency with sources based on consumer surveys. However, as commented upon in the introduction the A&M (2013) analysis is the only publication from literature known to the authors which finds a positive relationship between illegal downloading and purchasing. This relationship is country specific as the elasticity is close to zero in Spain and Italy, and close to 0.04 in France or UK. This implies that an increase in 1% of the clicks on illegal downloading websites will correspond to clicks in purchasing websites increasing by 0.04% in the UK and France but will not change the click count in Spain and Italy, the countries with the higher piracy levels. The data presents a form of inverse relationship between levels of piracy and legally buying music, see Figure 3 for a test of this negative relation. The A&M proposition is that countries with lower piracy levels could somehow benefit from piracy but this benefit disappears when the country piracy level is high, such as in Italy or Spain. In others words, the lower the level of piracy in a country, the stronger the positive impact of piracy on sales will be. By setting the value of piracy at 0% it can be shown that the predicted elasticity would be 0.0574, suggesting that piracy could be beneficial for those countries with low piracy and piracy could have a negative effect for those countries with high piracy rates, those larger than 0.0574/0.1177 = 48.77%.
[Insert Figure 3]
an average of the monthly piracy rates. Using this data an estimate of the elasticity for the years 2011 and 2012 is made, or assuming that the piracy requires two periods to impact on sales, just elasticity for 2012.
Estimation of 1 year elasticity (t) = (Ln (salest) – Ln (Salest-1))/ (Piracyt – Piracyt-1)
(1)
Estimation of 2 year elasticity (t) = (Ln (salest) – Ln (Salest-2))/ (Piracyt – Piracyt-2)
(2)
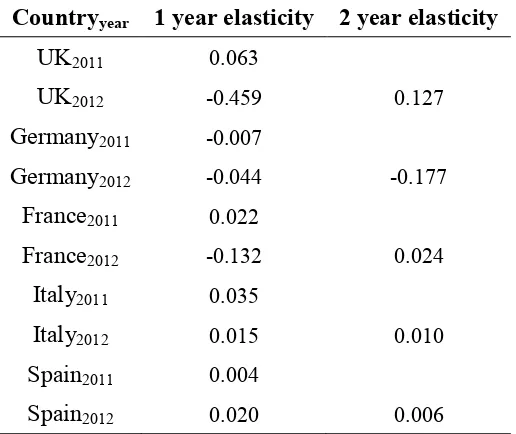
Table 1 shows the results of this estimation of elasticity for each country. This methodology has limitations, but the results are purely to illustrate how such an analysis may contradict the results of A&M (2013). Results of this new analysis show a negative elasticity for countries with low piracy (Germany) and positive elasticity for countries with high piracy (Spain).
[Insert Table 1]
It is possible to estimate the average elasticity using the model presented in
Equation 3, where α is the constant and β is the average elasticity for our sample,
which covers the period 2010-2012.
Ln (salesit) = α + β*(Piracyit) + εit (3)
Table 2 presents the value and significance of the parameter β subject to different specifications. The baseline model is the pooled estimation, which corresponds to Equation 3, and reports a negative elasticity of -0.082, a result significant at 1%. This result implies that on average an increase of 1% in the piracy rate of a given country will reduce its industry sales in 0.082%. According to the likelihood ratio test provided in the last column the models containing year dummies and country specific information (in this case measured by country legal origin) do not have significantly more capacity to explain the variance of the dependent variable. Result reported in Figure 3, Table 1 and Table 2 comes from a very small sample and results cannot be conclusive. However, they can be seen as a guide for future research on the topic.
[Insert Table 2]
Key questions
analyse the data to help guide strategy (Strategic Direction, 2013). Clickstream, a data source that collects information on the navigation patterns of Internet users through the ‘clicks’ they make on website, is a good example. However, strategy makers must take great care when presented with statistical analysis of datasets. There are many potential errors which may be made in good faith in reports and which careful analysis, logical tests or questions can identify. For instance, individual actions captured in clickstream data are valuable for identifying general patterns of Internet users but have important limitations when related to predictability of purchasing behavior. In particular, we recommend decision makers assure that the following questions are adequately addressed in any analysis reported:
• What is the scenario presented?
o Is the framework correct?
o What are the implicit assumptions?
• Are logical weaknesses apparent when conclusions are applied to practical examples?
o Are further tests for robustness of conclusions required and available? • Does the analysis draw on all the current work in the field?
o Are there any important omissions? • How was the data collected?
o What impact may the method of data collection have upon results? • Was all the data collected used?
o Why were subsets unused?
o How much data was classed as ‘missing’?
o What was done with ‘missing’ data?
o Were all ‘missing data’ treated equally? • Are there claims of bias in the data or findings?
o Can they be examined and explained? • Were direct measurements or proxy variables used?
o Do proxy variables also encompass other factors and if so what is the effect? • Are the correlations significant?
o What is the percentage of variance explained by each variable?
o How much do the variables explain variance and how much of the variance is unknown?
• Is the method of analysis suitable for the type of dependent variable used? • Is causality between variables demonstrated?
o Are instrumental variables used?
o Is confidence high that the instruments are strong? • Does directionality exist in analysis?
o If A influence on B is considered, has the influence of B on A also been considered?
• Are the variables measurement and results consistent with previous empirical research?
In this work we have provided an in depth analysis of the report published by Aguiar and Martens (2013), who provides some insights into the music industry. Their publication has created much online discussion and industrial organizations including IFPI and Hadopi have written critiques of the work (Hadopi 2013; IFPI 2013) as it is the first work concluding that piracy is positively linked to purchasing. The weaknesses throughout their empirical analysis undermine the validity of the claims made in the work. Through our analysis we identify a set of questions which may be used to test any analysis presented. If A&M had chosen to publish their work in a peer reviewed academic journal they may have been subjected to more rigorous review and these weaknesses challenged before public release. We would suggest that authors, who released their work through formats such as the European Commission publications recognize that their work will have impact for policy and industry. In publishing findings which have clear implications for industry and policy makers, authors have a duty of care over the validity and robustness of their work and should more clearly state the limitations of their empirical analysis. A&M caveat “we cannot draw policy implications” (p3) brings into question the authors understanding of the potential impact of their publication.
References
Aguiar L, Martens B. 2013. Digital music consumption on the internet: evidence from clickstream data”. European Commission Working Paper JRC79605 ISBN 978-92-79-28901-9.
Andersen B, Frenz M. 2010. Don’t blame the P2P file-sharers: the impact of free music downloads on the purchase of music CDs in Canada. Journal of Evolutionary Economics20(5): 715–40.
Bertrand J. 1883. Review of ‘Théorie mathématique de la richesse sociale’ and ‘Recherches sur les principes mathématiques de la téorie des richesses’. Journal des Savants 499–508.
Bucklin RE, Sismeiro C. 2009. Click here for internet insight: advances in clickstream data analysis in marketing. Journal of Interactive Marketing23(1), 35–48.
Casadesus‐Masanell R, Hervas‐Drane A. 2010. Peer‐to‐peer file sharing and the market for digital information goods. Journal of Economics & Management Strategy19(2): 333–373.
Chi W. 1994. Trading in strategic resources: necessary conditions, transaction cost problems, and choice of exchange structure. Strategic Management Journal 15(4): 271–290.
Chi W. 2008. Does file sharing crowd out copyrighted goods? Evidence from the music recording industry. Working Paper. Department of Economics: Johns Hopkins University.
Christensen, C. M., & Overdorf, M. 2000. Meeting the challenge of disruptive change. Harvard Business Review, 78(2): 66-77.
Cox J. 2012. Studies in Licit and Illicit Markets for Digital Entertainment Goods. Doctoral dissertation: University of Portsmouth.
Denscombe M. 2010. The Good Research Guide: For Small-Scale Social Research Projects. McGraw-Hill: Berkshire, UK.
Frank RH. 1985. The demand for unobservable and other non-positional goods.
American Economic Review 75(1): 101–116.
Greene WH. 2003. Econometric Analysis. Pearson Education: India.
Greenstein S, McDevitt RC. 2011. The broadband bonus: estimating broadband Internet's economic value. Telecommunications Policy 35(7): 617–632.
Elberse A. 2010. Bye-bye bundles: the unbundling of music in digital channels.
Journal of Marketing74(3): 107–123.
Hadopi (2013). Information and discussion on the "Digital Music Consumption on the Internet" study.
http://www.hadopi.fr/sites/default/files/page/pdf/DREV-20130409-VEILLE%20ET%20DOCUMENTATION-JRC%20%282%29.pdf
Hair JF, Anderson RE, Tatham RL, Black WC. 2001. Multivariate Data Analysis,
Prentice Hall International: New York.
Hong SH. 2004. The effect of Napster on recorded music sales: evidence from the consumer expenditure survey. Working Paper, 03-18. Stanford Institute for Economic Policy Research.
IFPI. 2011. Digital Music Report 2011: Music at the Touch of a Button. http://www.ifpi.org/content/library/DMR2011.pdf
IFPI. 2013. IFPI Says Digital Music JRC Study is Flawed, Misleading and Disconnected from Commercial Reality.
Krzanowski WJ. 2000. Principles of Multivariate Analysis, Oxford University Press: Oxford.
Liebowitz SJ. 2006. File sharing: creative destruction or just plain destruction?.
Journal of Law and Economics49(1): 1–28.
Liebowitz SJ. 2008. Research note: testing file sharing's impact on music album sales in cities. Management Science54(4): 852–859.
Moe WW. 2003. Buying, searching, or browsing: differentiating between online shoppers using in-store navigational clickstream. Journal of Consumer Psychology13(1): 29–39.
Moe WW, Fader P. 2004. Capturing evolving visit behavior in clickstream data.
Journal of Interactive Marketing, 18(1): 5–19.
Ng, I. 2013. New Business and Economic Models in the Connected Digital Economy, Journal of Revenue and Price Management, forthcoming Available online: http://www.academia.edu/4228986/New_Business_and_Economic_Models_in_t he_Connected_Digital_Economy
Oberholzer‐Gee F, Strumpf K. 2007. The effect of file sharing on record sales: an empirical analysis. Journal of Political Economy115(1): 1–42.
Parry G, Bustinza OF, Vendrell-Herrero F. 2012. Servitisation and value
co-production in the UK music industry: an empirical study of consumer attitudes.
International Journal of Production Economics135(1): 320–332.
Rifkin J. 2000. The Age of Access. Penguin: Harmondsworth, UK.
Rob R, Waldfogel J. 2004. Piracy on the High C's: Music Downloading, Sales Displacement, and Social Welfare in a Sample of College Students (No. w10874). National Bureau of Economic Research.
Sargan JD. 1958. The estimation of economic relationships using instrumental variables. Econometrica: Journal of the Econometric Society26(3): 393–415.
Simoff S, Böhlen MH, Mazeika A. 2008. Visual Data Mining: Theory, Techniques and Tools for Visual Analytics. Springer: New York.
Siwek SE. 2007. The True Cost of Sound Recording Piracy to the US Economy. Institute for Policy Innovation: New York.
Stock JH, Watson MW. 2012. Introduction to Econometrics: Global Edition. Pearson Education: New York.
Teece DJ. 2010. Business models, business strategy and innovation. Long Range Planning43(2): 172–194.
Trenkler G, Toutenburg H. 1992. Proxy variables and mean square error dominance in linear regression. Journal of Quantitative Economics8: 433–442.
Visnjic I, Van Looy B. 2013. Servitization: disentangling the impact of service business model innovation on manufacturing firm performance. Journal of Operations Management 31(4): 169–180.
Wooldridge JM. 2002. Econometric Analysis Cross Section Panel. MIT Press: Boston.
Wooldridge JM. 2012. Introductory Econometrics: A Modern Approach. South-Western Pub: Nashville.
Pr
ic
e &
W
ill
in
gn
ess
to
p
ay
Quantity sold UH0
UL0
P0
Q0 Q1
UH1
P1
UL1
Consumer Surplus0
[image:21.595.122.463.84.343.2]Consumer Surplus1
Figure 1. Consumer surplus before and after the introduction of file sharing sites
Figure 2. Percentage of the Variance of the dependent variable explained by independent variables
13.04% 0.15%
0.16% 86.65%
X1 Downloading X2 Streaming
[image:21.595.136.462.454.622.2]Table 1. Estimated elasticity between piracy rate and sales at 1 and 2 years Countryyear 1 year elasticity 2 year elasticity
UK2011 0.063
UK2012 -0.459 0.127
Germany2011 -0.007
Germany2012 -0.044 -0.177
France2011 0.022
France2012 -0.132 0.024
Italy2011 0.035
Italy2012 0.015 0.010
Spain2011 0.004
Spain2012 0.020 0.006
Table 2. Estimating the average elasticity
Specification β – Elasticity R2 Lrtest
Pool estimation -0.082*** 74.35% ---
Year fixed effects -0.084*** 76.66% chi2(2)= 1.4
Year fixed effects and French legal origin
dummy -0.064*** 80.88% chi2(3)= 4.4
[image:23.595.75.527.372.471.2]