Cointegration of event-related potential (ERP) signals in
experiments with different electromagnetic field (EMF)
conditions
Argiro E. Maganioti1*, Hountala D. Chrissanthi1, Papageorgiou C. Charalabos2,3,
Rabavilas D. Andreas3, Papadimitriou N. George2, Capsalis N. Christos1
1National Technical University of Athens, Department of Electrical Engineering, Division of Information Transmission Systems and
Material Technology,Athens, Greece; *Corresponding Author: [email protected]
2Department of Psychiatry, Eginition Hospital, University of Athens, Athens, Greece 3University Mental Health Research Institute (Umhri), Athens, Greece
Received 11 December 2009; revised 20 February 2010; accepted 23 February 2010.
ABSTRACT
Due to their non-stationarity, ERP signals are difficult to study. The concept of cointegration might overcome this problem and allow for the study of the co-variability between whole ERP signals. In this context cointegration factor is defined as the ability of an ERP signal to co-vary with other ERP signals. The aim of the present study was to investigate whether the cointegra- tion factor is dependent on different EMF condi- tions and gender, as well as the locations of the electrodes on the scalp. The findings revealed that women have a significantly higher cointe- gration factor than men, while all subjects have increased cointegration factors in the presence of EMF. The cointegration factor is location de-pendent, creating a distinct cluster of high coin- tegration capacity at the central and lateral electrodes of the scalp, in contrast to clusters of low cointegration capacity at the anterior and posterior electrodes There seem to be distinct similarities of the present findings with those from standard methodologies of the ERPs. In conclusion cointegration is a promising tool towards the study of functional interactions bet- ween different brain locations.
Keywords: EMF; ERP; Stationarity; Cointegration; ACF
1. INTRODUCTION
The electroencephalogram (EEG) is a non-invasive tech- nique, providing a millisecond by millisecond readout of the brain’s processing of information, and is relatively
inexpensive to implement. Event-related potentials (ERPs) are a reflection of the brain’s electrical response to stim- ulation. Typically, the event-related activity is small and is, thus difficult to view in the single trial. It is usually covered by the ongoing ‘spontaneous’ EEG. ERPs tech- niques overcome this initially poor signal to noise ratio by averaging across many trials, typically from about 15 to several hundred [1].
Both EEG and ERP signals are time series. Stationary EEG signals are successfully analyzed in the frequency domain using Fourier transformations [2]. It has been found that electromagnetic fields (EMF), similar to those emitted by mobile phones, have a gender specific effect on the energy of the EEG [3]. However, Fourier trans- formations cannot be applied on the non-stationary ERP signals. There are a number of alternative approaches that overcome the issue of non-stationarity, such as windowed Fourier [4,5] and wavelet analysis [6,7].
The majority of the studies analysing ERPs focuses on certain components of the ERP signal (P50, N100, P200, N200, P300, N400, P600) [8,9], each of which receives a particular functional interpretation in the physiology of the brain. Very few analyses have been made employing the whole time-series and even less regarding the corre- lation among the activity of different electrodes. The common methods used for processing ERPs include coherence [10], regression [11], correlation [12] and Granger causality [13]. Most of these methods were first developed in economic sciences.
In the present study, cointegration is defined as theability of two ERP signals to co-vary in time. The aim is to investigate whether this ability is dependent on different EMF conditions and gender, as well as the locations of the electrodes on the scalp.
2. METHODS
2.1. Participants
Two different groups of people, who took part in two separate experiments, were used in this study. The first group consisted of nineteen healthy individuals (9 men and 10 women, mean age = 23.3 ± 2.23 years, mean education = 16.9 ± 1.82 years) and participated in the first experiment. The participants of the second experi- ment were twenty healthy individuals (10 men and 10 women, mean age = 22.75 ± 2.71 years, mean education = 16.3 ± 1.71 years). In both experiments, the male and female subgroups were homogeneous with regards to age and educational level. All participants were right- handed and had no history of any hearing problem. In-formed consent was obtained from all subjects.
2.2. Experimental Setup and Measurement Procedure
The two experiments were in fact the same as far as the evaluation method is concerned. The subjects were evaluated with the digit span Wechsler Auditory test [17]. A warning stimulus of either high (3000 Hz) or low fre-quency (500 Hz) was presented through earphones to the subjects, who were asked to memorize the numbers that followed. The warning stimulus lasted 100 msec. A one second interval followed the onset of the warning stimulus and then the numbers to be memorized were presented by a male voice. At the end of the number sequence presentation, the same signal tone was repeated. The signals were recorded for a 1500 msec interval, divided into 500 msec before the warning stimulus (EEG) and 1000 msec after that (ERP) [3]. The numbers were recalled by the subject in the same (low frequency tone) or in the opposite order (high frequency tone) than that presented to the participant.
The total task consisted of 52 repetitions for a period of about 45 min. The subjects performed the tasks twice, with and without radiation, with an interval of two weeks between the measurements. The order in which the subject was exposed at the EMF (exposure at the first or second visit) was random and the subjects were unaware of the experimental condition.
The only difference between the two experiments was the frequency of the EMF signal at which the subjects were exposed. The first experiment involved an antenna emitting 900 MHz electromagnetic field, with mean power at 64 mWatt, while in the second one the antenna
used emitted 1800 MHz electromagnetic field, with mean power at 128 mWatt. In both experiments the sig-nal was not modulated.
The experimental setup was the same in both cases and included a Faraday room, which screened any elec- tromagnetic interference that could affect the measure- ments. The subjects sat in an anatomical chair and a cer- tified dipole antenna was fixed near their right ear. Care was taken so that the distance between telephone and ear (about 20 cm) was constant during the whole session. The antenna was driven by a signal generator, which could be switched on or off.
The electrophysiological signals were recorded with Ag/AgCl electrodes. Electrode resistance was kept con- stantly below 5 kΩ. EEG activity was recorded from 15 scalp electrodes (Fp1, F3, C5, C3, Fp2, F4, C6, C4, O1, O2, P4, P3, Pz, Cz, Fz) based on the International 10-20 system of Electroencephalography [18], referred to both earlobes. An electrode placed on the subject’s forehead served as ground. The bandwidth of the amplifiers was set at 0.05 Hz to 35 Hz. During the administration of stimuli, the subjects had their eyes closed in order to minimize eye movements and blinks. Eye movements were recorded through electro-oculogram (EOG) and recordings with EEG higher than 75 μV were rejected which on the average were 2.1 ± 1.4 trials from the total of 52. Warning stimuli, as well as the numbers to recall were presented binaurally via earphones at an intensity of 65dB sound pressure level. The earphones did not have metal components in order to avoid EMF concen- tration.The evoked biopotential signal was submitted to an analogue-to-digital conversion, at a sampling rate of 1 KHz.
2.3. Data Transformation
For each question 1500 data points, each corresponding to time segments of 1 msec duration for each electrode were saved. In order to maximize the signal to noise ratio for each subject and each channel all values were average referenced on the basis of the grand average across the 52 repetitions of the EEG values. This proce- dure was done separately for each EMF condition in both experiments. Artifact–contaminated epochs with a signal deviation of > 75 μV in the EEG or 100 μV in the EOG were excluded. The final data for analysis for each subject and condition consists of 1500 amplitude values for each electrode, expressed in μVolts corresponding to the 1500 msec of the time period [3].
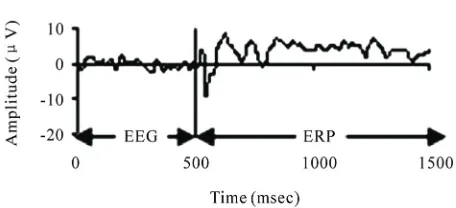
A representative chart of the primary recordings of the amplitude values are shown in Figure 1.
2.4. Stationarity and Integration
Figure 1. Representative graph of the 1500 amplitude values of the electrode Fz.
ance
var
xt
remain constant over time. Stationarytime series are easier to analyze and forecast, therefore non-stationary raw data are often transformed, in order to become stationary. Non-stationary processes contain a trend. Trend represents a general systematic linear or non-linear component that changes over time and does not repeat, or at least does not repeat within the time range captured by the data. There are two kinds of trend; deterministic and stochastic. Time series with determi- nistic trend have constant variance but non-constant mean, whereas the ones with stochastic trend exhibit non-constant variance. Some processes may contain both stochastic and deterministic trends, which means that
they combine a random walk and a deterministic
trend
rt
t , plus an error term.t t
x r tt
A non-stationary process with deterministic trend is transformed into a stationary one by regressing it on time t. The most common method for removing stochas- tic trends from a non-stationary process is differencing. Differencing of a time series xt in discrete time t is the transformation of the series xt to a new time series
where the values are the differences between consecutive values of t
t
dif dift
x . The dth fferences of a time
series are described by the following expression: di
t
t
( ) ( 1) ( 1) 1
d d d
t t
dif dif dif
,
where the top index d means the order of the difference. Many time series need to be differenced more than once in order to achieve stationarity. From this comes the definition of integration: a time series is said to be integrated of order d, in short, I(d), if it becomes station- ary after differencing d times. A series which is I(d) is also said to have d unit roots.
2.5. Testing for Stationarity: KPSS Test The KPSS test [20] is commonly used to test for station- narity in time-series data. Let {xt}, t = 1, 2, …, N, be the observed series for which we wish to test stationarity. Assume that the series can be decomposed into the sum
of a deterministic trend, a random walk, and a stationary error with the following linear regression model
t t
x r t
where rt is a random walk, i.e., rt = rt-1 + ut and ut is independent identically distributed (iid) N(0, σu2), βt is a deterministic trend and εt is a stationary error.
To test in this model if xt is a stationary process, the null hypothesis will be σu2 = 0, which means that the intercept is a fixed element, against the alternative of a positive σu2.Under the null hypothesis, in the case of stationarity, the residuals et (t = 1, 2, …, N) are from the regression of x on an intercept and time trend, et = εt. Let the partial sum process of the et be
1 t
t j j
S
e ,and 2 be the long-run variance of e
t, which is defined as
2 lim 1 N
N E S
2 .
The consistent estimator of 2 can be constructed
from the residuals et by the equation below [19]
2 2
1 1 1
1 2
ˆ ( ) ( )
p
N N
t j
t j t j
p e w p e
N N
t t je
,where p is the truncation lag, wj( p) is an optional weighting function that corresponds to the choice of a special window, e.g., Bartlett window (Bartlett, 1950) wj( p) = 1 – j/(p+1).
Then the KPSS test statistic is given by
2 2 2
1
ˆ ( ) N
t t
KPSS N S p
.Under the null hypothesis of stationarity,
1 2 2 0 ( )
KPSS
V r dr,where V2(r) is the second level Brownian bridge, given
by
V2(r) = 2 2 1 .
0
( ) (2 3 ) (1) ( 6 6 ) ( )
B r r r B r r
B s ds The upper tail critical values of the asymptotic distr- ibution of the KPSS statistic are given by Kwiatkowski et al. [20]. It has been shown that KPSS test is the most powerful test for the stationarity of time series [20,21], therefore it will used in the present paper.Further details of the test are given in Zivot and Wang (2002).
2.6. Cointegration
t
“spurious regressions”.
In order to overcome this limitation, Granger intro-duced a new method, based on the notion that a linear combination between a pair of non-stationary integrated series can be stationary. This property is known as coin-tegration [14]. Coincoin-tegration is a formulation of the phenomenon that non-stationary integrated series can have linear combinations that have a lower degree of integration than the original series.
In this paper, the tool used for testing the co-variability of different electrodes is cointegration. The method of cointegration involves testing whether the residuals from a cointegrating regression are stationary. Consider two time series y1t and y2t which are both I(d). In general, any linear combination of y1t and y2t will be also I(d). However, if there exists a vector (1, –β)', such that the linear combination
1 2
t t
z y a y
is I(d – b), d b 0,then, following Engle and Granger (1987), y1t and y2t are defined as cointegrated of order (d, b) denoted yt = (y1t, y2t)' ~ CI(d, b), with (1, –β)' called the cointegrating vector [23].
2.7. Data Processing
In this study, the ERP signals are being analyzed in terms of cointegration. More precisely, the stationarity of the ERPs of each electrode, for all the subjects, is being examined using the KPSS test. If the ERPs are found to be non-stationary (which is the case), they are properly differenced. This procedure is repeated until KPSS test indicates stationarity. In order to achieve stationarity the signals were differenced twice or three times. The null hypothesis of stationarity with upper tail critical value of the asymptotic distribution of the KPSS statistic 0.119 is tested.
Cointegration is tested for those electrodes that are integrated of the same order. The two ERPs are being regressed one against the other and the order of integra- tion or stationarity of the residuals is tested. If the order of integration of the residuals is less than that of the two ERP signals then cointegration exists between the two variables. A 15 × 15 array is created for each subject in each condition and if cointegration exists between elec- trode i and electrode j—provided that the two electrodes are integrated of the same order—a 1 is placed at the [i, j] cell. Else, if no such relationship exists, a 0 is placed in the cell. For each electrode, the respective column is summed, and the result is a 1 × 15 vector, containing the exact number of cointegrations for each electrode for the specific subject. This number is subsequently normal- ized by dividing by the maximum number of possible cointegrations (in this case 14). This number is called Cointegration Factor (CF) of the electrodes. According to the above, the values of the electrode CF can range from 0 to 1. In the same way, the mean value of elec- trode CFs is the Aggregate Cointegration Factor (ACF).
3. STATISTICAL ANALYSIS
The aggregate CF was subjected to two-way ANOVA with gender (male, female) and EMF condition (none, 900 MHz, 1800 MHz) as the independent factors. Like- wise the CFs at the fifteen electrodes were subjected to MANOVA with the same independent factors. Finally, in order to examine whether the CF differs among different electrodes (locations), an ANOVA procedure with repeated measures was performed for all the subjects and meas- urements. The statistical significance was set at 0.05.
4. RESULTS
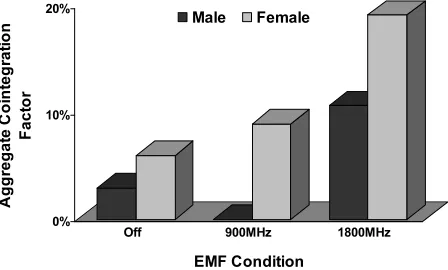
Univariate analysis of variance with ACF as the dependent variable and EMF condition (off, 900 MHz, 1800 MHz), gender (male, female) and their interaction as the inde- pendent factors revealed a significant EMF effect (F2,77 =
4, p = 0.022) as well as a significant gender effect (F1,77
= 4, p = 0.048), but no interaction effect. Figure 2 helps to clarify the direction of the differences between EMF conditions and genders. As post-hoc comparisons with Bonferroni corrections show, women have in general a significantly higher ACF than men (p = 0.048). The presence of radiation increases ACF. As a result ACF in the presence of 1800 MHz is significantly higher than in the absence of radiation (p = 0.029).
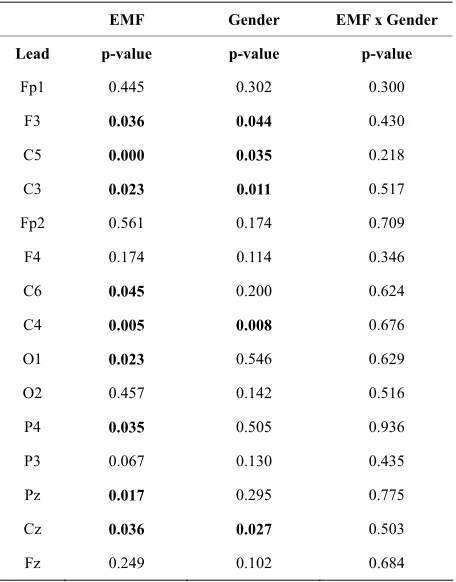
In order to further qualify the effect of EMF and gender on CF for each electrode individually, the CFs of the 15 electrodes were subjected to MANOVA with EMF con- dition (off, 900 MHz, 1800 MHz), gender (male, female) and their interaction as independent factors. Table 1
shows the significance of their effects on the CF for all the electrodes. Significant effects are shown in bold. Once again the variability of the CF of the leads is mostly due to the effect of EMF conditions and to a lesser degree of gender differences, while the EMF x Gender interaction does not have any significant effect. These effects were more obvious at F3, C5, C3, C6, C4, O1, P4, Pz and Cz.
0% 10% 20%
A
ggr
e
ga
te
C
oi
nt
e
gr
a
ti
on
F
act
o
r
Off 900MHz 1800MHz
EMF Condition
[image:4.595.312.536.558.693.2]Male Female
Table 1. Significance of the effects of EMF condition and gender on the cointegration factor of the electrodes.
EMF Gender EMF x Gender
Lead p-value p-value p-value
Fp1 0.445 0.302 0.300
F3 0.036 0.044 0.430
C5 0.000 0.035 0.218
C3 0.023 0.011 0.517
Fp2 0.561 0.174 0.709
F4 0.174 0.114 0.346
C6 0.045 0.200 0.624
C4 0.005 0.008 0.676
O1 0.023 0.546 0.629
O2 0.457 0.142 0.516
P4 0.035 0.505 0.936
P3 0.067 0.130 0.435
Pz 0.017 0.295 0.775
Cz 0.036 0.027 0.503
Fz 0.249 0.102 0.684
The repeated ANOVA procedure with the CFs at the fifteen electrodes as the within subjects factor proved that there exist significant differences between the means of the CFs at different locations (F14,77 = 3.7, p < 0.001).
As Figure 3 shows high CFs seem to cluster in the central and lateral electrodes, while electrodes with low CFs are grouped mainly in the posterior but also the an- terior electrodes.
5. DISCUSSION
As Granger notes, “cointegration signifies co-movements among trending variables which can be exploited to test for the existence of equilibrium relationships within a fully dynamic specification framework” [23]. In the present study, the cointegration factor was defined as the ability of ERP signals to co-vary in time. Results showed that the values of the CFs seem to follow specific pat- terns forming distinct clusters, which discriminate the central and lateral electrodes, having relatively high CFs, from the anterior and posterior ones. Furthermore, women have a significantly higher CF than men, while all subjects have increased CFs in the presence of EMF.
The above findings seem to be in congruence with other findings regarding typical characteristics of the ERP signal. Specifically, with regards to EMF effects, EEG studies showed an increase of spectral power in the
Figure 3. Mean values of the cointegration factors at different locations on the scalp. Red area signifies cointegration factors greater than 7.5%, while the blue areas contain electrodes with cointegration factors less than 7.5%.
alpha band [2,24,25], while ERP studies have demon- strated reduced N100 amplitudes, shortened N100 laten- cies and prolonged P300 latencies [26]. In this context, it has been shown that EMF modulated the event-related desynchronization/synchronization (ERD/ERS) responses in the approximately 4-8 Hz EEG frequencies [27]. In view of these collected observations the authors con- cluded that EMF could influence brain activity through thermal and non-thermal mechanisms [28,29].
However, a number of studies failed to find EMF effects upon brain physiology [30,31]. This might be attributed to the fact that these studies focused not on the whole ERP recording, but on certain components of ERP. In contrast, the present study analyzed the total ERP signal, specifically its cointegration capacity, which is likely to represent a more valid picture of the effect of EMF exposure on the ERP.
The gender-related differences of CF may be related to different strategies activated due to sex-related func- tional brain organization, as indicated from psychophy- siological and neurobiological studies [32-35]. There also appears to be consistent evidence that EEG coher- ence varies systematically with gender [36].
Finally, the auditory nature of the warning stimuli that elicit the ERPs might be the possible reason that affects the ERP activity in the temporo-parietal region [37,38] creating the distinct clusters of CF presently found.
[image:5.595.58.286.105.396.2]tions between different brain locations. Also, the method can be applied on EEG data, obtained from different clinical and technical experimental conditions. Finally, it is our immediate object to demonstrate the feasibility of the cointegration method on additional cogntive tasks that involves activities in the frontal and occipital scalp locations, using data from ongoing experiments.
6. ACKNOWLEDGEMENTS
The authors would like to thank M. Kyprianou, Scientific Investigator, Athens, Greece, for his support on the statistical analysis of the experi- mental results.
REFERENCES
[1] Fabiani, M., Gratton, G. and Coles, M. (2000) Event- related potentials: Methods, theory and applications.
Handbook of Psychophysiology, 3rd Edition. Cambridge University Press, New York.
[2] Laufs, H., Kleinschmidt, A., Beyerle, A., Eger, E., Salek- Haddadi, A., Preibisch, C. and Krakow, K. (2003) EEG- correlated fMRI of human alpha activity. NeuroImage, 19(4), 1463-1476.
[3] Papageorgiou, C.C., Nanou, E.D., Tsiafakis, V.G., Cap- salis, C.N. and Rabavilas, A.D. (2004) Gender related differences on the EEG during a simulated mobile Phone signal. Neuroreport, 15(16), 2557-2560.
[4] Agam, Y. and Sekuler, R. (2007) Interactions between working memory and visual perception: An ERP/EEG study. NeuroImage, 36(3), 933-942.
[5] Edwards, E., Soltani, M., Deouell, L.Y., Berger, M.S. and Knight, R.T. (2005) High gamma activity in response to deviant auditory stimuli recorded directly from human cortex. Journal of Neurophysiology, 94, 4269-4280. [6] Yordanova, J., Rosso, O.A. and Kolev, V. (2003) A tran-
sient dominance of theta event-related brain potential component characterizes stimulus processing in an audi-tory oddball task. ClinicalNeurophysiology, 114(3), 529- 540.
[7] Quiroga, R.Q., Sakowitz, O.W., Basar, E. and Schürmann, M. (2001) Wavelet Transform in the analysis of the fre-quency composition of evoked potentials. Brain Re-search Protocols, 8(1), 16-24.
[8] Chlubnová, J., Kremláček, J., Kubová, Z. and Kuba, M. (2005) Visual evoked potentials and event related poten-tials in congenitally deaf subjects. Physiological Re-search, 54, 577-583.
[9] Sanders, L.D., Newport, E.L. and Neville, H.J. (2002) Segmenting nonsense: An event-related potential index of perceived onsets in continuous speech. Nature Neuro-science, 5, 700-703.
[10] Shibata, T., Shimoyama, I., Ito, T., Abla, D., Iwasa, H., Koseki, K., Yamanouchi, N., Sato, T. and Nakajima, Y. (1998) The synchronization between brain areas under motor inhibition process in humans estimated by event- related EEG coherence. Neuroscience Research, 31(4), 265-271.
[11] Hauk, O., Davis, M.H., Ford, M., Pulvermüller, F. and Marslen-Wilson, W.D. (2006) The time course of visual
word recognition as revealed by linear regression analy-sis of ERP data. NeuroImage, 30(4), 1383-1400.
[12] Nikolaev, A.R., Ivanitsky, G.A., Ivanitsky, A.M., Posner, M.I. and Abdullaev, Y.G. (2001) Correlation of brain rhythms between frontal and left temporal (Wernicke’s) cortical areas during verbal thinking. Neuroscience Let-ters, 298(2), 107-110.
[13] Oya, H., Poon, P.W.F., Brugge, J.F., Reale, R.A., Kawa-saki, H., Volkov, I.O. and Howard III, M.A. (2007) Func-tional connections between auditory cortical fields in humans revealed by Granger causality analysis of in-tra-cranial evoked potentials to sounds: Comparison of two methods. Biosystems, 89, 198-207.
[14] Engle, R. and Granger, C.W. (1987) Co-integration and error correction representation estimation and testing.
Econometrica, 55(2), 251-276.
[15] Yang, K. and Shahabi, C. (2005) On the stationarity of multivariate time series for correlation-based data analy-sis. Proceedings of the Fifth IEEE International Confer-ence on Data Mining, 805-808.
[16] Brandt, M.E., Ademoglu, A. and Pritchard, W.S. (2000) Non-linear prediction and complexity of alpha EEG ac-tivity. International Journal of Bifurcation and Chaos, 10(1), 123-133.
[17] Wechsler, D. (1955) Manual for the Wechsler adult intel-ligence scale. Psychological Corporation, New York. [18] Jasper, H.H. (1958) The ten-twenty electrode system of
the international federation. Electroencephalography and Clinical Neurophysiology, 10, 371-375.
[19] Newey, W.K. and West, K.D. (1987) A simple, positive semi-definite, heteroskedasticity and autocorrelation con- sistent covariance matrix. Econometrica, 55(3), 703-708. [20] Kwiatkowski, D., Phillips, P.C.B., Schmidt, P. and Shin,
Y. (1991) Testing the null hypothesis of stationarity against the alternative of a unit root. How sure are we that economic time series have a unit root? Journal of econometrics, 54, 158-178.
[21] Hobijn, B., Franses, P.H. and Ooms, M. (2004) Gener- alizations of the KPSS-test for stationarity. Statistica Neerlandica, 58(4), 483-502.
[22] Granger, C.W. and Newbold, P. (1974) Spurious regres- sion in econometrics. Journal of Econometrics, 2(2), 111- 120.
[23] Dolado, J.J., Gonzalo, J. and Marmol, F. (2009) A Com-panion to Theoretical Econometrics, In: Baltagi, B.H., Ed., Blackwell Reference Online, 634-654
http://www.blackwellreference.com/public/book?id=g97 81405106764_9781405106764
[24] Croft, R.J., Chandler, J.S., Burgess, A.P., Barry, R.J., Williams, J.D. and Clarke, A.R. (2002) Acute Mobile phone operation affects neural function in humans.
Clinical Neurophysiology, 113(10), 1623-1632.
[25] Curcio, G., Ferrara, M., Moroni, F., D'Inzeo, G., Bertini, M. and De Gennaro, L. (2005) Is the brain influenced by a phone call? An EEG study of resting wakefulness.
Neuroscience Research, 53(3), 265-270.
[26] Hamblin, D.L., Wood, A.W., Croft, R.J. and Stough, C. (2004) Examining the effects of electromagnetic fields emitted by GSM mobile phones on human event-related potentials and performance during an auditory task.
Clinical Neurophysiology, 115(1), 171-178.
Liesivuori, T., Koivisto, M., Revonsuo, A., Laine, M. and Hämäläinen, H. (2006) Mobile phone effects on chil-dren's event-related oscillatory EEG during an auditory memory task. International Journal of Radiation Biology, 82(6), 443-450.
[28] Challis, L.J. (2005) Mechanisms for interaction between RF fields and biological tissue. Bioelectromagnetics, Supplement 7 Review, 26, 98-106.
[29] Valentini, E., Curcio, G., Moroni, F., Ferrara, M., De Gennaro, L. and Bertini, M. (2007) Neurophysiological effects of mobile phone electromagnetic fields on hu-mans: A comprehensive review. Bioelectromagnetics, 28, 415-432.
[30] Hamblin, D.L., Croft, R.J., Wood, A.W., Stough, C. and Spong, J. (2006) The sensitivity of human event-related potentials and reaction time to mobile phone emitted electromagnetic fields. Bioelectromagnetics,27, 265-273. [31] Yuasa, K., Arai, N., Okabe, S., Tarusawa, Y., Nojima, T.,
Hanajima, R., Terao, Y. and Ugawa, Y., (2006) Effects of thirty minutes mobile phone use on the human sensory cortex. ClinicalNeurophysiology, 117(4), 900-905. [32] Skrandies, W., Reik, P. and Kunze, C. (1999) Topography
of evoked brain activity during mentalarithmetic and language tasks: sex differences. Neuropsychologia, 37(4), 421-430.
[33] Briere, M.E., Forest, G., Chouinard, S. and Godbout, R.
(2003) Evening and morning EEG differences between young men and women adults. Brain and Cognition, 53(2), 145-148.
[34] Dimpfel, W., Wedekind, W. and Keplinger, I. (2003) Gender difference in electrical brain activity during presentation of various film excerpts with different emo-tional content. European Journal of Medical Research, 8(5), 192-198.
[35] Razumnikova, O.M. and Vol'f, N.V. (2007) Gender dif-ferences in interhemisphere interactions during distrib-uted and directed attention. Neuroscience and Behavioral Physiology, 37(5), 429-434.
[36] Barry, R.J., Clarke, A.R., McCarthy, R., Selikowitz, M., Johnstone, S.J. and Rushby, J.A. (2004) Age and effects in EEG coherence: I. Developmental trends in normal children. ClinicalNeurophysiology, 115(10), 2252-2258. [37] Haarala, C., Aalto, S., Hautzel, H., Julkunen, L., Rinne,
J.O., Laine, M., Krause, B. and Hämäläinen, H. (2003) Effects of a 902 MHz mobile phone on cerebral blood flow in humans: a PET study. Neuroreport,14(16), 2019- 2023.