Towards the development of a simulator for investigating the impact of people management practices on retail performance
P O Siebers1, U Aickelin1, H Celia2, C W Clegg2
1
University of Nottingham, Nottingham, UK
2
University of Leeds, Leeds, UK
Correspondence: P O Siebers, IMA Research Group, School of Computer Science, University of Nottingham, Nottingham, NG8 1BB, UK. E-mail: pos@cs.nott.ac.uk
ABSTRACT
Models to understand the impact of management practices on retail performance are often simplistic and assume low levels of noise and linearity. Of course, in real-life, retail operations are dynamic, non-linear and complex. To overcome these limitations, we investigate discrete-event and agent-based modelling and simulation approaches. The joint application of both approaches allows us to develop simulation models that are heterogeneous and more life-like, though poses a new research question: When developing such simulation models one still has to abstract from the real world, however, ideally in such a way that the ‘essence’ of the system is still captured. The question is how much detail is needed to capture this essence, as simulation models can be developed at different levels of abstraction. In the literature the appropriate level of abstraction for a particular case study is often more of an art than a science. In this paper, we aim to study this question more systematically by using a retail branch simulation model to investigate which level of model accuracy obtains meaningful results for practitioners. Our results show the effects of adding different levels of detail and we conclude that this type of study is very valuable to gain insight into what is really important in a model.
KEYWORDS
INTRODUCTION
The retail sector has been identified as one of the biggest contributors to the productivity gap that persists between the UK and other countries, in particular France, Germany and the USA (Reynolds et al, 2005). UK retail productivity measures paint a worrying picture, describing lower levels of efficiency than what we would expect (Department of Trade and Industry, 2003), and in particular lower than the benchmark countries already stated. Researchers have so far failed to explain fully the reasons accounting for the productivity gap, and management practices provide a valid and thoughtful way of looking at the problem. The analysis of management practices across different contexts has attempted to explain differences in organisational productivity and performance (for a review see Wall and Wood, 2005).
A recent report on UK productivity asserted that “... the key to productivity remains what happens inside the firm and this is something of a ‘black box’…” (Delbridge et al, 2006). Siebers and colleagues conducted a comprehensive literature review of this research area to assess linkages between management practices and organisational productivity (Siebers et al, 2008). The authors concluded that management practices are multidimensional constructs that generally do not demonstrate a straightforward relationship with productivity variables. Empirical evidence affirms that both management practices and productivity measures must be context specific to be effective. Management practices need to be tailored to the particular organisation and the working environment, whereas productivity indices must also reflect a particular organisation’s activities on a local level to be a valid indicator of performance.
particular Agent-Based Simulation (ABS) with its object oriented world view and its autonomous, interacting, and goal directed entities seems to be well suited to the investigation of people centric complex adaptive systems, of which a retail department is an example.
There has been a lot of modelling and simulation of operational management practices, but people management practices, for example training (upgrading employees’ skills and knowledge), empowerment (increasing employees’ autonomy) and teamwork (group is given extensive responsibility), have often been neglected. This seems a fertile area for research as recent findings suggest that people management practices significantly impact on a business’ productivity (Birdi et al, 2008). One reason for the paucity of modelling and simulation of people management practices relates to their key component, an organisation’s people, who are often unpredictable in their individual behaviour.
Our overall project aim is to investigate if we can understand the relationship between people management practices and retail performance better by employing simulation as the technology for evaluating different strategies, considering that the system of interest is dynamic, non-linear and complex. To our knowledge it the first attempt to apply simulation to investigate the managerial implications of people management practices. We have formed a multi-disciplinary research team consisting of computer scientists that were responsible for the modelling and simulation and work psychologists to inform the model building and for the analysis of results. In pursuit of this aim, in this paper we focus on the following research question: What level of abstraction should we use for our simulation model?
obtained knowledge and the data, we have developed conceptual models of the real system and the individuals within the system and implemented these in a simulation model.
The simulation model has been developed in two major steps. First, we have focused on putting together a functional representation of the real system using a mixed process oriented Discrete Event Modelling (DEM) and individual oriented Agent-Based Modelling (ABM) approach and we have tested if such an approach is of use for investigating the impact of people management practices on productivity and customer satisfaction. After having successfully tested this novel approach (Siebers et al, 2009) in this paper we are focusing on investigating the level of model accuracy required to obtain some meaningful results for practitioners. For this purpose, we have added some more details to the model (in form of additional algorithms and empirical data) and tested the sensitivity of the simulation model towards these additions. We have also compared the system performance predicted by the simulation model (without using any form of calibration) to the system performance measured in the real system, in order to assess the predictive capabilities (qualitative or quantitative) of our simulation model in its current form.
The investigations described in this paper help practitioners to decide how to best coordinate time and effort when having limited resources for conducting similar simulation studies.
In Section 2 we give an overview of the relevant literature, looking at the different modelling approaches used in OR and at previous attempts to model people centric systems in an OR context. Section 3 describes the model design and its implementation. Section 4 presents two experiments we have conducted to validate the final simulation model and to test the sensitivity of the model output towards some of the features we have added in the second development step of our simulation model. Section 5 concludes the paper with a summary and an outlook of further developments.
refer to the process of designing a model and conducting experiments with this model for the purpose of understanding the behaviour of the system and/or evaluating various strategies for the operation of the system (Shannon, 1975).
BACKGROUND
OR is applied to problems concerning the conduct and co-ordination of the operations within an organisation (Hillier and Lieberman, 2005). An OR study usually involves the development of a scientific model that attempts to abstract the essence of the real problem. When investigating the behaviour of complex systems the choice of an appropriate modelling technique is very important. To inform the choice of an appropriate modelling technique our multi-disciplinary research team has reviewed relevant literature from the fields of Economics, Social Sciences, Psychology, Retail Management, Supply Chain Management, Manufacturing, Marketing, OR, Artificial Intelligence, and Computer Science.
MODELLING APPROACHES
Within the fields listed above a wide variety of approaches have been used which can be broadly classified into three categories: analytical approaches, heuristic approaches and simulation. Often we found that combinations of these were used within a single model (e.g. Schwaiger and Stahmer, 2003; Greasley, 2005).
No relevant purely heuristic models were found during the literature review. This does not come as a surprise as pure heuristic models are more frequently used in system optimisation, i.e. not the focus of our current research.
Simulation modelling introduces the possibility of a new way of thinking about social and economic processes based on ideas about the emergence of complex behaviour from relatively simple activities (Simon, 1996). It allows clarification of a theory and investigation of its implications. OR usually employs three different types of simulation to help understand the behaviour of organisational systems, each of which has its distinct application area: System Dynamics (SD), Discrete Event Simulation (DES) and ABS.
SD takes a top down approach by modelling system changes over time. The analyst has to identify the key state variables that define the behaviour of the system and these are then related to each other through coupled, differential equations. SD is applied where individuals within the system do not have to be highly differentiated and knowledge on the aggregate level is available, for example modelling population, ecological and economic systems.
DES uses a process centric world view, i.e. the focus is on the process flow. The system is modelled as a set of entities (passive objects) that are processed and evolve over time according to the availability of resources and the triggering of events (Law and Kelton, 1991). The simulation model maintains an ordered queue of events. DES is commonly used as a decision support tool in the manufacturing and service industries.
refers to the fact that they act independently and are not guided by some central control authority or process. (Bakken, 2007). In addition, agents are capable of behaving proactively, i.e. initiating changes rather than just reacting to events.
ABS is suited to a system driven by interactions between its constituent entities, and can reveal what appears to be complex emergent behaviour at the system level even when the agents involved exhibit fairly simple behaviours on a micro-level. Some typical application domains for ABS are ecology, traffic and transportation, sociology, economic system analysis, and gaming. Out of the simulation approaches reviewed ABS seems to be the most suitable one for our purpose due to it autonomous entity focus.
COMPARING APPROACHES
Most methods to study managerial implications can only be applied as analytical tools once management practices have been implemented, however they are not very useful at revealing system-level effects prior to the introduction of specific management practices. Simulation is a what-if analysis tool that allows someone to study different management practices scenarios prior to their implementation without interrupting the operation of the real system. Furthermore, often analytical models are developed under the assumption of stability, equilibrium and linearity. However, retail operations are considered in reality to be dynamic, non-linear and complex. Simulation allows developing models of non-equilibrium systems at any level of complexity.
While analytical models typically aim to explain correlations between variables measured at a single point in time, simulation models are concerned with the development of a system over time (Law and Kelton, 1991). Therefore, simulation provides an insight into system dynamics rather than just predicting the output of a system based on specific inputs. In addition, it allows visualising the changes of key variables over time, which provides useful information about the dynamic behaviour of the system.
of real systems arise from the characteristics of individuals and their environment. It allows modelling a highly diverse population where each agent can have personal motivations and incentives, and to represent groups and group interactions. Furthermore, human behaviour is often quite irrational. For example, fleeing a fire people will often try to retrace their steps and leave the building by the way they came in, rather than heading for the nearest exit - even if it is much closer. While other simulation modelling techniques do not facilitate the consideration of such concepts ABS modelling allows representing irrational behaviour. Another advantage of ABS is that building an ABS model is a very intuitive process as actors in the real system can be directly modelled as agents in the simulation model. This also supports the micro validation (i.e. the validation of the agent templates) of the simulation model as it is easy for an expert in the real system (who is not an expert in ABS) to quickly take on board the model conceptualisation and provide useful validation of the model component structures and content.
be clear with clients about what this modelling technique can really offer in order to guide realistic expectations.
In conclusion, we can say that simulation, and in particular ABS, offers a fresh opportunity to realistically and validly model organisational characters and their interactions, which in turn can facilitate a meaningful investigation of management practices and their impact on system outcomes.
RELATED RESEARCH
We have found that most of the work relevant to our investigations focuses on marketing and consumer behaviour rather then on management practices. For example, Said et al (2002) have created an ABS composed of a virtual consumer population to study the effects of marketing strategies in a competing market context. A similar approach has been used by Baxter et al (2003) who have developed an intelligent customer relationship management tool using ABS that considers the communication of customer experiences between members of a social network, incorporating the powerful influence of word of mouth on the adoption of products and services. A very different facet of consumer behaviour is presented by Kitazawa and Batty (2004) who investigate the spatial movements of shoppers in a large shopping centre, using a combination of ABM and genetic algorithms. There are many more examples where ABM has been employed to study consumer behaviours (e.g. Cao, 1999; Csik, 2003; Jager et al, 2000; Baydar, 2003) or entire consumer market behaviours (e.g. Vriend, 1995; Twomey and Cadman, 2002; Said and Bouron, 2001; Koritarov, 2004; Janssen and Jager, 2001; Schenk et al, 2007).
Finally, it is worthwhile mentioning that we have found one of-the-shelf software, ShopSim (http://www.savannah-simulations.com/ accessed 30/07/2009), which is a decision support tool for retail and shopping centre management. It evaluates the shop mix attractiveness and pedestrian friendliness of a shopping centre. The software uses an agent-based approach, where the behaviour of agents depends on poll data. However, rather than looking at people management practices and their impact on customer satisfaction it focuses on spatial issues.
OUR CHOICE
When modelling people management practices in OR one is mainly interested in the relations between staff and customers but it is equally important to consider parts of the operational structure of the system in order to enable a realistic evaluation of system performance and customer satisfaction. Therefore, we have decided to use a mixed DEM and ABM approach for our simulation model. A queuing system will be used to model the operational structure of the system while the people within the system will be modelled as autonomous entities (agents) in order to account for the stochasticity caused by human decision making. This will also allow us to consider the long term effects of service quality on the decision making processes of customers, both important components when designing a tool for studying people centric systems. The application of a mixed DEM and ABM approach has been proven to be quite successful in areas like manufacturing and supply chain modelling (e.g. Parunak et al, 1998; Darley et al, 2004) as well as in the area of modelling crowd movement (e.g. Dubiel and Tsimhoni, 2005).
MODEL
When modelling people inside a system it is important to consider that there are differences in the way ABM is applied in different research fields regarding their empirical embeddednes. Boero and Squazzoni (2005) distinguish between three different levels, amongst others characterised by the level of empirical data used for input modelling and model validation: case-based models (for studying specific circumscribed empirical phenomena), typifications (for studying specific classes of empirical phenomena) and theoretical abstractions (pure theoretical models). While case based models use empirical data for input modelling as well as model validation theoretical abstractions use no empirical data at all. Social Science simulation applications tend to be more oriented towards the bottom end of this scale (theoretical abstractions) OR applications are usually located at the top end (case based). This implies that there is also a difference in knowledge representation and in the outcome that the researcher is interested in. In Social Sciences it is common to model the decision making process itself (e.g. Rao and Georgeff, 1995) and the focus of attention on the output side is on the emergence of patterns. On the other hand in OR applications the decision making process is often represented through probabilities or simple if-then decision rules collected from an existing real system (e.g. Schwaiger, 2007; Darley et al, 2004) and the focus on the output side is on system performance rather than on emergent phenomena. As we are studying a people centric service system, we have added some additional measures to assess how people perceive the services provided (e.g. customer satisfaction, frequency of visits based on previous experiences), besides the standard system performance measures (e.g. number of transactions, customer time in system, utilisation of staff).
answer the first research question and v2 for the simulation model developed to answer the second research question.
KNOWLEDGE GATHERING
Case studies were undertaken in four departments across two branches of a leading UK retailer. The case study work involved extensive data collection techniques, spanning: participant observation, semi-structured interviews with team members, management and personnel, completion of survey questionnaires on the effectiveness of retail management practices and the analysis of company data and reports. Research findings were consolidated and fed back (via report and presentation) to employees with extensive experience and knowledge of the four departments in order to validate our understanding and conclusions. This approach has enabled us to acquire a valid and reliable understanding of how the real system operates, revealing insights into the working of the system as well as the behaviour of and interactions between the different actors within it.
In order to make sure that our results regarding the application of management practices are applicable for a wide variety of departments, we have chosen two different types of case study departments which are substantially different not only in their way of operating but also their customer base and staffing setup. We collected our data in the Audio & Television (A&TV) and the WomensWear (WW) departments of the two case study branches.
The two departments can be characterised as follows:
• A&TV: average customer service times is much longer; average purchase is much more expensive; likelihood of customers seeking help is much higher; likelihood of customers making a purchase after receiving help is lower; conversion rate (likelihood of customers making a purchase) is lower; department tends to attract more solution demanders and service seekers (the terminology will be explained in Section 3.4.2)
likelihood of customers making a purchase after receiving is much higher; conversion rate is higher; department tends to attract shopping enthusiasts
CONCEPTUAL MODELLING
Based on the results of our assessment of alternative modelling techniques in the background section and from what we have learned from our case studies we have designed conceptual models of the system to be investigated and the actors within the system.
Concept for the simulation model
The initial idea for our ManPraSim and its components is shown in Figure 1. Regarding system inputs we use different types of agents (customers, sales staff and managers), each with a different set of relevant attributes. Furthermore, we define some global parameters that can influence any aspect of the system. The core of our simulation model is a dynamic system representation including a visualisation of system and agent states to allow monitoring the interactions of the agents as well as the system performance at runtime. The simulation model also includes a user interface, which enables some form of user interaction (change of parameters) before and during the runtime. On the output side, we might be able to observe some emergent behaviour on the macro level although this is not our primary objective. What we are mainly interested in are the standard system performances measures like transactions, staff utilisation and some measure of customer satisfaction. Furthermore, we want to use the simulation output to identify bottlenecks in the system and therefore assist with optimisation of the modelled system.
<Insert Figure 1 somewhere here>
Concepts for the agents
take on board the model conceptualisation and provide useful validation of the model component structures and content.
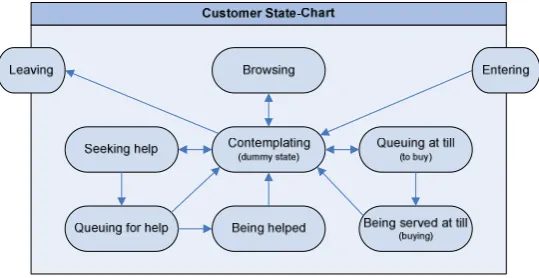
Designing and building a model is to some extent subjective, and the modeller has to selectively simplify and abstract from the real scenario to create a useful model (Shannon, 1975). A model is always a restricted copy of the real world, and an effective model consists of only the most important components of the real system. In our case, our case studies indicated that the key system components take the form of the behaviours of an actor and the triggers that initiate a change from one behavioural state to another. We have developed state charts for all of the agents in our retail department simulation model. Figure 2 shows as an example the conceptual model of a customer agent. Here the transition rules have been omitted to keep the chart comprehensible.
<Insert Figure 2 somewhere here>
An important remark about the order in which a customer is going through the different states within the customer state chart is that there is a logical order to events. Some of this order has been expressed with single- and double-headed arrows whereas others would have been difficult to express in the graph directly without losing the concept of the connecting contemplating state. For example, a customer would not be queuing at the till to buy something without having purchased an item. Therefore, the preceding event for a customer queuing at the till is to make a purchase, which in turn requires that the customer has been browsing to pick up an item to purchase. These rules have been considered later in the implementation (see Section 3.4.1 and Figure 3 for more details).
Concept for measure of service perception
particularly salient when customers and staff come face to face and therefore we consider this measure of quality in conjunction with others of quantity.
Historically customer satisfaction has been defined and measured in terms of customer satisfaction with a purchased product (Yi, 1990). The development of more sophisticated measures has moved on to incorporate customers’ evaluations of the overall relationship with the retail organisation, and a key part of this is the service interaction. Indeed, empirical evidence suggests that quality is more important for customer satisfaction than price or value-for-money (Fornell et al, 1996), and extensive anecdotal evidence indicates that customer-staff service interactions are an important determinant of quality as perceived by the customer.
Our customer satisfaction level index allows customer service satisfaction to be recorded throughout the simulated lifetime. The idea is that certain situations might have a bigger impact on customer satisfaction than others, and therefore weights can be assigned to events to account for this. Depending on type of service requested and level of service provided different results turn up. Applied in conjunction with an ABM approach, we expect to observe interactions with individual customer differences; variations which have been empirically linked to differences in customer satisfaction (e.g. Simon and Usunier, 2007). This helps the practitioner to find out to what extent customers underwent a positive or negative shopping experience and it allows the practitioner to put emphasis on different operational aspects and try out the impact of different strategies.
EMPIRICAL DATA
Our frequency distributions are modelled as triangular distributions supplying the time that an event lasts, using the minimum, mode and maximum duration. We have chosen triangular distributions here as we have only a relatively small sample of empirical data and a triangular distribution is commonly used as a first approximation for the real distribution (Kotz and van Dorp, 2004). The values for our triangular distributions are based on our own observation and expert estimates in the absence of numerical data. We have collected this information from the two branches and calculated an average value for each department type, creating one set of data for A&TV and one set for WW. Table 1 lists some sample frequency distributions that we have used for modelling the A&TV department (the values presented here are slightly amended to comply with confidentiality restrictions). The distributions are used as exit rules for most of the states. All remaining exit rules are based on queue development, i.e. the availability of staff.
<Insert Table 1 somewhere here>
The probability distributions are partly based on company data (e.g. conversion rates, i.e. the percentage of customers who buy something) and partly on informed guesses (e.g. patience of customers before they would leave a queue). As before, we have calculated average values for each department type. Some examples for probability distributions we used to model the A&TV department can be found in Table 2. The distributions make up most of the transition rules at the branches where decisions are made with what action to perceive (e.g. decision to seek help). The remaining decisions are based on the state of the environment (e.g. leaving the queue, if the queue does not get shorter quickly enough).
<Insert Table 2 somewhere here>
We have also gathered some company data about work team numbers and work team composition, varying opening hours and peak times, along with other operational and financial details (e.g. transaction numbers and values).
Our conceptual models have been implemented in AnyLogic™ v5.5. This is a Java™ based multi-paradigm simulation software (XJTEK, 2005) which supports the development of mixed DE and AB models. It allows replacing passive objects from the DE model with active objects (agents), which in our case represent the actors of the real world system.
As mentioned in Section 1, the simulation model has been developed in two major steps, each related to one of the research questions. In a first step, we have developed a relatively simple functional representation of the real system. In this simulation model the agents are largely homogeneous and without memory. Therefore, it is impossible to study the long term effects of people management practices on individual customer’s satisfaction. However, this simulation model turned out to be useful for studying certain aspects of branch operations and to carry out some experiments for investigating the impact of different people management practices on a strategic level. In a second step, we have added some more features to the simulation model. We have created a finite population of heterogeneous agents with memory and the capability to evolve over time and we have added more accuracy to our department representation by adding empirical footfall data, opening hours varying by day and a special customer egress procedure for the time when the store is closing. The simulation model has been validated and we have conducted a sensitivity analysis. In this section, we describe the functionality and features of the latest version of our simulation model, ManPraSim v2.
The main concept
<Insert Figure 3 somewhere here>
At the beginning of each simulation run, a customer pool is created which represents a population of potential customers who can visit the simulated department on an unspecified number of occasions. Once the simulation has started, customers are chosen at a specified rate (customer arrival rate) and released into the simulated department to shop. The customer agent template consists of three main blocks (help and pay) which use a very similar logic. In each block, in the first instance, customers try to obtain service directly from a staff member and if they cannot obtain it (i.e. no suitable staff member is available) they have to queue. They are then served as soon as the suitable staff member becomes available, or leave the queue if they do not want to wait any longer (an autonomous decision). Once customers have finished their shopping (either successfully or not) they leave the simulated department and are added back to the customer pool where they rest until they are picked the next time.
Special features
There are certain peak times where the pressure on staff members is higher, which puts them under higher work demands and results in different service times. There is a weekly demand cycle. For example on a Saturday, a lot more customers visit the branch compared to the average weekday. In ManPraSim v2 we have incorporated these real temporal fluctuations in customer arrival rates, across daily variations to opening hours. It includes the calculated hourly footfall values for each of the four case study departments for each hour of the day and each day of the week, based on sales transaction data that is automatically recorded by the company. Conversion rates are based on staff estimates and data from a leading UK retail database. The gaps between customer arrivals are based on exponential distributions, which account for further variation in weekly footfall.
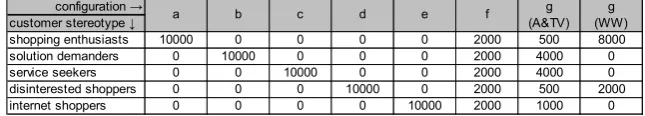
Internet. The first three customer types have been identified by the case study organisation as the customers who make the biggest contribution to their business, in terms of both value and frequency of sales. In order to avoid over-inflating the amount of sales that we model we have introduced two additional customer types, which use services but often do not make a purchase. The definition of each customer type is based on the customer’s likelihood to perform a certain action, classified as either: low, moderate, or high. The definitions can be found in Table 3.
<Insert Table 3 somewhere here>
A moderate likelihood is equivalent to an average probability value from Table 2. The low and high likelihood thresholds are logically derived on the basis of this value (i.e. a new mode is calculated if the customer type’s likelihood to execute a particular decision is not moderate). The same method is used for adapting an average delay value from Table 1.
A key aspect to consider is that the most interesting system outcomes evolve over time and many of the goals of the retail company (e.g., service standards) are planned strategically over the long-term. In ManPraSim v2, we have introduced a finite population where each agent is given a certain characteristic based on one out of five possible types mentioned above. Once agents are created, they are added to a customer pool. Each hour a certain amount of agents chosen at random from the agents in the customer pool are released into the department at an exponential rate based on the footfall value for that hour. When the agent has finished shopping, statistics are updated (amongst them the customer satisfaction index value) and the agent returns to the customer pool. A customer retains his or her customer satisfaction index throughout the runtime of the simulation.
period. Our previous customer satisfaction measures now collect some different information: satisfaction scores considering customers’ cumulative satisfaction history. These measures do not reflect individuals’ satisfaction with the current service experience but instead the satisfaction with the overall service experience during the lifetime of the agent. Furthermore, they are biased to some extent in that an indifferent rating quickly shifts into satisfaction or dissatisfaction (arguably, this is realistic, because most people like to make a judgement one way or the other). Whilst still a valuable piece of information we would also like to know how the current service is perceived by each customer. For this reason, we have introduced a set of new performance measures to record the experience of each customer’s individual visit. These are the same measures as before but they ignore the customer’s previous experiences.
Finally, we have added some transitions that allow the emulation of customers’ behaviour when the branch is closing. These are immediate exits of a state that are triggered when the shop is about to close. Not all states have these additional transitions because it is for example very unlikely that a customer leaves the branch immediately when he/she is already queuing to pay. Now the simulated department empties within a ten to fifteen minute period, which conforms to what we observed in the real system.
Testing the model
In order to test the operation of ManPraSim v2 and ascertain its face validity we conducted several preliminary experiments. It turned out that conducting the experiments with the data we collected during our case study did not provide us with a satisfactory match to the performance data of the real system. We identified the staffing setup used in the simulation model as the root cause of the problem.
type of work per staff member. For example, the A&TV staff rota indicates that only one dedicated cashier works on weekdays. When we have attempted to model this arrangement, customer queues have become extremely long, and the majority of customers ended up losing their patience and leaving the department prematurely with a high level of dissatisfaction. In the real system, we observed other staff members working flexibly to meet the customer demand, and if the queue of customers grew beyond a certain point then one or two would step in and open up further tills to take customers’ money before they became dissatisfied with waiting. Furthermore, we observed that a service staff member, when advising a customer, would often continue to close the sale (e.g. filling in guarantee forms and taking the money off the customer) rather than asking the customer to queue at the till and moving on to the next customer.
This means that currently our abstraction level is too high and we do not model the real system in an appropriate way. In our experiments we have modulated the staffing levels to allow us to observe the effects of changing key variables but we have tried to maintain the main characteristic differences between the departments (i.e. we still use more staff in the WW department compared to the A&TV department, only the amount has changed). We hope to be able to fix this problem in a later version of our simulation model. For now, we do not consider this a big problem as long as we are aware of it.
EXPERIMENTS
As mentioned earlier our simulation model has been developed in two major steps. After finishing the first step, we have conducted a set of experiments to investigate the usefulness of the developed simulation model for studying the impact of people management practices on productivity and customer satisfaction (Siebers et al, 2007a; 2007b). We investigated the following scenarios:
• Branch operation: (1) Varying the number of open tills and consequently the
• Empowerment: (1) Varying the extent to which a cashier can independently decide whether or not to make a customer refund. (2) Testing the impact of non-expert staff members choosing whether or not to stay with his or her customer when the customer requires advice from an expert. If they choose to stay, the original staff member can learn from the interaction.
• Training: Mimicking an evolutionary process, whereby normal staff members
can progressively develop their product knowledge over a period of time and at an agreed level of competence will be promoted to expert status.
With ManPraSimMod v2 we have conducted a validation experiment to test our customer pool implementation and we have conducted a sensitivity analysis to investigate the impact of our customer types on simulation output, i.e. we tested if adding customer types produces results that more closely approximate the real system behaviour and thus could provide useful insight to store managers. However, these specific experiments are not conducted to provide insight into the operations of the case study department. Instead, they are carried out to test the simulation model behaviour.
TESTING THE CUSTOMER POOL IMPLEMENTATION
For testing the customer pool implementation of ManPraSim v2 we have repeated the first of the above experiments with our latest model. Our reasoning behind this experiment is that a correct implementation should give us similar results as we obtained previously with the older version, if we use an even mix of all five customer types available.
Experiment description
During the experiment, we held the overall number of staffing resources constant at ten. We focussed on the composition of the team’s skills by systematically varying the proportion of staff allocated to each role within the pool of ten staff. In each department, staff was allocated to either selling or cashier duties. In reality, we saw that allocating extra cashiers would reduce the shop floor sales team numbers, and therefore the total number of customer-facing staff in each department is kept constant.
For our experiments we have not used a warm-up period as the real system is empty every day when trading begins and after it ends, which is replicated by the simulation model. To ensure that we obtain enough output data from the simulation model in order to estimate the model performance with sufficient accuracy we used the following experimental parameters. We have used a simulation run-length of 10 weeks for each replication. This decision is based on the run-length selection method proposed by Robinson (2004). Although on a first view the system looks like a terminating system one needs to keep in mind that the entities are equipped with a long term memory and therefore we need to simulate more than just a single day per simulation run. We have conducted 20 replications for each model configuration, using the confidence interval method with a 95% confidence interval proposed by Robinson (2004) to ensure that the number of replications would be sufficient. In fact, the required number of replications turned out to be much lower (only 2), but as the simulation runs very quickly we decided to conduct more runs to reduce the variance of the simulation outputs.
compared to WW given the greater customer service requirement in A&TV, and the higher frequency of sales transactions in WW. Results supported this hypothesis for both customer satisfaction indices, but not for the number of transactions where the peak level occurred at the same point. This was surprising because we would have expected the longer average service times in A&TV to put a greater ‘squeeze’ on customer help availability with even a relatively small increase in the number of cashiers.
When repeating the experiment with ManPraSim v2 we tried to mimic the generic customer from v1 by using an even mix of all five customer types available. We maintained a customer pool size at 10,000 for each of the model configurations. In order to enable the application of rigorous statistical techniques we have conducted 20 replications. The experimental results are analysed using tabulated and graphical illustrations of mean values. Despite our prior knowledge of how the real system operates, we were unable to hypothesize precise differences in variable relationships. We have instead predicted patterns of relationships and we believe this is congruent with what the simulation model can offer; it is a decision-support tool which is only able to inform us about directional changes between variables (actual figures are notional).
Hypotheses
In general, we predict a similar number of transactions for both simulation model versions as we tried to mimic a generic customer. We do however predict a change in the number of satisfied customers: we expect the results to show a shift from neutral to either satisfied or dissatisfied. This polarisation of customer satisfaction is expected because ManPraSim v2 enables the customer population to re-enter the system and each re-entry increases the likelihood that neutral customers shift to satisfied or dissatisfied. Looking at overall satisfaction level, we would expect similar trends for v1 and v2, but we predict the magnitude of the results for v2 to be significantly higher. This is because it incorporates an accumulated history of satisfaction trends for customers who have returned to the department on multiple occasions, unlike v1, which records satisfaction levels only for single, independent visits.
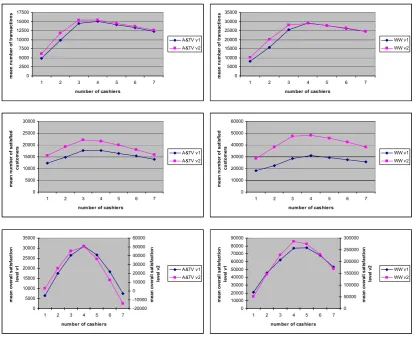
The descriptive statistics for ManPraSim v1 and v2 are shown in Table 4 and graphical representations of the results are presented in Figure 4.
<Insert Table 4 somewhere here>
<Insert Figure 4 somewhere here>
Looking at the number of transactions for both departments, it is clear that both simulation model versions produce a highly similar pattern of results. The number of satisfied customers is higher across all conditions of both departments for ManPraSim v2. This is as predicted and interestingly very high levels of satisfaction can be seen in WW in particular. We attribute this to the higher transaction volumes in WW coupled with our expectations of v2 resulting in higher levels of customer satisfaction as customers visit the branch on multiple occasions and commit to polarised opinions. Examining the overall satisfaction level, our hypotheses hold; results for both departments clearly follow the same trends regardless of simulation model version. In summary, all results are as predicted.
TESTING THE CUSTOMER TYPE IMPLEMENTATION
The main purpose of this experiment is to test the sensitivity of the simulation results toward our new defined customer types. In addition, we use this experiment to test the robustness of our new experience per visit measures. This experiment should demonstrate how useful these new measures are.
Experiment description
For the final two configurations, (f) uses an equal composition of each customer type and (g) uses a real customer split reflecting that reported by managers working in the case study departments.
<Insert Table 5 somewhere here>
The customer pool size is maintained at 10,000 for each model configuration, and we used the same experimental parameters as in the previous experiment (see Section 4.1.1) in order to enable the application of rigorous statistical techniques. As we explained previously, we test hypotheses asserting directional relationships.
Hypotheses
For our sensitivity analysis, we are particularly interested in drawing comparisons between department types and the extreme customer type configurations. The latter two configurations (f) and (g) are still of interest however these are composite configurations, resulting in a less significant or ‘dumped down’ effect on department performance measures.
We predict that a greater number of customers leave satisfied following a transaction in WW than in A&TV because of the higher frequency of transactions in WW. We also expect that (d) and (e) experience relatively low counts, across both departments, due to the low likelihood that either of these customer types makes a sales transaction.
We hypothesise that more customers leave before receiving normal help in A&TV due to the longer average service times than in WW, with the exception of (b) and (d) which both have a low likelihood of customers requesting help and are therefore linked to extremely low premature customer departures across both A&TV and WW. We predict that configurations (c) and (e) result in the highest counts on this measure, across both departments, because of the high service demand placed on normal staff in this department by these two customer types.
this difference to remain smaller than under different customer type configurations due to the relatively low propensities of these customer types to seek advice. Again, we hypothesise that (c) and (e) result in the highest counts of premature customer departures because these customer types in particular demand a great deal of advice.
We predict that a significantly greater number of customers leave whilst waiting to pay in A&TV than in WW across customer types because of the longer average cashier service time, resulting in longer queues at the till and therefore more customers leaving prematurely whilst waiting to pay. We hypothesise that configurations (a) and (b) are linked to higher numbers of customers leaving before paying because these customer types have a high likelihood of making a purchase. Conversely, we hypothesise that (d) and (e) are linked to lower numbers of customers leaving before paying because these customer types have a lower likelihood of making a purchase.
We hypothesise that the absolute number of customers who leave without finding anything is greater in WW than in A&TV across customer types. This is because even though the conversion rate in WW is slightly higher, the footfall is much greater in WW (i.e. customers visit more frequently). We predict that the greatest counts of customers leaving without a purchase are for (d) and (e) due to the low likelihood of these customer types making a purchase. We expect that the lowest counts of customers leaving without a purchase are for (a) and (b) because these customer types have a high propensity for retail purchases.
stretch the staffing constraints to the point where they cannot be met. To these hypotheses further, we predict that where customer’s current customer satisfaction is anchored by their previous perceptions of satisfaction; we expect a smaller proportion of neutral customer satisfaction scores (compared to the experience per visit measure). This occurs because over time customers will accumulate more experience of the department and take on more polarised opinions.
Results
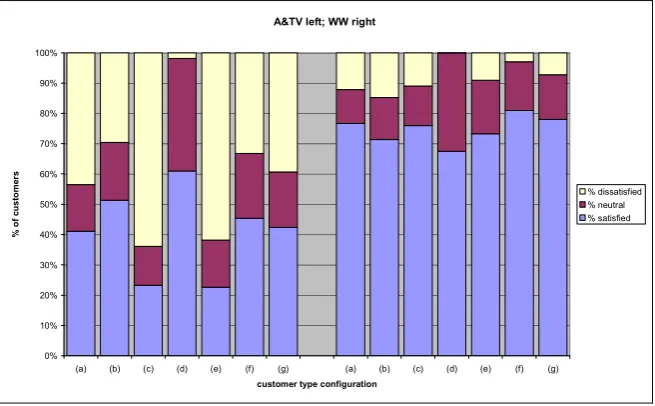
A series of two-way between groups ANOVAs have been used to assess the impact of customer types on counts of customer leaving satisfied after a transaction with a cashier, whilst waiting for normal or expert help, whilst waiting to pay, or leaving without finding a suitable purchase. The descriptive statistics for the experiment are shown in Table 6, followed by graphs for each performance variable. Where tests indicate significant differences, Tukey’s post hoc tests have been applied to ascertain exactly where these differences occur for different customer type configurations. Stacked bar charts have been examined to assess the impact of customer type configuration on two customer satisfaction indices: considering the customer’s previous experiences and considering the customer’s experience per visit.
<Insert Table 6 somewhere here>
Levene’s test for equality of variances was violated (p<.05) for customers leaving satisfied, before receiving normal or expert help, and whilst waiting to pay. To address this, ANOVAs investigating these variables used a more stringent significance level (p<.01).
Comparing the count of customers leaving before receiving normal help, significant effects occurred for both department [F(1, 266) = 79,090.42, p<.001] and customer type configuration [F(6, 266) = 24,058.12, p<.001], plus a significant interaction effect [F(6, 266) = 17,180.46, p<.001]. Tukey’s tests demonstrated significant differences for all comparisons (p<.001) apart from three pairings: (a) and (f), (b) and (d), and (c) and (e). All of the predictions have been borne out (see Figure 5b). In particular, the significantly higher count of customers leaving prematurely for (c) and (e) is very pronounced.
Results for customers leaving before receiving expert help revealed significant effects for both department [F(1, 266) = 19,733.82, p<.001] and customer type configuration [F(6, 266) = 3,147.72, p<.001], plus a significant interaction effect [F(6, 266) = 593.71, p<.001]. Post hoc tests demonstrated significant differences between all but four comparisons (p<.001). Looking at Figure 5c, the pattern of results is as hypothesized.
For customers leaving whilst waiting to pay, there were significant effects for both department [F(1, 266) = 5,750.20, p<.001] and customer type configuration [F(6, 266) = 51,939.13, p<.001], with a significant interaction effect [F(6, 266) = 838.79, p<.001]. Tukey’s tests revealed significant differences for all comparisons (p<.001) apart from between (d) and (e). Results are presented in Figure 5d and display consistent support for the hypotheses.
Results for customers leaving before finding anything to buy revealed significant effects for both department [F(1, 266) = 293,989.90, p<.001] and customer type configuration [F(6, 266) = 75,977.11, p<.001], plus a significant interaction effect [F(6, 266) = 4,573.90, p<.001]. Post hoc tests revealed significant differences between all comparisons (p<.001). The pattern of results is as hypothesized (see Figure 5e).
<Insert Figure 5 somewhere here>
considering the customer’s previous experiences, and Figure 7 shows customer satisfaction considering the customer’s experience per visit. There is much differentiation in satisfaction scores across the contrasting customer type configurations. Evidence supports all hypotheses.
<Insert Figure 6 somewhere here>
<Insert Figure 7 somewhere here>
Overall, our results indicate that customer types exert a considerable impact on system performance as demonstrated by a number of complementary measures. In addition, we have shown that our new customer satisfaction measures are a useful asset for analysing the service quality as perceived by the customer at each individual visit. We have presented evidence demonstrating that our improved customer satisfaction measure produces results closer to what we would expect from the real system, and the increased polarisation of customers’ satisfaction is a further reason to select carefully which customer types to implement in the simulation model.
CONCLUSIONS
In this paper, we have presented an alternative to the modelling approaches commonly used for investigating the impact of management practices on retail performance. Simulation modelling has proven to be a very useful tool for this kind of analysis. In particular, the combination of DEM for representing the system and ABM for representing the entities inside the system seems to be the formula for successfully building simulation models of dynamic heterogeneous people-centric systems in an OR context.
have tested some of these new features here by conducting a validation experiment as well as a sensitivity analysis. However, more tests are required to establish the usefulness of all the enhancements implemented in the latest simulation model.
After the first experiment, we realised that with the introduction of a finite population we also had to rethink the way in which we collect statistics about the satisfaction of customers. The existing measures did not reflect individuals’ satisfaction with the current service experience any more but instead measured the satisfaction with the overall service experience during the lifetime of the agent. We have added some customer satisfaction measure to evaluate how the current service is perceived by each customer. These measures have shown to provide some useful information for analysing the service quality as perceived by the customer during each visit and results are much closer to what we would expect from the real system.
A big advance has been the implementation of a diverse population by introducing customer types. These allow a better representation of the different service needs that customers have in different departments and the different responses to the service provided which is also apparent in the real world customer population. Through introducing customer types, we have been able to better define the heterogeneous customer groups who visit the different case study departments and observe previously hidden differences in the impact of the people management practices on the different departments. In our second experiment, we have demonstrated that customer types exert a considerable impact on system performance. It is therefore important that practitioners invest time and effort in analysing the existing types of customers and their actual proportions and derive an effective way of characterising the differences between these groups.
change their behaviour (e.g. their patience level) according to their previous experiences. These two enhancements enable us for the first time to study long-term effects of managerial decisions on specific customer groups with our simulation model, which opens up a new range of problem scenarios that can be investigated. This is particularly important as many managerial decisions are developed for the long-term (to encourage trust and loyalty from both staff and customers) and are unlikely to demonstrate their full potential after just a single visit of an individual customer.
Overall, we can affirm that the upgrades we have introduced and tested so far are all useful assets to the simulation model. They allow us to obtain a broader understanding of the situation and to investigate many issues and questions we could not previously investigate as for example long-term effects of people management practices on specific customer groups.
A major limitation in ManPraSim v2 is the absence of consideration of staff proactiveness. What we have actually observed during our case study and what is also encouraged by the guidelines for staff of the case study company is that employees act proactively, for example by approaching customers within a set period of time, or opening tills when queues grow beyond a defined level. In addition, if we want to use real staffing data in order to enhance the predictive capabilities of our simulation model relative to the real system, we need to model how staff allocate their tasks between competing activities rather than focusing on one type of work. Considering these features will allow us to increase the grade of realism to match the behaviour of the actors in the model better to those in the real system. This will also allow us to achieve a better match when comparing the system performance measures (e.g. transactions or staff utilisation) between our simulation model and the real system. Luckily, ABM is a technique that supports the modelling of proactive agent behaviour. First however, we need to test our remaining enhancements by conducting more sensitivity analyses, to see if these are useful assets or not.
form part of a long-term strategy. It would be interesting to see under which circumstances the demand for services varies in an unplanned fashion and how well staff can cope with it. A common application area for ABM is modelling the diffusion of innovations in social networks (Bonabeau, 2002; Garcia, 2005; Janssen and Jager, 2002). We would like to use the ideas developed here and transfer them into a service context to model diffusion of customer experiences in form of word-of mouth networks. With our enhanced agents, we are now in the position to investigate this kind of issues.
Finally, we are interested in exploring other ways of implementing the agent decision making process. It has been argued that modelling the autonomous internal decision making logic of customers is a crucial element for simulation models of consumer behaviour (Jager, 2007). It would be interesting to compare such an approach to the probabilistic one we have currently in place, in particular as no such study has been found in the literature.
However, before we move on to implement any further improvements to the model itself it is important to study how actually management takes on and uses this novel decision support tool.
In conclusion, we can say that the multidisciplinary of our team has helped us to gain new insight into the behaviour of staff and customers retail organisations. The main benefit from adopting this approach is improved understanding of, and debate about, a problem domain. The very nature of the methods involved forces researchers to be explicit about the rules underlying behaviour and to think in new ways about them. As a result, we have brought work psychology and simulation modelling together to form a new and exciting research area.
REFERENCES
• Baxter N, Collings D and Adjali I (2003). Agent-based modelling - intelligent customer relationship management. BT Technology Journal 21(2):126-132
• Baydar C (2003). Agent-based modelling and simulation of store performance for personalised pricing. In: Chick S E, Sanchez P J, Ferrin D M, Morrice D J (eds.) Proceedings of the 35th Winter Simulation Conference. New Orleans, Louisiana, pp 1759-1764
• Berman O and Larson R C (2004). A queuing control model for retail services having back room operations and cross-trained workers. Computers &
Operations Research 31:201-222.
• Birdi K, Clegg C W, Patterson M, Robinson A, Stride C B, Wall, T D and Wood, S J (2008). The impact of human resource and operational management practices on company productivity: A longitudinal study. Personnel
Psychology 61(3):467-501.
• Boero, R. and Squazzoni, F. (2005). Does empirical embeddedness matter? Methodological issues on agent-based models for analytical science. Journal of Artificial Societies and Social Simulation 8(4)
• Bonabeau E (2002). Agent-based modeling: Methods and techniques for simulating human systems. In: Proceedings of the National Academy of Science of the USA. 99, pp 7280-7287.
• Cao J (1999). Evaluation of advertising effectiveness using agent-based modeling and simulation. In: Proceedings of 2nd UK Workshop of SIG on Multi-Agent Systems. Bristol, UK.
• Clegg C W, Wall T D, Pepper K, Stride C, Woods D, Morrison D, Cordery J, Couchman P, Badham R, Kuenzler C, Grote G, Ide W, Takahashi M and Kogi K (2002). An international survey of the use and effectiveness of modern manufacturing practices. Human Factors and Ergonomics in Manufacturing
12:171-191.
• Csik B (2003). Simulation of competitive market situations using intelligent agents. Periodica Polytechnica Social and Management Sciences 11: 83-93.
• Darley V, von Tessin P and Sanders D (2004). An agent-based model of a corrugated-box factory: The trade-off between finished goods stock and on-time-in-full delivery. In: Coelho H. and Espinasse B. (eds), Proceedings of the
• Delbridge R, Edwards P, Forth J, Miskell P and Payne J (2006). The organisation of productivity: Re-thinking skills and work organisation.
Advanced Institute of Management Research (AIM), UK.
• Department of Trade and Industry (2003). UK productivity and
competitiveness indicators. DTI Economics Paper No 6, UK.
• Dubiel B and Tsimhoni O (2005). Integrating agent based modeling into a discrete event simulation. In: Proceedings of the 37th Winter Simulation
Conference. Orlando, FL, pp 1029-1037
• Fornell C, Johnson M D, Anderson E W, Cha J and Bryant B E (1996). The American customer satisfaction index: Nature, purpose, and findings. Journal of Marketing 60:7-18.
• Garcia R (2005). Uses of agent-based modeling in innovation / new product development research. Journal of Product Innovation Management 22:380-398
• Greasley A (2005). Using DEA and simulation in guiding operating units to improved performance. Journal of the Operational Research Society 56:727-731.
• Hillier F S and Lieberman G J (2005). Introduction to Operations Research, 8th ed. McGraw-Hill: New York, NY.
• Jager W (2007). The four P's in social simulation, a perspective on how marketing could benefit from the use of social simulation. Journal of Business
Research 60:868–875.
• Jager W, Janssen M A, De Vries H J M, De Greef J and Vlek C A J (2000). Behaviour in commons dilemmas: Homo Economicus and Homo Psychologicus in an ecological-economic model. Ecological Economics. 35(3):357-379
• Janssen M A and Jager W (2002). Simulating diffusion of green products: Co-evolution between firms and consumers. Journal of Evolutionary Economics
12:283-306.
• Janssen M A and Jager W (2001). Fashions, habits and changing preferences: Simulation of psychological factors affecting market dynamics. Journal of
• Janssen M A and Ostrom E (2006). Empirically based, agent-based models.
Ecology and Society 11(2):37.
• Kitazawa K and Batty M (2004). Pedestrian behaviour modelling: An application to retail movements using a genetic algorithm. In: Proceedings of the 7th International Conference on Design and Decision Support Systems in
Architecture and Urban Planning. St Michelsgestel, Netherlands
• Koritarov V (2004). Real-world market representation with agents: Modeling the electricity market as a complex adaptive system with an agent-based approach. IEEE Power and Energy Magazine July/August 2004:39-46
• Kotz S and van Dorp J R (2004). Beyond beta: Other continuous families of
distributions with bounded support and applications. World Scientific
Publishing Company: Singapore
• Law A M and Kelton W D (1991). Simulation modeling and analysis, 2nd ed. McGraw-Hill: New York, NY.
• Moss S and Edmonds B (2005). Sociology and simulation: Statistical and qualitative cross-validation. American Journal of Sociology 110:1095-1131.
• Nicholson M, Clarke I and Blakemore M (2002). “One brand, three ways to shop”: Situational variables and multichannel consumer behaviour.
International Review of Retail, Distribution and Consumer Research. 12:
131-148.
• Parunak H V D, Savit H R and Riolo R L (1998). Agent-based modeling vs. equation-based modeling: A case study and users’ guide”. In: Proceedings of
Multi-Agent Systems and Agent-Based Simulation. Lecture Notes in Artificial
Intelligence (LNAI) Vol. 1534, pp 10-25,
• Patel S and Schlijper A (2004). Models of Consumer Behaviour. Smith Institute (Unilever), UK.
• Pourdehnad J, Maani K and Sedehi H (2002). System dynamics and intelligent agent-based simulation: Where is the synergy? In: Davidsen P I, Mollona E, Diker V G, Langer R S and Rowe J I (eds). Proceedings of the 20th
International Conference of the System Dynamics Society. Palermo, Italy.
• Rao A S and Georgeff M P (1995). BDI agents: From theory to practice. In:
Proceedings of the 1st International Conference on Multi-Agent Systems. San
Francisco, CA, pp 312-319.
• Reynolds J E, Howard D, Dragun B, Rosewell B and Ormerod P (2005). Assessing the productivity of the UK retail sector. International Review of
Retail, Distribution and Consumer Research 15:237-280.
• Robinson S (2004). Simulation: The practice of model development and use, John Wiley & Sons: West Sussex, UK.
• Schwaiger A (2007). Modellierung und Analyse individuellen
Konsumentenverhaltens mit probabilistischen Holonen. PhD Thesis,
Universität des Saarlandes, Germany.
• Said L B and Bouron T (2001). Multi-agent simulation of consumer behaviours in a competitive market. In: Proceedings of the 10th European Workshop on Agent Systems, Modelling Autonomous Agents in A
Multi-Agent Word. Annecy, France
• Said L B, Bouron T and Drogoul A (2002). Agent-based interaction analysis of consumer behaviour. In: Proceedings of the First International Joint
Conference on Autonomous Agents and Multiagent Systems. Bologna, Italy, pp
184-190.
• Schenk T A, Loeffler G and Rau J (2007). Agent-based simulation of consumer behaviour in grocery shopping on a regional level. Journal of
Business Research 60(8):894-903
• Schwaiger A and Stahmer B (2003). SimMarket: Multi-agent based customer simulation and decision support for category management. In: Schillo M, Klusch M, Muller J and Tianfield H (eds). Lecture Notes in Artificial Intelligence (LNAI) Vol. 2831. Springer: Berlin, pp 74-84.
• Shannon R E (1975). Systems simulation: The art and science. Prentice-Hall: Englewood Cliffs, NJ.
• Siebers P O, Aickelin U, Battisti G, Celia H, Clegg C W, Fu X, De Hoyos R, Iona A, Petrescu A and Peixoto A (2008). Enhancing productivity: The role of
management practices in closing the productivity gap. Advanced Institute of
• Siebers P O, Aickelin U, Celia H and Clegg C W (2007a). A multi-agent simulation of retail management practices. In: Wainer G A (ed). Proceedings
of the 2007 Summer Computer Simulation Conference, San Diego, CA, USA,
pp 959-966.
• Siebers P O, Aickelin U, Celia H and Clegg C W (2007b). Using intelligent agents to understand management practices and retail productivity. In: Henderson S G, Biller B, Hsieh M H, Shortle J, Tew J D and Barton R R (eds). Proceedings of the 2007 Winter Simulation Conference. Washington, DC, USA, pp 2212-2220.
• Siebers P O, Aickelin U, Celia H and Clegg C W (2009). Modelling and simulating retail management practices: A first approach. International Journal of Simulation and Process Modelling, accepted for publication.
• Simon F and Usunier J C (2007). Cognitive, demographic and situational determinants of service customer preference for personnel-in-contact over self-service technology. International Journal of Research in Marketing
24:163-173.
• Simon H A (1996). The sciences of the artificial, 3rd ed. MIT Press: Cambridge, MA.
• Twomey P and Cadman R (2002). Agent-based modeling of customer behavior in the telecoms and media markets. Info - The Journal of Policy,
Regulation and Strategy for Telecommunications 4(1):56-63.
• Vriend N J (1995) Self-organization of markets: An example of a computational approach. Computational Economics 8:205-231.
• Wall T D and Wood S J (2005). Romance of human resource management and business performance and the case for big science. Human Relations 58:429-462.
• XJTEK (2005). AnyLogic User’s Guide, XJ Technologies Company Ltd. • Yi Y (1990). A critical review of consumer satisfaction. In: Zeithaml V A
FIGURES