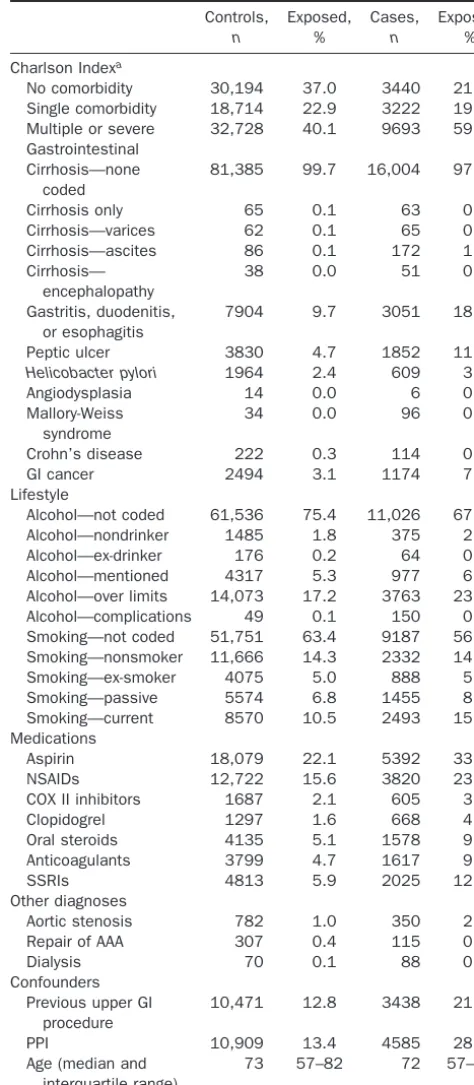
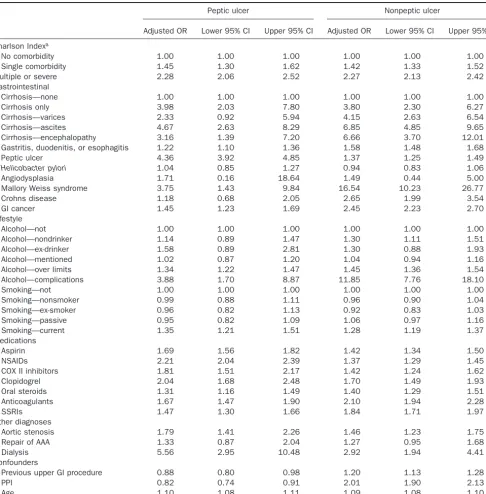
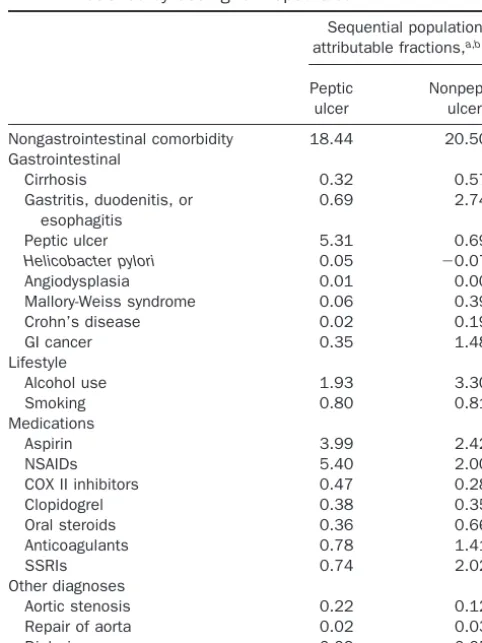
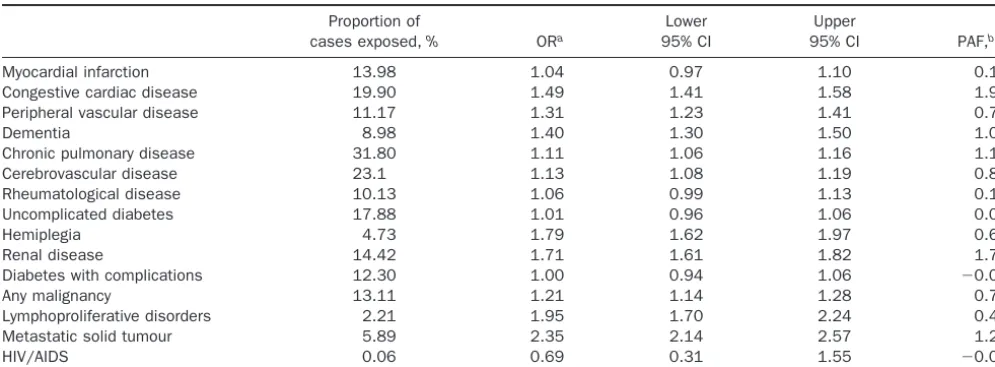
Comorbidities Affect Risk of Nonvariceal Upper Gastrointestinal Bleeding
COLIN JOHN CROOKS,1,2
JOE WEST,1,2
and TIMOTHY RICHARD CARD1,2
1
Division of Epidemiology and Public Health, The University of Nottingham, Nottingham City Hospital, Nottingham, UK and2
Nottingham Digestive Diseases Centre, National Institute for Health Research Biomedical Research Unit, Queen’s Medical Centre, Nottingham University Hospitals National Health Service Trust, Nottingham, UK
This article has an accompanying continuing medical education activity on page e18. Learning Objective: Upon
completion of this CME exercise, and reading of the associated paper, successful learners will be able to appraise how
multiple risk factors can contribute to upper gastrointestinal bleeding and recognize the large contribution of
comorbidity.
See Covering the Cover synopsis on page 1327.
BACKGROUND & AIMS:
The incidence of upper
gas-trointestinal bleeding (GIB) has not been reduced despite
the decreasing incidence of peptic ulcers, strategies to
eradicate
Helicobacter pylori
infection, and prophylaxis
against ulceration from nonsteroidal anti-inflammatory
drugs. Other factors might therefore be involved in the
pathogenesis of GIB. Patients with GIB have increasing
nongastrointestinal comorbidity, so we investigated
whether comorbidity itself increased the risk of GIB.
METHODS:
We conducted a matched case-control study
using linked primary and secondary care data collected in
England from April 1, 1997 through August 31, 2010.
Patients older than 15 years with nonvariceal GIB (n
⫽
16,355) were matched to 5 controls by age, sex, year, and
practice (n
⫽
81,636). All available risk factors for GIB
were extracted and modeled using conditional logistic
regression. Adjusted associations with
nongastrointesti-nal comorbidity, defined using the Charlson Index, were
then tested and sequential population attributable
frac-tions calculated.
RESULTS:
Comorbidity had a strong
graded association with GIB; the adjusted odds ratio for a
single comorbidity was 1.43 (95% confidence interval [CI]:
1.35–1.52) and for multiple or severe comorbidity was
2.26 (95% CI: 2.14%–2.38%). The additional population
attributable fraction for comorbidity (19.8%; 95% CI:
18.4%–21.2%) was considerably larger than that for any
other measured risk factor, including aspirin or
non-steroidal anti-inflammatory drug use (3.0% and 3.1%,
re-spectively).
CONCLUSIONS: Nongastrointestinal
co-morbidity is an independent risk factor for GIB, and
contributes to a greater proportion of patients with
bleeding in the population than other recognized risk
factors. These findings could help in the assessment of
potential causes of GIB, and also explain why the
incidence of GIB remains high in an aging population.
Keywords:
Etiology; Gastrointestinal Bleeding; Stomach.
H
elicobacter pylori infection, nonsteroidal
anti-in-flammatory medications (NSAIDs), and aspirin are
believed to be the main causes of nonvariceal upper
gas-trointestinal bleeding,
1and with the discovery of proton
pump inhibitors (PPIs) and
H pylori
eradication therapy,
the burden of peptic ulcer disease has been decreasing.
2Despite this, upper gastrointestinal hemorrhage remains
the most common acute severe medical admission for
gastroenterology,
3,4and its incidence in population-based
studies remains virtually unchanged.
5,6This suggests that
other (previously unidentified) risk factors are
contribut-ing to its population burden.
Historically, nongastrointestinal comorbidity was
be-lieved to be associated with stress ulceration
7but,
cur-rently, the role of comorbidity in the etiology of
gastro-intestinal bleeding (GIB) is not recognized apart from in
severe illness; for example, sicker cirrhotic patients are
known to have an increased risk of variceal bleeding,
8and
sicker patients in intensive therapy units (ITUs) have an
increased risk of nonvariceal bleeding.
9However, as the
proportion of bleed patients with comorbidity has
in-creased during the last decade,
5we wondered if exposure
to less severe but chronic comorbidity could itself be
responsible for the persisting incidence of bleeding.
Out-side of ITU though, the effect of comorbidity has only
been assessed as a confounder in studies that focused on
the effect of medications on gastrointestinal bleeds.
10Al-though these studies do support a role for comorbidity,
they do not allow us to understand whether it is an
important independent contributor to the persisting
bur-den of upper GIB.
We have therefore conducted a study aimed primarily at
assessing whether comorbidity might have an important
role in the etiology of upper GIB. To do this we have
conducted a case-control study and formed a model fully
corrected for known measured risk factors of upper GIB.
Abbreviations used in this paper: GIB, gastrointestinal bleeding; GPRD, General Practice Research Database; ITU, intensive therapy unit; NSAID, nonsteroidal anti-inflammatory drug; OR, odds ratio; PAF, pop-ulation attributable fraction; PPI, proton pump inhibitors.
©2013 by the AGA Institute 0016-5085/$36.00
http://dx.doi.org/10.1053/j.gastro.2013.02.040
CLINICAL
We have then calculated the additional explanatory effect
of adding comorbidity to our model to understand its
effect on bleeding incidence in the general population.
Methods
Study Design
We conducted a matched case control study.
Data
To provide the detailed longitudinal data and necessary power for this study, we have used the recently linked English Hospital Episodes Statistics data (secondary care data) and Gen-eral Practice Research Database (GPRD) (primary care data). Because of the comprehensive English primary care system, the population registered to the GPRD is representative of the
general English population.11 The data are subject to quality
checks and a practice’s data are only used when they are of high enough quality to be used in research, at these times the data are
said to be “up to research standard.”12 The GPRD has been
extensively validated for a wide range of diagnoses, with a mean
positive predictive value of 89%.13Ethical approval for this study
was obtained from the Independent Scientific Advisory Com-mittee for Medicines and Healthcare products Regulatory Agency database research. Fifty-one percent of English practices in GPRD have consented to record level linkage of their popu-lation to Hospital Episodes Statistics. This records all hospital admissions from the population registered to one of the linked primary care practices contributing to the GPRD. For this study, the linked dataset was available between April 1, 1997 and August 31, 2010.
Case Definition
We have previously published the codes and methods
used to define upper gastrointestinal bleeds in this study.14In
brief, we selected as exposed all patients with a first nonvariceal upper gastrointestinal bleed. A bleed was defined by a specific code for an upper gastrointestinal nonvariceal bleed in either primary or secondary care who had a supporting code in the linked dataset (defined as a likely symptom, cause, therapy, investigation, or outcome of upper gastrointestinal hemor-rhage). Variceal bleeds or nonspecific gastrointestinal bleed codes with either a lower gastrointestinal diagnosis or procedure were excluded. Further exclusions were temporary patients (pa-tients not registered permanently at a GPRD primary care prac-tice, who might just be visiting the area of the practice briefly, and who are therefore not part of the GPRD’s underlying pop-ulation), children younger than 16 years old, cases with invalid date codes, or cases outside the up-to-research-standard ob-served time periods. Patients were required to be registered with the primary care practice for at least 3 months before an upper gastrointestinal bleed event to avoid including prevalent cases that might have been coded at the initial registration consulta-tion. Only the first event for each patient was included. We have previously demonstrated that this selection strategy minimizes
selection bias in studies of upper GIB in these data.14A
second-ary analysis was then stratified by whether the defining bleed code or supporting code specifically referred to a peptic ulcer
(Read codes J11 to J14 orInternational Classification of Diseases, 10th
Revision codes K25–K28). The Read codes had high positive
predictive values (⬎95%) for peptic ulcers and upper
gastroin-testinal complications when validated in English primary care
routine records.15,16
Matched Controls
Each case was age (⫾5 years) and sex matched without
replacement to 5 controls selected randomly who were alive at the time of the gastrointestinal bleed and registered to the same primary care practice. Controls were required to have been reg-istered with the primary care practice for at least 3 months before the match date to be consistent with the definition for cases.
Exposures
Potential final common causal pathways of an upper gastrointestinal bleed were defined a priori for erosions/ulcer-ation, varices, angiodysplasia, fistula/trauma and coagulopathy, and code lists derived for diagnoses and medications that might be associated with each pathway based on published literature (Figure 1). Although variceal bleeds were excluded from the cases and controls, cirrhosis itself was included as a risk factor, as cirrhotic patients can have nonvariceal bleeds. Medication risk factors were included if there was a coded prescription within the year before the admission. Exposures coded within 2 months of the admission date were excluded to avoid identifying events and prescriptions related to the actual bleed event. PPIs were included as an indicator of physicians’ judgement of the risk of upper gastrointestinal hemorrhage that was not captured by other measured risk factors. Alcohol consumption was classified as either nondrinker, alcohol mentioned, ex–alcohol depen-dency, alcohol excess, alcohol complications, and missing. Smoking was classified as never smoked, current smoker, ex-smoker, and missing. Cirrhosis was classified as uncomplicated, with varices, with ascites, or with encephalopathy or liver failure coded. All other exposures were binary variables.
Comorbidity
Comorbidity was defined using the Charlson Index.17
This is a well-validated weighted comorbidity score derived from unselected hospital admissions that predicts 1-year mortality after hospital discharge. It has since been used in many contexts and has repeatedly measured the burden of comorbidity reliably. The original article demonstrated a graded increase in the risk in mortality associated with an increase in total score. The different comorbidities were assigned weights of 1, 2, 3, and 6, depending on their association with mortality. Where a graded effect was observed within a disease, for example, in diabetes or malig-nancy, these diseases were further stratified according to their severity. The conditions included in the original score (in order of weighting) were myocardial infarction, congestive heart fail-ure, peripheral vascular disease, cerebrovascular disease, demen-tia, chronic pulmonary disease, connective tissue disease, peptic ulcer disease, mild liver disease, diabetes, hemiplegia, moderate or severe renal disease, diabetes with end organ damage, leuke-mia, lymphoma, moderate or severe liver disease, metastatic solid tumor, and acquired immunodeficiency syndrome. For our study, any codes already used to define risk factors of upper GIB inFigure 1were excluded when calculating the index, ie, peptic ulcer and cirrhosis codes. For clarity in reporting in the tables,
the index was summarized as no comorbidity (Charlson Index⫽
0), single comorbidity (Charlson Index⫽ 1), and multiple or
severe comorbidity (Charlson Index⫽2).
Analysis
Unadjusted analysis. Unadjusted odds ratios (ORs) were calculated for each exposure using conditional logistic regression to allow for the matched study design.
CLINICAL
Multivariable analysis. Adjusted ORs for each expo-sure of interest were calculated with conditional logistic regres-sion adjusting for all exposures in addition to age, PPI use, and previous gastrointestinal procedures. As calendar year, sex, and primary care practice were precisely matched on in the controls, it was not necessary to include them in the model. Comorbidity was added last, and its association with bleeding tested using a likelihood ratio test. The variance inflation factor (a measure of the increase in model variance due to correlation between vari-ables) was calculated for each exposure of interest to assess the effect of correlation between variables. All exposures with a
variance inflation factor⬎5 were excluded from the final
con-ditional logistic regression model.18The final model was then
stratified into cases with a recording of peptic ulcer and those without.
Sequential (or Extra) Population Attributable
Fractions
Sequential (or extra) population attributable fractions (PAFs) were calculated for each exposure, using the prevalence among the cases and the respective coefficients from the
condi-tional logistic regression model.19Sequential PAFs differ from
the standard adjusted PAFs that are usually presented. They are calculated by estimating the additional proportion of cases at-tributable to each exposure, after removing the proportion of cases already attributed to the combined effect of all other exposures in the model. The final model was then stratified into cases with a recording of peptic ulcer and those without. All analysis was performed using Stata software, version 12 (Stata-Corp LP, College Station, TX).
Sensitivity Analyses
Previous studies of risk factor medications, such as
NSAIDs,20have been conducted in study populations that
ex-cluded patients with known risk factors for GIB. To allow comparisons with these, we re-estimated the crude ORs for each of the risk factor medications after excluding any cases and their controls with nonmedication bleed risk factors. To assess the effect of the choice of the exposure exclusion time window before the bleed event on the effect of NSAIDs, we also re-estimated a model that included NSAID use up to 30 days before the index date.
Two additional sensitivity analyses were performed to assess the effect of potential under-reporting. First the analysis was restricted to those older than 65 years old and who were eligible for free prescriptions, to assess the effect of potential under-reporting of nonprescribed NSAID use. Secondly, multiple im-putation was used to re-estimate the association with comorbid-ity by imputing missing values for alcohol and smoking status. Alcohol and smoking were categorised as binary exposures of excess alcohol or current smoking to fit the logistic regression imputation model. All previously extracted exposures were used in the imputation model with addition of the socioeconomic status, and 20 sets of imputations were calculated. Socioeconomic status was measured by the Index of Multiple Deprivation quintiles ob-tained from linked Office of National Statistics data.
[image:3.603.49.547.55.392.2]Finally, to assess the effect of using the aggregated and weighted Charlson Index, the model was re-estimated to assess the effect of the individual component comorbidities from the Charlson Index.
Figure 1. Risk factors for upper GIB. SSRI, selective serotonin reuptake inhibitor.
CLINICAL
Results
Cases and Matching
There were 16,355 unique cases identified with a
first nonvariceal bleed; 13,372 with specific code in
Hospital Episodes Statistics, 10,938 with a specific code
in GPRD, and 7955 with a specific code in both
data-sets. There were 16,304 (99.7%) cases matched to 5
controls each and only 8 cases (0.05%) were not
matched to any controls. Median observed time before
admission for cases was 7.4 years (interquartile range,
3.4 –11.5) compared with 7.5 years (interquartile range,
3.5–11.5) for controls.
[image:4.603.303.540.81.623.2]Unadjusted Analysis
Table 1
shows the proportion of cases and controls
with each exposure. As expected, aspirin and NSAIDs were
the most frequently prescribed risk factor medications,
and peptic ulcer and gastritis/duodenitis/esophagitis were
the most frequent risk factor diagnoses. All a priori risk
factors were associated with upper GIB. Peptic ulcers were
coded as a diagnosis within the linked data in 4,823
patients (29% of cases). The exposures stratified by coding
of peptic ulcer are shown in
Supplementary Table 1
.
Multivariable Analysis and PAFs
There was strong evidence for an association
be-tween the nongastrointestinal Charlson Index and upper
GIB after adjusting for all measured risk factors (single
comorbidity adjusted OR
⫽
1.43; 95% CI: 1.35–1.52;
mul-tiple or severe comorbidity adjusted OR
⫽
2.26; 95% CI:
2.14 –2.38;
P
⬍
.001 likelihood ratio test).
Table 2
shows
the adjusted ORs from the final model for each exposure.
We found the largest association with a bleed was with a
previous Mallory-Weiss syndrome, which reflects the
in-herent risk of bleeding in recurrent vomitters. The
ables for angiodysplasia and dialysis had the highest
vari-ance inflation factors, 1.48 and 2.35, respectively. As both
of these were less than the a priori threshold of 5, all
exposures were included in the final conditional logistic
regression model.
Stratifying this model demonstrated similar
associa-tions with comorbidity, whether or not peptic ulcer
cod-ing was present, and slightly higher associations for a
peptic ulcer with exposure to previous peptic ulcers,
NSAID, or aspirin use (
Table 3
). Associations with other
risk factors were higher in the nonpeptic ulcer cohort.
The proportion of cases attributable in the population
to the combined effect of all available measured exposures
was 48%, not including the effect of nongastrointestinal
comorbidity. The additional proportion of cases
attribut-able to nongastrointestinal comorbidity (or the sequential
PAF) was 20%, and this was higher in magnitude than for
any other measured exposure (
Table 4
). The next largest
PAFs were 3% for aspirin and NSAID use.
The PAF for comorbidity associated with peptic ulcer
bleeds was slightly lower than that for nonulcer bleeds
(18% vs 21%), with a higher contribution from previous
peptic ulcer bleeds and aspirin and NSAIDs (
Table 5
). In
contrast, for nonulcer bleeds, the PAF was slightly
in-creased for gastrointestinal cancer, alcohol,
anticoagu-lants, and selective serotonin reuptake inhibitors.
Table 1. Proportion of Cases and Controls Exposed 2 Months Before Bleed Date or Match Date
Controls,
n
Exposed, %
Cases,
n
Exposed, %
Charlson Indexa
No comorbidity 30,194 37.0 3440 21.0 Single comorbidity 18,714 22.9 3222 19.7 Multiple or severe 32,728 40.1 9693 59.3 Gastrointestinal
Cirrhosis—none coded
81,385 99.7 16,004 97.9
Cirrhosis only 65 0.1 63 0.4 Cirrhosis—varices 62 0.1 65 0.4 Cirrhosis—ascites 86 0.1 172 1.1 Cirrhosis—
encephalopathy
38 0.0 51 0.3
Gastritis, duodenitis, or esophagitis
7904 9.7 3051 18.7
Peptic ulcer 3830 4.7 1852 11.3
Helicobacter pylori 1964 2.4 609 3.7
Angiodysplasia 14 0.0 6 0.0 Mallory-Weiss
syndrome
34 0.0 96 0.6
Crohn’s disease 222 0.3 114 0.7 GI cancer 2494 3.1 1174 7.2 Lifestyle
Alcohol—not coded 61,536 75.4 11,026 67.4 Alcohol—nondrinker 1485 1.8 375 2.3 Alcohol—ex-drinker 176 0.2 64 0.4 Alcohol—mentioned 4317 5.3 977 6.0 Alcohol—over limits 14,073 17.2 3763 23.0 Alcohol—complications 49 0.1 150 0.9 Smoking—not coded 51,751 63.4 9187 56.2 Smoking—nonsmoker 11,666 14.3 2332 14.3 Smoking—ex-smoker 4075 5.0 888 5.4 Smoking—passive 5574 6.8 1455 8.9 Smoking—current 8570 10.5 2493 15.2 Medications
Aspirin 18,079 22.1 5392 33.0 NSAIDs 12,722 15.6 3820 23.4 COX II inhibitors 1687 2.1 605 3.7 Clopidogrel 1297 1.6 668 4.1 Oral steroids 4135 5.1 1578 9.6 Anticoagulants 3799 4.7 1617 9.9 SSRIs 4813 5.9 2025 12.4 Other diagnoses
Aortic stenosis 782 1.0 350 2.1 Repair of AAA 307 0.4 115 0.7 Dialysis 70 0.1 88 0.5 Confounders
Previous upper GI procedure
10,471 12.8 3438 21.0
PPI 10,909 13.4 4585 28.0 Age (median and
interquartile range)
73 57–82 72 57–81
AAA, Abdominal aortic aneursym; SSRI, selective serotonin reuptake inhibitors.
aNongastrointestinal comorbidity is catogorized as: Charslon Index⫽0
is no comorbidity, Charlson Index ⫽ 1 single or comorbidity, and Charlson Index⫽2 is multiple or severe comorbidity.
CLINICAL
Sensitivity Analyses
The crude ORs were re-estimated for medications
after excluding cases with nonmedication risk factors and
these are shown in
Supplementary Table 2
. NSAID use
was strongly associated with bleeding, with an OR of 1.67,
and this increased to 2.80 with the exclusion of
nonmedi-cation risk factors. The corresponding adjusted ORs
associated with NSAIDs were 1.59 with nonmedication
risk factors included and 1.73 without. Altering the
exposure exclusion window for NSAIDs to 30 days
rather than 60 days before the bleed slightly increased
the effect of NSAIDS, but had only a minimal effect on
the other results, including comorbidity (see
Supple-mentary Table 3
).
Restricting the analysis to those older than 65 years old
increased the proportion of cases attributable to the
com-bined effect of all exposures from 48% to 63%, and reduced
the additional proportion of cases attributable to
nongas-trointestinal comorbidity from 19.8% to 16.1%.
Re-estimat-ing the model usRe-estimat-ing multiple imputation for missRe-estimat-ing
alco-hol and smoking status (modeled as binary exposures)
slightly reduced the PAF associated with comorbidity from
22.9% to 22.4%, but when alcohol and smoking status were
omitted from the model, the PAF was almost unaltered at
22.2%. Finally, the full model was re-estimated for each
component of the Charlson Index (
Table 6
). The
contribu-tion of these individual comorbidities was minimal in
com-parison with their combined weighted effect in the Charlson
Index in the main analysis.
Discussion
This study has demonstrated that a combined
measure of nongastrointestinal comorbidity is a
signifi-cant independent predictor of upper GIB, even after
ac-counting for all other recognized and measured risk
fac-tors. In addition, it explained a greater proportion of the
burden of bleeding than any other risk factor in the
population. The effect of this combined measure of
non-gastrointestinal comorbidity was far in excess of that
which would be expected from its constituent diseases.
The association of comorbidities with upper GIB has
been studied previously, but only in smaller secondary
care surveys with comorbidity as a confounder and not as
the primary exposure. We searched PubMed using
vari-ants of comorbidity, etiology, causality, risk factors, and
gastrointestinal hemorrhage; however, no studies were
identified that set out to address the question of our
article. Studies were most frequently designed to measure
the association of a single medication while adjusting for
any confounding by comorbidity.
21,22 [image:5.603.47.289.92.585.2]Two studies assessed a larger range of medications in
cross-sectional hospital-based surveys.
10,23First, Weil found
that only 2 comorbidities, heart failure and diabetes,
con-tributed to upper GIB with adjusted PAFs of 5% and 4%,
respectively.
23However, the study was retrospective, and
with
⬍
1000 cases limiting its power. In contrast to the “extra
PAF” we calculated, the adjusted PAFs in their article
calcu-lated the effect of each exposure in a pseudo-population
with no other risk factors present, potentially overestimating
the effect in the general population, in which a case can be
caused by many risk factors. The second comparable paper
of Gallerani et al found an association with comorbidity and
a similar 2-fold increase in risk in those exposed to NSAIDs
to what we found in our peptic ulcer cohort.
10However, it
was also a retrospective survey– based study potentially
sub-ject to recall bias, and had
⬍
1000 cases. Furthermore, the
authors did not separate out gastrointestinal comorbidity
Table 2. Adjusted Model for Nonvariceal Upper
Gastrointestinal Bleeding All Cases (Age, Year, Practice, and Sex Matched)
Adjusted OR
Lower 95% CI
Upper 95% CI
Charlson Index
No comorbidity 1.00 1.00 1.00 Single comorbidity 1.43 1.35 1.52 Multiple or severe 2.26 2.14 2.38 Gastrointestinal
Cirrhosis—none 1.00 1.00 1.00 Cirrhosis only 3.89 2.61 5.77 Cirrhosis—varices 3.75 2.51 5.61 Cirrhosis—ascites 5.96 4.46 7.96 Cirrhosis—encephalopathy 5.05 3.14 8.10 Gastritis, duodenitis, or
esophagitis
1.46 1.39 1.55
Peptic ulcer 2.11 1.98 2.26
Helicobacter pylori 0.96 0.86 1.07
Angiodysplasia 1.67 0.58 4.80 Mallory-Weiss syndrome 12.39 8.16 18.82 Crohn’s disease 2.19 1.71 2.81 GI cancer 2.13 1.97 2.31 Lifestyle
Alcohol—not 1.00 1.00 1.00 Alcohol—nondrinker 1.25 1.10 1.42 Alcohol—ex-drinker 1.39 1.01 1.92 Alcohol—mentioned 1.05 0.96 1.14 Alcohol—over limits 1.42 1.35 1.49 Alcohol—complications 9.33 6.48 13.44 Smoking—not 1.00 1.00 1.00 Smoking—non-smoker 0.97 0.92 1.04 Smoking—ex-smoker 0.94 0.86 1.02 Smoking—passive 1.03 0.95 1.11 Smoking—current 1.29 1.22 1.37 Medications
Aspirin 1.50 1.43 1.57 NSAIDs 1.59 1.52 1.66 COX II inhibitors 1.52 1.37 1.69 Clopidogrel 1.74 1.57 1.94 Oral steroids 1.38 1.29 1.48 Anticoagulants 1.94 1.81 2.08
SSRIs 1.72 1.62 1.83
Other diagnoses
Aortic stenosis 1.58 1.38 1.82 Repair of AAA 1.29 1.02 1.64 Dialysis 3.59 2.55 5.05 Confounders
Previous upper GI procedure 1.10 1.04 1.15
PPI 1.59 1.52 1.67
Age 1.09 1.08 1.10
AAA, Abdominal aortic aneurysm; SSRI, selective serotonin reuptake inhibitors.
CLINICAL
from nongastrointestinal comorbidity and used hospital
controls, therefore limiting comparisons with our
popula-tion-based study.
Other studies assessed higher alcohol intake,
24H pylori,
25smoking,
26acute renal failure,
27and acute myocardial
infarc-tion
28and found associations with upper GIB. But these
studies were in small selected hospitalised cohorts (n
⬍
1000
bleeds) with limited assessments of individual comorbidity
and no measure of their PAFs.
Our study has a number of important strengths when
compared with these previous works because we set out
[image:6.603.56.543.79.573.2]specifically to assess the degree to which
nongastrointes-tinal comorbidity predicts nonvariceal upper GIB after
removing the effects of all the available known risk factors
in a much larger general population. In addition, we used
a method of defining cases and exposures that utilized
information from both primary and secondary care,
thereby maximizing the evidence supporting each case
while not excluding severe events.
14Furthermore, due to
the comprehensive coverage of the English primary care
system, our study’s results are likely to be generalizable to
the whole English population and, we believe, further
Table 3. Adjusted Model for Nonvariceal Upper Gastrointestinal Bleeding Stratified by Coding of Peptic Ulcer (Age, Year, Practice, and Sex Matched)
Peptic ulcer Nonpeptic ulcer
Adjusted OR Lower 95% CI Upper 95% CI Adjusted OR Lower 95% CI Upper 95% CI
Charlson Indexa
No comorbidity 1.00 1.00 1.00 1.00 1.00 1.00 Single comorbidity 1.45 1.30 1.62 1.42 1.33 1.52 Multiple or severe 2.28 2.06 2.52 2.27 2.13 2.42 Gastrointestinal
Cirrhosis—none 1.00 1.00 1.00 1.00 1.00 1.00 Cirrhosis only 3.98 2.03 7.80 3.80 2.30 6.27 Cirrhosis—varices 2.33 0.92 5.94 4.15 2.63 6.54 Cirrhosis—ascites 4.67 2.63 8.29 6.85 4.85 9.65 Cirrhosis—encephalopathy 3.16 1.39 7.20 6.66 3.70 12.01 Gastritis, duodenitis, or esophagitis 1.22 1.10 1.36 1.58 1.48 1.68 Peptic ulcer 4.36 3.92 4.85 1.37 1.25 1.49
Helicobacter pylori 1.04 0.85 1.27 0.94 0.83 1.06
Angiodysplasia 1.71 0.16 18.64 1.49 0.44 5.00 Mallory Weiss syndrome 3.75 1.43 9.84 16.54 10.23 26.77 Crohns disease 1.18 0.68 2.05 2.65 1.99 3.54
GI cancer 1.45 1.23 1.69 2.45 2.23 2.70
Lifestyle
Alcohol—not 1.00 1.00 1.00 1.00 1.00 1.00
Alcohol—nondrinker 1.14 0.89 1.47 1.30 1.11 1.51 Alcohol—ex-drinker 1.58 0.89 2.81 1.30 0.88 1.93 Alcohol—mentioned 1.02 0.87 1.20 1.04 0.94 1.16 Alcohol—over limits 1.34 1.22 1.47 1.45 1.36 1.54 Alcohol—complications 3.88 1.70 8.87 11.85 7.76 18.10
Smoking—not 1.00 1.00 1.00 1.00 1.00 1.00
Smoking—nonsmoker 0.99 0.88 1.11 0.96 0.90 1.04 Smoking—ex-smoker 0.96 0.82 1.13 0.92 0.83 1.03 Smoking—passive 0.95 0.82 1.09 1.06 0.97 1.16 Smoking—current 1.35 1.21 1.51 1.28 1.19 1.37 Medications
Aspirin 1.69 1.56 1.82 1.42 1.34 1.50
NSAIDs 2.21 2.04 2.39 1.37 1.29 1.45
COX II inhibitors 1.81 1.51 2.17 1.42 1.24 1.62
Clopidogrel 2.04 1.68 2.48 1.70 1.49 1.93
Oral steroids 1.31 1.16 1.49 1.40 1.29 1.51 Anticoagulants 1.67 1.47 1.90 2.10 1.94 2.28
SSRIs 1.47 1.30 1.66 1.84 1.71 1.97
Other diagnoses
Aortic stenosis 1.79 1.41 2.26 1.46 1.23 1.75 Repair of AAA 1.33 0.87 2.04 1.27 0.95 1.68
Dialysis 5.56 2.95 10.48 2.92 1.94 4.41
Confounders
Previous upper GI procedure 0.88 0.80 0.98 1.20 1.13 1.28
PPI 0.82 0.74 0.91 2.01 1.90 2.13
Age 1.10 1.08 1.11 1.09 1.08 1.10
AAA, Abdominal aortic aneursym; SSRI, selective serotonin reuptake inhibitors.
aNongastrointestinal comorbidity is catogorized as: Charlon Index⫽0 is no comorbidity, Charlson Index⫽1 single or comorbidity, and Charlson
Index⫽2 is multiple or severe comorbidity.
CLINICAL
afield. The linked dataset used for our study remained
representative of the GPRD overall, as whole practices
rather than individual patients declined or consented to
the linkage. Consequently, we were able to estimate the
additional attributable fraction for comorbidity in the
English population that was not already attributable to
other risk factors.
19As our study was one of the first to assess the effect of the
burden of comorbidity as a risk factor for upper GIB, no
measure of comorbidity had been specifically validated for
this purpose. We decided to use the Charlson Index because
it is a well-validated score for measuring comorbidity in
many different contexts. Other comorbidity scores that
could be used, such as the Elixhauser Index or a simple
counts of diagnoses, have been used and validated less
fre-quently and in fewer contexts. In addition, some of the other
scores also include other outcomes, such as financial cost,
which are not necessarily a measure of the severity of disease.
The Charlson Index was therefore selected as the most
ap-propriate comorbidity score for our study.
[image:7.603.48.290.92.394.2]We do need to consider alternative explanations for our
observed association of comorbidity with upper GIB. A
po-tential weakness of our study is the inevitably imperfect data
on some recognized risk factors that might have caused us to
underestimate their importance. The GPRD contains
com-prehensive recording of all available diagnoses and
prescrip-tions. However, under-reporting is likely to have occurred for
H pylori
infection, NSAID use, alcohol, and smoking. In the
case of
H pylori, there was inevitable under-reporting because
there was no population screening. However, if the
under-reporting of
H pylori
infection was to explain our study’s
findings, it would have to be strongly associated with
co-morbidity, and the evidence for this is conflicting and
un-derpowered.
29,30In studies of ischemic heart disease, for
which there is the largest body of evidence, any significant
association with
H pylori
was minimal after adjustments for
confounding.
31In our study, the apparent protective effect of
H
pylori
after adjustments for confounding was not surprising
because
H pylori
will have been eradicated when found.
Table 4. Sequential Population Attributable Fractions for Nonvariceal Upper Gastrointestinal Hemorrhage (All Cases)
Sequential population attributable fractionsa,b
% 95% CI
Nongastrointestinal comorbidity 19.80 18.43 to 21.18 Gastrointestinal
Cirrhosis 0.49 0.41 to 0.57 Gastritis, duodenitis or esophagitis 1.98 1.66 to 2.30 Peptic ulcer 2.05 1.81 to 2.28
Helicobacter pylori ⫺0.04 ⫺0.15 to 0.08
Angiodysplasia 0.01 ⫺0.01 to 0.02 Mallory-Weiss syndrome 0.29 0.22 to 0.37 Crohn’s disease 0.14 0.08 to 0.19 GI cancer 1.11 0.96 to 1.27 Lifestyle
Alcohol use 2.89 2.39 to 3.39 Smoking 0.83 0.27 to 3.42 Medications
Aspirin 2.95 2.54 to 3.36 NSAIDs 3.07 2.72 to 3.42 COX II inhibitors 0.33 0.23 to 0.44 Clopidogrel 0.34 0.26 to 0.43 Oral steroids 0.59 0.44 to 0.74 Anticoagulants 1.19 1.04 to 1.35 SSRIs 1.58 1.36 to 1.80 Other diagnoses
Aortic stenosis 0.16 0.10 to 0.22 Repair of aorta 0.03 0.00 to 0.06 Dialysis 0.07 0.04 to 0.09
SSRI, selective serotonin reuptake inhibitors.
aAge, year, practice, and sex matched and adjusted for PPI use,
previous upper gastrointestinal procedures, and age.
bThe estimate in each row are calculated separately conditional on all
the other variables in the model. They should therefore not be inter-preted as summing over the column to 100%. Sequential PAF esti-mates the additional proportion of nonvariceal bleeding cases attrib-utable to each risk factor after cases attribattrib-utable to all the other risk factors in the model have been removed.
Table 5. Sequential Population Attributable Fractions for Nonvariceal Upper Gastrointestinal Hemorrhage Strafied by Coding for Peptic Ulcer
Sequential population attributable fractions,a,b%
Peptic ulcer
Nonpeptic ulcer
Nongastrointestinal comorbidity 18.44 20.50 Gastrointestinal
Cirrhosis 0.32 0.57
Gastritis, duodenitis, or esophagitis
0.69 2.74
Peptic ulcer 5.31 0.69
Helicobacter pylori 0.05 ⫺0.07
Angiodysplasia 0.01 0.00 Mallory-Weiss syndrome 0.06 0.39 Crohn’s disease 0.02 0.19
GI cancer 0.35 1.48
Lifestyle
Alcohol use 1.93 3.30
Smoking 0.80 0.81
Medications
Aspirin 3.99 2.42
NSAIDs 5.40 2.00
COX II inhibitors 0.47 0.28 Clopidogrel 0.38 0.35 Oral steroids 0.36 0.66 Anticoagulants 0.78 1.41
SSRIs 0.74 2.02
Other diagnoses
Aortic stenosis 0.22 0.12 Repair of aorta 0.02 0.03
Dialysis 0.09 0.05
SSRI, selective serotonin reuptake inhibitors.
aAge, year, practice, and sex matched and adjusted for PPI use,
previous upper gastrointestinal procedures and age.
bThe estimate in each row are calculated separately conditional on all
the other variables in the model. They should therefore not be inter-preted as summing over the column to 100%. Sequential PAF esti-mates the additional proportion of nonvariceal bleeding cases attrib-utable to each risk factor after cases attribattrib-utable to all the other risk factors in the model have been removed.
CLINICAL
[image:7.603.304.545.336.657.2]NSAID use might also have been under-reported, as
NSAIDs can be bought over the counter from a pharmacy
without a prescription, potentially explaining the low
asso-ciation between NSAIDs and bleeding in our study
com-pared with a previous meta-analysis.
20However, we had
higher recorded NSAID use than was reported in a recent
national audit,
32and the studies used in the meta-analysis
excluded patients with other known GIB risk factors.
20When we made the same exclusions in our study (
Supple-mentary Table 2
), or restricted to peptic ulcers, the
associa-tion of bleeding with NSAIDs increased and became
com-parable with figures in the literature. With regard to
over-the-counter use, nondifferential under-reporting has been
shown to reduce the measured effect of prescribed
medica-tions.
33In our study, this would cause an underestimate of
the effect of NSAIDs. However, in England, certain groups
receive free prescriptions, such as patients older than 65
years or those with certain chronic diseases, and these groups
have been shown to purchase far fewer medications over the
counter than those who have to pay for prescriptions.
34,35When we restricted our analysis to those older than 65 years,
thereby reducing confounding by over-the-counter
medica-tions, we found only a small reduction in the estimated PAF
for comorbidity, but no change in PAF for NSAIDs. The
final area of under-reporting that could affect our study was
missing data for alcohol and smoking status, but these
variables were not strong confounders of the association
between comorbidity and bleeding and there was only a
minimal effect on the PAF of comorbidity when missing
data were imputed conditional on all available data and
socioeconomic status.
We therefore believe that potential under-reporting of
exposures does not explain the association we found
be-tween upper GIB and a general measure of comorbidity.
This suggests that comorbidity itself, or other factors not
included in our study that are associated with
comorbid-ity, might be causing the association. It is possible that
other medications not included in the study were
respon-sible for some of this association, however, we are not
aware of any additional prescribed or nonprescribed
med-ication that would fulfill the requirements of common
usage and a strong association with bleeding. Historically,
nongastrointestinal comorbidity itself was commonly
rec-ognized as a risk factor for upper GIB.
7However, the
concept of “stress ulceration” is no longer accepted, aside
from patients on ITU who are exposed to severe acute
physiological stresses from ventilation, coagulopathy,
liver failure, renal failure, septic shock, or nutritional
support.
9The physiological effects from chronic
comor-bidities in our study are unlikely to be as severe as those
that occur on ITU and, therefore, what we are describing
is likely to have a different mechanism than that seen in the
ITU setting. Many potential mechanisms for our observed
association can be hypothesized; for example, reduced
epi-thelial microperfusion in cardiac failure,
36decreased oxygen
levels in chronic obstructive pulmonary disease,
37,38poor
nutritional status in many diseases, or the platelet and
clot-ting dysfunction in end-stage renal failure.
27,39However, it is
unlikely that there is a single mechanism that accounts for
the association we found, but rather that multiple illnesses
and mechanisms have a cumulative effect. This was shown
by the graded effect of the Charlson Index and by
Table 6
, in
which no individual disease accounted for the magnitude of
the overall association with comorbidity.
Our findings contrast with current beliefs that the main
burden of bleeding in the general population comes from
known iatrogenic causes, such as NSAIDs prescribed for
analgesia or antiplatelet agents prescribed for cardiac and
cerebrovascular disease,
40and that this burden would be
reduced by increasing PPI use.
41Instead, we have
demon-strated that the extra contribution of these medications to
bleeding cases was not large after considering the
contri-Table 6. The AdjustedaAssociation of the Component Comorbidities of Charlson Index With Nonvariceal Bleeding
Proportion of
cases exposed,% ORa
Lower 95% CI
Upper
95% CI PAF,b%
Myocardial infarction 13.98 1.04 0.97 1.10 0.12 Congestive cardiac disease 19.90 1.49 1.41 1.58 1.95 Peripheral vascular disease 11.17 1.31 1.23 1.41 0.70
Dementia 8.98 1.40 1.30 1.50 1.00
Chronic pulmonary disease 31.80 1.11 1.06 1.16 1.10 Cerebrovascular disease 23.1 1.13 1.08 1.19 0.80 Rheumatological disease 10.13 1.06 0.99 1.13 0.17 Uncomplicated diabetes 17.88 1.01 0.96 1.06 0.04
Hemiplegia 4.73 1.79 1.62 1.97 0.67
Renal disease 14.42 1.71 1.61 1.82 1.74
Diabetes with complications 12.30 1.00 0.94 1.06 ⫺0.01
Any malignancy 13.11 1.21 1.14 1.28 0.78
Lymphoproliferative disorders 2.21 1.95 1.70 2.24 0.43 Metastatic solid tumour 5.89 2.35 2.14 2.57 1.29
HIV/AIDS 0.06 0.69 0.31 1.55 ⫺0.00
HIV/AIDS, human immunodeficiency virus/acquired immunodeficiency syndrome.
aAdjusted for all other variables in this Table andTable 2and matched for year, practice, and sex.
bSequential population attributable fractions: The estimates in each row are calculated separately conditional on all the other variables in the
model. They should therefore not be interpreted as summing over the column to 100%. Sequential PAF estimates the additional proportion of nonvariceal bleeding cases attributable to each risk factor after cases attributable to all the other risk factors in the model have been removed.
CLINICAL
[image:8.603.48.546.68.251.2]butions of other risk factors present in the population.
Therefore, simply increasing PPI prescriptions in patients
on high-risk medications might not have as large an
impact as previously thought.
In conclusion, the largest measurable burden of upper
gastrointestinal hemorrhage in this study was attributed
to nongastrointestinal comorbidity. In a proportion of
patients, a bleed is an indicator of the burden of their
comorbidity, and recognizing this will help guide
man-agement, particularly in the absence of modifiable
gastro-intestinal risk factors. However, our finding also explains
why the incidence of nonvariceal bleeding is likely to
remain high in an aging population, thereby necessitating
continued acute gastroenterology service provision.
Supplementary Material
Note: To access the supplementary material
accompanying this article, visit the online version of
Gastroenterology
at
www.gastrojournal.org
, and at
http://
dx.doi.org/10.1053/j.gastro.2013.02.040
.
References
1. Yeomans ND. The ulcer sleuths: the search for the cause of peptic ulcers. J Gastroenterol Hepatol 2011;26(Suppl 1):35– 41. 2. Sung JJY, Kuipers EJ, El-Serag HB. Systematic review: the global
incidence and prevalence of peptic ulcer disease. Aliment Phar-macol Ther 2009;29:938 –946.
3. Williams JG, Roberts SE, Ali MF, et al. Gastroenterology services in the UK. The burden of disease, and the organisation and delivery of services for gastrointestinal and liver disorders: a review of the evidence. Gut 2007;56(Suppl 1):1–113.
4. Peery AF, Dellon ES, Lund J, et al. Burden of gastrointestinal disease in the United States: 2012 update. Gastroenterology 2012;143:1179 –1187.e3.
5. Lewis JD, Bilker WB, Brensinger C, et al. Hospitalization and mortality rates from peptic ulcer disease and GI bleeding in the 1990s: relationship to sales of nonsteroidal anti-inflammatory drugs and acid suppression medications. Am J Gastroenterol 2002;97:2540 –2549.
6. Crooks CJ, West J, Card TR. Upper gastrointestinal haemorrhage and deprivation: a nationwide cohort study of health inequality in hospital admissions. Gut 2012;61:514 –520.
7. Breckenridge IM, Walton EW, Walker WF. Stress ulcers in the stomach. BMJ 1959;2(5163):1362–1360.
8. Fleming KM, Aithal GP, Card TR, et al. The rate of decompensation and clinical progression of disease in people with cirrhosis: a cohort study. Aliment Pharmacol Ther 2010;32:1343–1350. 9. Cook DJ, Fuller HD, Guyatt GH, et al. Risk factors for
gastrointes-tinal bleeding in critically ill patients. Canadian Critical Care Trials Group. N Engl J Med 1994;330:377–381.
10. Gallerani M, Simonato M, Manfredini R, et al. Risk of hospitaliza-tion for upper gastrointestinal tract bleeding. J Clin Epidemiol 2004;57:103–110.
11. Hollowell J. The General Practice Research Database: quality of morbidity data. Popul Trends 1997;87:36 – 40.
12. Jick H, Jick SS, Derby LE. Validation of information recorded on general practitioner based computerised data resource in the United Kingdom. BMJ 1991;302(6779):766 –768.
13. Herrett E, Thomas SL, Schoonen WM, et al. Validation and validity of diagnoses in the General Practice Research Database: a sys-tematic review. Br J Clin Pharmacol 2010;69:4 –14.
14. Crooks CJ, Card TR, West J. Defining upper gastrointestinal bleeding from linked primary and secondary care data and the effect on occur-rence and 28 day mortality. BMC Health Serv Res 2012;12:392.
15. García Rodríguez LA, Barreales Tolosa L. Risk of upper gastrointes-tinal complications among users of traditional NSAIDs and COXIBs in the general population. Gastroenterology 2007;132:498 –506. 16. Margulis AV, García Rodríguez LA, Hernández-Díaz S. Positive
predictive value of computerized medical records for uncompli-cated and compliuncompli-cated upper gastrointestinal ulcer. Pharmacoepi-demiol Drug Saf 2009;18:900 –909.
17. Charlson MEE, Pompei P, Ales KLL, et al. A new method of classifying prognostic comorbidity in longitudinal studies: devel-opment and validation. J Chronic Dis 1987;40:373–383. 18. Stine RA. Graphical interpretation of variance inflation factors. Am
Stat 1995;49:53.
19. Eide G. Sequential and average attributable fractions as aids in the selection of preventive strategies. J Clin Epidemiol 1995;48:645–655. 20. Hernandez-Diaz S, Rodriguez LAG. Association between nonsteroidal anti-inflammatory drugs and upper gastrointestinal tract bleeding/ perforation: an overview of epidemiologic studies published in the 1990s. Arch Intern Med 2000;160:2093–2099.
21. Dalton SO, Johansen C, Mellemkjaer L, et al. Use of selective serotonin reuptake inhibitors and risk of upper gastrointestinal tract bleeding: a population-based cohort study. Arch Intern Med 2003;163:59 – 64.
22. van Walraven C, Mamdani MM, Wells PS, et al. Inhibition of serotonin reuptake by antidepressants and upper gastrointestinal bleeding in elderly patients: retrospective cohort study. BMJ 2001;323(7314):655– 658.
23. Weil J. Peptic ulcer bleeding: accessory risk factors and interac-tions with non-steroidal anti-inflammatory drugs. Gut 2000;46: 27–31.
24. Kelly JP, Kaufman DW, Koff RS, et al. Alcohol consumption and the risk of major upper gastrointestinal bleeding. Am J Gastroen-terol 1995;90:1058 –1064.
25. Lanas A, Fuentes J, Benito R, et al. Helicobacter pylori increases the risk of upper gastrointestinal bleeding in patients taking low-dose aspirin. Aliment Pharmacol Ther 2002;16:779 –786. 26. Stack WA, Atherton JC, Hawkey GM, et al. Interactions between
Helicobacter pylori and other risk factors for peptic ulcer bleeding. Aliment Pharmacol Ther 2002;16:497–506.
27. Fiaccadori E, Maggiore U, Clima B, et al. Incidence, risk factors, and prognosis of gastrointestinal hemorrhage complicating acute renal failure. Kidney Int 2001;59:1510 –1519.
28. Al-Mallah M, Bazari R, Jankowski M, et al. Predictors and outcomes associated with gastrointestinal bleeding in patients with acute cor-onary syndromes. J Thromb Thrombolysis 2007;23:51–55. 29. Franceschi F, Gasbarrini A. Helicobacter pylori and extragastric
diseases. Best Pract Res Clin Gastroenterol 2007;21:325–334. 30. Chen Y, Segers S, Blaser MJ. Association between Helicobacter pylori and mortality in the NHANES III study. Gut 2013 Jan 16. [Epub ahead of print].
31. Wald NJ, Law MR, Morris JK, et al. Helicobacter pylori infection and mortality from ischaemic heart disease: negative result from a large, prospective study. BMJ 1997;315(7117):1199 –1201. 32. Hearnshaw SA, Logan RFA, Lowe D, et al. Acute upper
gastroin-testinal bleeding in the UK: patient characteristics, diagnoses and outcomes in the 2007 UK audit. Gut 2011;60:1327–1335. 33. Yood MU, Campbell UB, Rothman KJ, et al. Using prescription
claims data for drugs available over-the-counter (OTC). Phar-macoepidemiol Drug Saf 2007;16:961–968.
34. Hopper S, Pierce M. Aspirin after myocardial infarction: the importance of over-the-counter use. Fam Pract 1998 15(Suppl 1):S10–S13. 35. Bedson J, Whitehurst T, Lewis M, Croft P. Factors affecting
over-the-counter use of aspirin in the secondary prophylaxis of cardio-vascular disease. Br J Gen Pract 2001;51(473):1001–1003. 36. De Backer D, Creteur J, Dubois MJ, et al. Microvascular
altera-tions in patients with acute severe heart failure and cardiogenic shock. Am Heart J 2004;147:91–99.
37. Christensen S, Thomsen RW, Torring, et al. Impact of COPD on outcome among patients with complicated peptic ulcer. Chest 2008;133:1360 –1366.
CLINICAL
38. Huang K-W, Luo J-C, Leu H-B, et al. Chronic obstructive pulmonary disease: an independent risk factor for peptic ulcer bleeding: a nationwide population-based study. Aliment Pharmacol Ther 2012;35:796 – 802.
39. Luo J-C, Leu H-B, Huang K-W, et al. Incidence of bleeding from gastroduodenal ulcers in patients with end-stage renal disease receiving hemodialysis. CMAJ 2011;183:E1345–E1351. 40. Lin KJ, Hernández-Díaz S, García Rodríguez LA. Acid suppressants
reduce risk of gastrointestinal bleeding in patients on antithrombotic or anti-inflammatory therapy. Gastroenterology 2011;141:71–79. 41. van Soest EM, Valkhoff VE, Mazzaglia G, et al. Suboptimal
gas-troprotective coverage of NSAID use and the risk of upper gastro-intestinal bleeding and ulcers: an observational study using three European databases. Gut 2011;60:1650 –1659.
Received November 2, 2012. Accepted February 27, 2013.
Reprint requests
Address requests for reprints to: Colin Crooks, MSc, The University of Nottingham, Division of Epidemiology and Public Health, Clinical
Sciences Building, Nottingham City Hospital, Nottingham, NG5 1PB UK. e-mail:colin.crooks@nottingham.ac.uk; fax:ⴙ0115 823 0214.
Conflicts of interest
This author discloses the following: Timothy Richard Card is married to an employee of Takaeda Pharmaceuticals (recently changed jobs from AstraZeneca). The remaining authors disclose no conflicts.
Funding
This work was supported by personal fellowships: Colin Crooks is a research fellow and gastroenterology trainee supported by a Medical Research Council Population Health Scientist fellowship (grant number G0802427), Tim Card is a Clinical Associate Professor and Consultant Gastroenterologist supported by Nottingham University and the National Health Service, and Joe West is a Clinical Associate Professor, Reader in Epidemiology, and Consultant Gastroenterologist supported by a University of Nottingham/Nottingham University Hospitals NHS Trust Senior Clinical Research fellowship. These funding bodies had no role in the study design, or the collection, analysis, or interpretation of data.
CLINICAL
Supplementary Table 1. Proportion of Cases Exposed 2 Months Before Bleed Date or Match Date Stratified by Coded Peptic Ulcer
Peptic ulcer coded,n
Exposed,
%
No peptic ulcer coded,n
Exposed,
%
Charlson index⫹
No comorbidity 883 18.3 2557 22.2
Single comorbidity 916 19.0 2306 20.0
Multiple or severe 3024 62.7 6669 57.8
Gastrointestinal
Cirrhosis—none coded 4753 98.5 11,251 97.6
Cirrhosis only 17 0.4 46 0.4
Cirrhosis—varices 8 0.2 57 0.5
Cirrhosis—ascites 32 0.7 140 1.2
Cirrhosis—encephalopathy 13 0.3 38 0.3
Gastritis, duodenitis, or esophagitis 710 14.7 2341 20.3
Peptic ulcer 864 17.9 988 8.6
Helicobacter pylori 162 3.4 447 3.9
Angiodysplasia 1 0.0 5 0.0
Mallory-Weiss syndrome 11 0.2 85 0.7
Crohn’s disease 19 0.4 95 0.8
GI cancer 254 5.3 920 8.0
Lifestyle
Alcohol—not coded 3299 68.4 7727 67.0
Alcohol—non-drinker 97 2.0 278 2.4
Alcohol—ex-drinker 20 0.4 44 0.4
Alcohol—mentioned 284 5.9 693 6.0
Alcohol—over limits 1105 22.9 2658 23.0
Alcohol—complications 18 0.4 132 1.1
Smoking—not coded 2753 57.1 6434 55.8
Smoking—nonsmoker 646 13.4 1686 14.6
Smoking—ex-smoker 288 6.0 600 5.2
Smoking—passive 405 8.4 1050 9.1
Smoking—current 731 15.2 1762 15.3
Medications
Aspirin 1831 38.0 3561 30.9
NSAIDs 1431 29.7 2467 21.4
COX II inhibitors 222 4.6 383 3.3
Clopidogrel 198 4.1 470 4.1
Oral steroids 428 8.9 1150 10.0
Anticoagulants 427 8.9 1190 10.3
SSRIs 460 9.5 1565 13.6
Other diagnoses
Aortic stenosis 125 2.6 225 2.0
Repair of AAA 36 0.7 79 0.7
Dialysis 30 0.6 58 0.5
Confounders
Previous upper GI procedure 817 16.9 2621 22.7
Previous PPI use 906 18.8 3679 31.9
Age (median and interquartile range) 75 64–83 72 54–82
AAA, Abdominal aortic aneurysm; SSRI, selective serotonin reuptake inhibitors.
aNongastrointestinal comorbidity is catogorized as: Charlon Index⫽0 is no comorbidity, Charlson Index⫽1 single or comorbidity, and Charlson
Supplementary Table 2. The Association of Medications With Upper Gastrointestinal Bleeding After Excluding Patients With Nonmedication Risk Factors (Age, Year, Practice, and Sex Matched)
Crude OR
Adjusteda
OR
Lower 95% CI
Upper 95% CI
Aspirin 2.39 1.73 1.60 1.87 NSAIDs 2.80 1.78 1.64 1.93 COX II inhibitors 2.59 1.50 1.23 1.83 Clopidogrel 7.30 2.15 1.70 2.73 Oral steroids 1.23 1.23 1.08 1.41 Anticoagulants 4.83 2.26 1.99 2.57 SSRIs 2.78 1.52 1.34 1.71
SSRI, selective serotonin reuptake inhibitors.
aAdjusted for all other variables in Table and inFigure 1.
Supplementary Table 3. Sequential Population Attributable Fractions for Nonvariceal Upper Gastrointestinal Hemorrhage (NSAIDS Prescribed Between 1 Month and 1 Year Before Bleed)
Sequential population attributable
fractions,a,b%
Nongastrointestinal comorbidity 19.92 Gastrointestinal
Cirrhosis 0.48
Gastritis, duodenitis, or esophagitis 1.86
Peptic ulcer 2.01
Helicobacter pylori ⫺0.06
Angiodysplasia 0.01 Mallory-Weiss syndrome 0.28 Crohn’s disease 0.14
GI cancer 1.09
Lifestyle
Alcohol use 2.83
Smoking 0.93
Medications
Aspirin 2.91
NSAIDs 3.18
COX II inhibitors 0.36
Clopidogrel 0.32
Oral steroids 0.58 Anticoagulants 1.11
SSRIs 1.60
Other diagnoses
Aortic stenosis 0.16 Repair of aorta 0.02
Dialysis 0.06
SSRI, selective serotonin reuptake inhibitors.
aAge, year, practice, and sex matched and adjusted for PPI use,
previous upper gastrointestinal procedures, and age.
bThe estimate in each row are calculated separately conditional on all