Handwriting automaticity: the search for performance thresholds
Published as: Medwell, J. & Wray, D. (2014) ‘Handwriting automaticity: the search for performance thresholds’, Language and Education. Vol. 28 (1), pp 34-51.
http://www.tandfonline.com/doi/abs/10.1080/09500782.2013.763819
Abstract
Although handwriting has a fairly low status in literacy education, evidence is accumulating that it has an important role in written composition. In particular, handwriting automaticity appears to relate to success in composition. This relationship has been little explored in British contexts and we currently have little idea of what threshold performance levels might be. In this paper we report on two linked studies which attempted to identify performance levels in handwriting automaticity for children at two ages, below which their success in writing composition might be considered to be at risk. We conclude by suggesting
interpolated levels for children at different ages, although we recognise the tentative nature of these suggestions.
Introduction
As we argued in a previous paper (Medwell & Wray, 2008), handwriting has had a relatively low status in literacy education. Both its pedagogy and understandings of its role in the development of writing as a whole are still somewhat underdeveloped, and in our 2008 paper we argued for a re-assessment of the importance of handwriting as a key aspect of the
development of writing, in particular the development of writing composition. An important element to this re-assessment is, we argued, a more developed understanding on the part of teachers and schools of what aspects of handwriting are important and what useful
development in handwriting might look like. We reviewed current practice in terms of the assessment of handwriting and made the following points:
ages, up to 3 marks can be awarded for handwriting. The assessment for these three marks is made on a sample of handwriting done during a
composition assessment and the criteria include letter formation, orientation, relative size and fluency. As this is a product analysis, fluency must be taken to mean evidence of the effective joining of letters. Speed of writing is not included in the assessment. In short, this is an assessment of handwriting style, not of handwriting efficiency. (Medwell & Wray, 2008, 34.)
On the basis of existing and continuing research into the development and effects of
handwriting, it seemed there was a need to establish more robust and effective assessments, and to explore some aspects of what development in handwriting, particularly in
automaticity, might look like.
The aim of the current paper is to report on two linked studies which have explored
relationships between handwriting automaticity and writing composition in Year 2 (6-7 year old) children (Study 1) and Year 6 (10-11 year old) children (Study 2). A key objective of both these studies was the establishment, if possible, of some clear indicators of the level of handwriting automaticity which was likely to cause major difficulties for children in writing composition. In short, we have been searching for cut off points for variously aged children below which the likelihood would be that these children would struggle to achieve expected levels of performance in writing more generally.
To contextualise these studies, we will first review the evidence that handwriting
automaticity is implicated in success in writing composition. In our earlier paper, we briefly explored the key role of working memory in writing development, and in this paper we will elaborate that discussion to make the point that levels of automaticity in handwriting can impact negatively or positively upon success in writing composition. Part of our argument will be that this aspect of writing has been overlooked by both teachers and researchers for many years, to the detriment of writing development among school-aged children.
Handwriting is a language act
characterised as merely transcription. This has often meant that it has not been viewed as intrinsic to composing, but as a presentation skill. In England, the National Curriculum English requirements (DfEE/QCA, 2000) concentrate on the formation and orientation of letters in handwriting and speed is mentioned only for typing. The recent draft proposals for revised National Curriculum requirements for English (DfE, 2012) do mention speed as one element of handwriting, although the bulk of the requirements refer to letter formation. For Year 5 /6 children (9 to 11 year olds), the target is stated that children should “write legibly, fluently, with increasing speed and personal style” (p. 23). Yet research suggests that fast, automatic handwriting may have a significant effect on children’s composing, and it is automaticity which appears to matter more than simple speed.
One issue emerging from a US programme of research (e.g. Berninger et al, 2006; Berninger & Graham, 1998) is the recognition that handwriting is not simply a motor act. Berninger and Graham (1998) stress that it is “language by hand” and their research suggests that
orthographic and memory processes (the ability to recall letter shapes) contribute more to handwriting than do motor skills (Berninger & Amtmann, 2004). Handwriting does not merely involve training the hand; it involves training the memory and hand to work together to generate the correct mental codes for production of letters and translate these into motor patterns of letters - automatically and without effort! If this is the case, then handwriting is important in writing as a language act, rather than just a motor act used to record writing. It may, therefore, be that focusing exclusively upon letter formation, neatness, and even speed, may be dealing with only a small part of the importance of handwriting in writing.
mental plans and revising text against these plans. It may be that handwriting can “crowd out” composing processes.
One way of managing limited working memory capacity is to make some processes, such as handwriting, automatic, that is, done without the need for conscious attention (La Berge & Samuels, 1974). This frees up cognitive resources to deal with higher level processes. The development of skill in writing may require the automatization of lower-level skills so that they use less of the available working-memory resources. Some research even suggests that automatic letter writing is the single best predictor of length and quality of written
composition in the primary years (Graham et al, 1997), and in secondary and
post-compulsory education (Connelly et al, 2006; Jones, 2004; Peverley, 2006). However, we do not know when handwriting typically becomes automatic for children, in terms of age or rate of letter production. As we have seen, UK national testing does not currently assess
handwriting automaticity and addresses only writing style and neatness. It seems likely, therefore, that we are currently failing to assess an important aspect of writing, even though researchers such as Connelly et al (2006) have offered convincing evidence that, for many children, handwriting continues to be a demanding activity into the secondary years and beyond.
A number of children experience difficulties with handwriting throughout their schooling, although estimates vary of how many children are thus affected. Estimates range from as high as 44% (Alston, 1985; Rubin & Henderson, 1982) to as low as 12 - 22% (Graham and
Weintraub, 1996). These figures suggest that lack of handwriting automaticity may affect a significant number of primary and secondary aged children.
Australian studies (Jones & Christensen 1999; Christensen, 2005) have used a simple alphabet writing task, first designed by Berninger, Mitokawa & Bragg (1991), to measure orthographic-motor integration (the ability to generate the mental patterns and motor codes necessary to write letters) and to identify children with automaticity problems. It emerged that, for 7 year olds, more than half the variance in their scores on written expression could be accounted for by orthographic-motor integration, even when reading scores were
controlled. Studies have also experimented with the removal of some of the competing demands for children’s cognitive attention during writing. De La Paz and Graham (1995), for
them from the task of handwriting, the quality of their composition significantly improved. (See also Hidi & Hidyard, 1983; McCutchen, 1996, 1998; Scardamalia et al, 1982).
The present studies
The work of Jones and Christensen (1999) in Australia and of US researchers (Graham et al, 1997; Berninger, Mitokawa and Bragg, 1991) suggests a strong relationship between
automaticity in handwriting and successful composition. It is important to explore whether these findings can be generalised to the British context, where the extent of difficulty with handwriting is as yet undetermined and children tend to learn a simpler writing script than those generally taught in the USA. One small study of a mixed age sample (Connelly and Hurst, 2001) has tentatively suggested that this link between handwriting automaticity and composition is likely to be true for England.
The studies reported here used larger samples focussed on two age groups, study 1 involving 6-7 year old children and study 2 involving 10-11 year olds.
These studies aimed to explore the extent of handwriting difficulties by looking at levels of automaticity in school children at the two age points. This was seen as a first step towards the development of a screening instrument that could identify children with handwriting
difficulties who might benefit from targeted interventions to improve automatic letter production.
In both studies we addressed the question of how children’s handwriting speed and letter generation were related to their composition. To do this, we examined children’s national test scores for composition (excluding spelling and handwriting) and compared these to measures of handwriting.
Study 1 – 7 year olds
The sample was composed of 186 Year 2 pupils in four randomly selected primary schools in the Midlands of England.
• The mean age of the sample was 7:6.
• 87% were recorded as White British, somewhat higher than the 79% of children so
recorded in the total primary school population of England (DfES/Ofsted, 2006). • The remaining 13% belonged to other ethnic groups.
• The children came from a range of economic backgrounds and 17% were entitled to a free school meal, close to the national average of 18% (DfES/Ofsted, 2006) (The proportion of pupils receiving free school meals is commonly used in the UK as a measure of social deprivation in schools).
• 20% were on the special needs register within their school, close to the 21% of
children with special educational needs (SEN) nationally (DfES/Ofsted, 2006). • 11% were left handed (as reported by the teachers), compared to the 10-15% of the
population of England who are left handed (Bentley and Stainthorp, 1993)
This data suggests, therefore, that these children were not particularly “different” from the
national population.
Measures of composition
The writing of these children was assessed as part of the statutory national assessment at the end of Y2 (age 6-7). Assessment of composition required the writing of two pieces - a longer and a shorter piece, of two contrasting text types. The pieces were marked by teachers using task specific criteria which offered 30 marks for composition, broken down as follows:
Longer task (possible 18 marks)
Sentence structure- up to 4 marks Punctuation - up to 4 marks
Composition and effect- up to 10 marks
Shorter Task (possible 12 marks)
Sentence structure and punctuation- up to 5 marks Composition and effect- up to 7 marks
Measures of handwriting
Three measures of handwriting were used, to address different aspects of handwriting ability.
Measure 1 (Handwriting SAT)
Handwriting style and neatness while composing is statutorily assessed as part of the national Standard Assessment Tasks (SAT) and up to three marks can be awarded for handwriting using the following criteria:
1 Mark: Writing is legible, letters are usually correctly formed and orientated. Generally, upper and lower case letters are not mixed within the word.
2 Marks: Letters are correctly formed and oriented. Writing may be in a controlled printed style, with letters generally neat and regular in size, and ascenders and descenders usually distinguished. Alternatively, there may be evidence of the ability to join letters, although this detracts from the overall regularity of the handwriting.
3 Marks: Letters correctly formed and orientated. Handwriting is neat and regular in size, with ascenders and descenders usually distinguished. There is evidence of fluency and the ability to join letters.
The assessment for these three marks is made on a sample of handwriting done during a composition assessment and is a product analysis. Fluency is taken to mean evidence of the effective joining of letters. Speed of writing or efficiency of letter generation is not included in the assessment.
Measure 2 (Handwriting speed)
were counted and the tests were each marked by two separate markers, generating a high level of inter-marker reliability (r=0.99, using Pearson’s product moment correlation).
Measure 3 (Alphabet Task- Handwriting Automaticity)
Orthographic-motor integration of handwriting involves mentally coding visual
representations of letter patterns and integrating them with motor patterns (Berninger, 1994) and the level of automaticity at which this could be achieved was measured using an alphabet writing task described by Berninger, Mitzokawa and Bragg (1991). This task involved
writing in lower-case as many letters of the alphabet in order as possible in one minute. Children who completed all 26 letters in lower case continued the task using upper-case. Although children have plenty of opportunity to write all these letters in the course of their school work, they rarely write the whole alphabet from memory in sequence, so this task is not well rehearsed and demands organization and retrieval of letter forms in visual memory as well as the generation of the relevant motor patterns.
Scores were calculated by counting letters which were recognisable out of the context of the rest of the writing. Omissions, reversals, transpositions (of case) and substitutions did not count towards children’s scores. Scores were given in alphabet letters per minute (ALPM).
Each test was marked by two separate markers and a high level of inter- marker reliability obtained (r=0.98, using Pearson’s product moment correlation).
Findings
The range of scores on the Alphabet Task was 3-44 alphabet letters per minute (ALPM) with a mean of 16.7 (SD=8.4). This is directly comparable with the findings of Jones and
Christensen (1999) who found, for children the same age, a range of 3-32, a mean of 18.0 (SD=5.8). The English children produced a wider range of performance on this task.
In the Handwriting SAT, 30.6% of children scored 1 point, 43.0% two points and 21.5% three points. The mean was 1.9. This shows a surprisingly large number of children still struggling with orientation and regularity of letter formation but in the absence of data about targets or teacher expectations in this area it is not possible to know whether this is a matter for concern.
The range for composition was 3-29, with a mean of 18.0 (SD=6.0). The sample seems to have been close to the national average in their writing outcomes with 69% of pupils achieving level 2b or above in writing, where the national average was 62% (DfES/Ofsted, 2006).
The relationship between handwriting and composition
The full correlation matrix (Appendix 1) shows a very high correlation between performance on the Alphabet Task and Composition (r=.58). Alphabet Task performance accounted for 34% of the variance in composition for these children. This is higher than the correlation for speed alone (Handwriting Speed Test) at r=.44 or the correlation with neatness and letter formation (indicated by the handwriting SAT score) of r=.54. The Handwriting Speed Test involves copying and is a pure measure of speed, which may well contribute to composition by allowing the child to write more in a given time. However, the Alphabet Task measures the mental generation and motor production of the letter symbols and it is automatic performance at this orthographic–motor integration which may account for its stronger prediction of composition quality because it frees up the working memory to focus on composing. Speed alone is not enough.
Stepwise multiple regression of handwriting predictors of composition
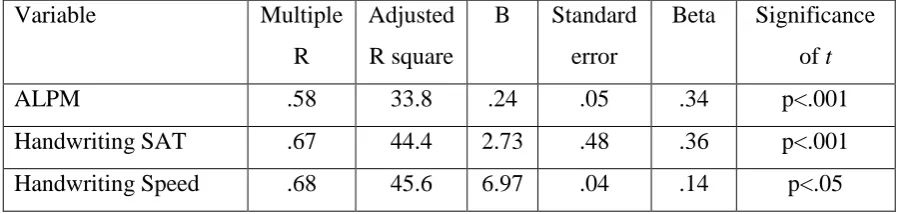
A multiple regression analysis of the three handwriting predictors of composition is presented in Table 1. The Alphabet Task is entered first because it is the best single predictor of
[image:10.595.65.518.362.469.2]composition. The scores on the Alphabet Task and the Handwriting Speed Test are highly correlated (r=0.60) but not synonymous. Thus adding Handwriting Speed to the regression increases the multiple r to .67, explaining an additional 10% of the variance in composition. Handwriting Speed may well contribute to composition by allowing the child to write more in a given time. Finally the Handwriting SAT makes only a minimal addition to the prediction of composition, explaining just an additional 1.2% of the variance.
TABLE 1: Stepwise multiple regression of handwriting measures against composition score (Study 1)
Variable Multiple
R
Adjusted R square
B Standard error
Beta Significance of t
ALPM .58 33.8 .24 .05 .34 p<.001
Handwriting SAT .67 44.4 2.73 .48 .36 p<.001
Handwriting Speed .68 45.6 6.97 .04 .14 p<.05
Causal relationship between ALPM and composition
(working towards 1), Level 1, Level 2c, Level 2b, level 2a or Level 3.The following standard scale of points is used to convert the levels to scores: W=3, 1=9, 2c=13, 2b=15, 2a=17, 3=21.
Reading score is a good predictor of both composition (r=.84) and performance on the Alphabet Task (r=.55) so is a relevant control variable. The zero-order correlation of ALPM and composition is 0.58 (see Table 2). After controlling for reading score, the partial r drops slightly to 0.43, but remains highly statistically significant (p<.001). Thus there is a strong relationship between ALPM and composition even when variation in reading attainment is accounted for. This is important since it establishes that the correlation between performance on the Alphabet Task and composition is not simply mediated by both being related to good reading. It does not definitively establish that low handwriting automaticity causes poor composition, but it makes it more likely that there is some direct association in the correlation.
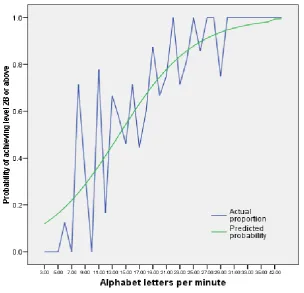
When lack of automaticity is a problem
It is important to establish if there is a threshold of automatic letter production for children of this age, below which a lack of automaticity has a particularly negative impact on
composition quality. Our approach to identifying a threshold level of automaticity was to look at the relationship of Alphabet scores with an external criterion. For 7 year olds, the national expectation is that the typical pupil should achieve level 2B in writing. A logistic regression was computed to identify the relationship between ALPM and the probability of achieving Level 2B or above in the national writing test. Figure 1 gives a graphical
FIGURE 1: Logistic regression of ALPM against the probability of achieving Level 2B or above in the KS1 writing test
The results reveal that for a pupil achieving a score of 12 ALPM on the Alphabet Task the predicted probability of achieving Level 2B or above falls to 40%. This is a level where children in our sample may be ‘at risk’ of not achieving level 2B. Our sample is close to the
national average in terms of their writing attainment, with 58% of pupils achieving level 2B or above compared to the 2006 national average of 60%. The results are therefore suggestive for the general population.
Study 2 – 11 year olds
The Sample
The sample was composed of 198 Y6 pupils from four randomly selected primary schools in the Midlands of England.
• It included 101 boys (51%) and 97 girls (42%) • The mean age of the sample was 11:1.
• 86% were recorded as White British, compared to 79% of children so recorded in the total primary school population of England (DfES/Ofsted, 2006).
• The remaining 14% were from a range of other ethnic groups.
• The children came from a range of economic backgrounds and 18% were entitled to a
free school meal, the same as the national primary school average (DfES/Ofsted, 2006).
• Forty-three pupils (21%) were recorded as having special educational needs (SEN),
the same as the national proportion of pupils (DfES/Ofsted, 2006).
• 22% were left handed (as reported by the teachers), compared to 10-15% of the
population of England (Bentley and Stainthorp, 1993).
Again, this data suggests that these children were not particularly “different” from their average counterparts elsewhere in the country.
Measurement of composition
The writing of all the children in the sample was assessed as part of the statutory national testing at the end of Y6 (age 10-11). Assessment of composition required the writing of two pieces - a longer and a shorter piece, of two contrasting text types. These pieces were marked by external markers (and nationally moderated) using task specific criteria which offered 40 marks for composition, broken down as follows:
Longer task (possible 28 marks)
Shorter Task (possible 12 marks)
Sentence structure, punctuation and text organisation - up to 4 marks Composition and effect- up to 8 marks
Measurement of handwriting
The three measures of handwriting used in the study were the same as those used in Study 1.
Measure 1 (Handwriting SAT)
The rubric for awarding marks for handwriting as part of the national test is slightly different from that used with the younger children, although, again, up to three marks can be awarded using the following criteria:
1 Mark: The handwriting is legible and shows some features of regularity in size and spacing. However, overall the script is disjointed and uneven.
2 Marks: Overall, the handwriting is regular with some flow and movement. Letters and words are usually appropriate in size and position but there is some variation.
3 Marks: The handwriting is consistent and fluent with letters and words appropriately placed. The handwriting maintains a personal style to engage the reader.
Measure 2 (Handwriting speed)
Copying test (Wallen et al., 1996): (“The quick brown fox jumps over the lazy dog.”) giving a score in letters per minute (LPM).
Measure 3 (Alphabet Task)
The alphabet writing task giving a score of alphabet letters per minute (ALPM).
Findings
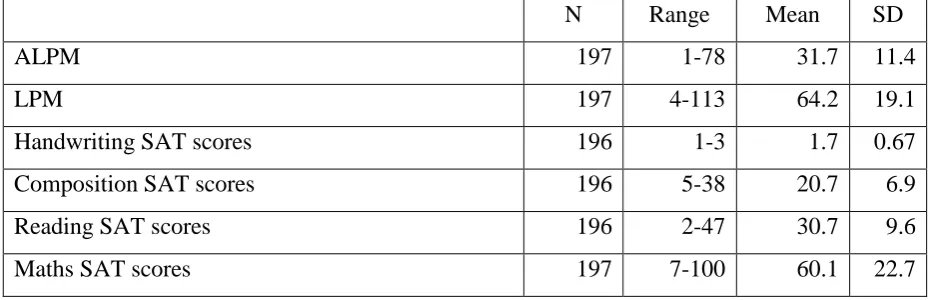
TABLE 2: Range, mean and SD of writing test scores (Study 2)
N Range Mean SD
ALPM 197 1-78 31.7 11.4
LPM 197 4-113 64.2 19.1
Handwriting SAT scores 196 1-3 1.7 0.67
Composition SAT scores 196 5-38 20.7 6.9
Reading SAT scores 196 2-47 30.7 9.6
Maths SAT scores 197 7-100 60.1 22.7
The range of scores on the Alphabet Task was 1-78 alphabet letters per minute (ALPM) with a mean of 31.7. This was approximately twice the score of the 7 year olds in Study 1 (mean 16.7) which suggests that performance on the alphabet task was very strongly age related.
The range of scores for the Handwriting Speed Test was 4-113 letters per minute with a mean of 64.2. In the Handwriting SAT, 38.4% of children scored 1 point, 48.0% two points and 12.6% three points. The mean was 1.7. The range of composition SAT scores was 4-46, with a mean of 26.5. The sample seems to have scored a little less than the national average in their writing outcomes with 57.6 % of pupils achieving level 4 or above in writing, where the national average was 67% (DfES/Ofsted, 2006).
The table also shows the SAT scores for Reading and Mathematics for these children, whose use will be described later.
The relationship between handwriting and composition
The full correlation matrix (Appendix 2) shows a high correlation between performance on the Alphabet Task and Composition (r=.46). This is higher than the correlation with writing speed alone (LPM) (r=.32) or with neatness and letter formation as indicated by the
The Alphabet Task performance accounted for 21.5% of the variance in composition for these Y6 children, which is lower than the equivalent figure for Y2 children (34%). This may indicate that as writers develop, there are other issues which account for more of the variance.
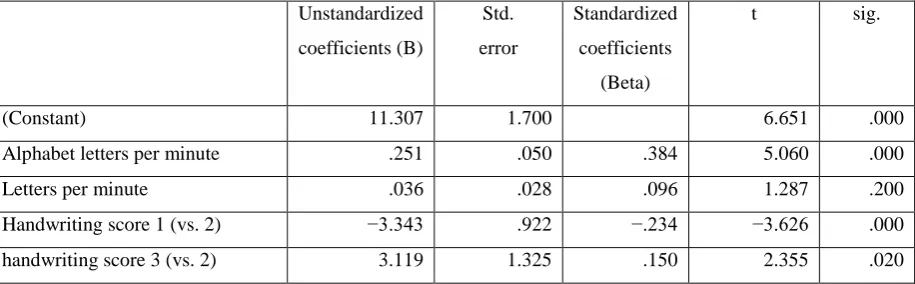
Stepwise multiple regression of handwriting predictors of composition
[image:16.595.71.529.465.607.2]A multiple regression analysis of the three handwriting predictors of composition is presented in Table 3. The Alphabet Task was entered first because it is the best single predictor of composition. Only scores on the Alphabet Task and Handwriting SAT score (neatness) were significant. Thus adding the SAT score for handwriting (neatness) to the regression increases the multiple r to .56, explaining an additional 10% of the variance in composition. Pure handwriting speed plays no part in predicting composition scores after automatic letter production (the Alphabet Task) and neatness (SAT Handwriting score) are accounted for. This is in contrast to the Y2 results, where handwriting speed did account for a further 10% of the variance.
TABLE 3: Multiple regression of handwriting measures against writing composition score (Study 2)
Unstandardized coefficients (B)
Std. error
Standardized coefficients
(Beta)
t sig.
(Constant) 11.307 1.700 6.651 .000
Alphabet letters per minute .251 .050 .384 5.060 .000
Letters per minute .036 .028 .096 1.287 .200
Handwriting score 1 (vs. 2) −3.343 .922 −.234 −3.626 .000
handwriting score 3 (vs. 2) 3.119 1.325 .150 2.355 .020
Notes: (a) Dependent variable: KS2 composition score.
Causal relationship between ALPM and composition
composition, independent of the influence of reading proficiency and mathematics
achievement. The measures of reading proficiency and mathematics achievement used were the SAT reading and mathematics scores for each child, assessed using the national tests. The range, mean and SD of these can be seen in Table 2 above.
Total reading and maths score is a good predictor of both composition (r=.63) and
performance on the Alphabet Task (r=.50) so is a relevant control variable. The zero-order correlation of ALPM and composition is 0.46 (see Table 2). After controlling for
mathematics and reading scores, the partial r drops to 0.22, but remains statistically significant (p<.005). Thus there is a strong relationship between ALPM and composition even when variation in reading and mathematics attainment is accounted for. This is
important since it establishes that the correlation between performance on the Alphabet Task and composition is not simply mediated by both being related to good reading or general intelligence. It does not definitively establish that low handwriting automaticity causes poor composition, but it makes it more likely that there is some direct association in the
correlation.
When lack of automaticity is a problem
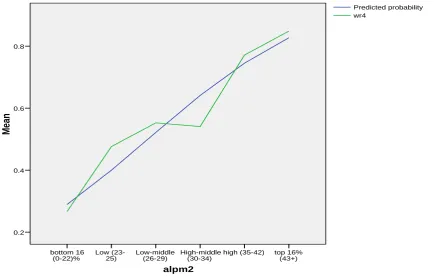
TABLE 4. Pupils in different score bands on ALPM. (Study 2)
Alphabet Task Score Band Frequency Valid % Cumulative %
% achieving Level 4+ in writing test
1 bottom 16% (0-22) 32 16.2 16.2 27.3
2 low (23-25) 22 11.2 27.4 47.2
3 low-middle (26-29) 38 19.3 46.7 52.4
4 high-middle (30-34) 37 18.8 65.5 53.7
5 high (35-42) 35 17.8 83.2 76.2
6 top 16% (43+) 33 16.8 100.0 88.0
Total 197 100.0 58.8
Note: One case was missing for ALPM score.
This banding reduces the correlation with composition slightly, but not excessively (r drops from .46 to .45). For these 11 year olds, the national expectation is that the typical pupil should achieve Level 4 in writing. A logistic regression was computed to identify the
relationship between ALPM and the probability of achieving Level 4 or above in the national writing test. Figure 2 gives a graphical presentation of the results in Table 4 (above).
FIGURE 2: Logistic regression of ALPM against the probability of achieving Level 4 or above in the KS2 writing test
alpm2
top 16% (43+) high (35-42) High-middle
(30-34) Low-middle
(26-29) Low
(23-25) bottom 16
(0-22)%
M
ean
0.8
0.6
0.4
0.2
wr4
[image:18.595.85.522.465.743.2]
For the two middle groups (Bands 3 & 4) the probability is around the sample average. However for band 5 this rises to 76% and to 88% for Band 6. Conversely for Band 2 the probability drops to 47% and to only 27% for Band 1. This suggests an ALPM of 22 or less indicates a significant risk of not achieving level 4 in writing. However, overall accuracy of prediction is only 67%. If handwriting SAT score (neatness) is also included the accuracy is raised to 73%. Speed is not a significant predictor of risk when ALPM and handwriting are included.
Although these figures again do not offer sufficient predictive accuracy to make ALPM a valid screening test on its own, the high relative ‘risk’ suggests that 22 letters per minute or less is a rough threshold at which teachers should consider further diagnostic and intervention work.
Conclusions
The results of these studies suggest that a high proportion of the variance in composition for the children included was related to their handwriting and, in particular, to their ability to generate letters automatically, as measured by the Alphabet Task. This supports the idea that letter generation makes cognitive demands on children and may take up working memory capacity which is, therefore, not available for higher level composing tasks. We suggest that this is a very important finding, given the widespread assumption that handwriting is simply a matter of presentation.
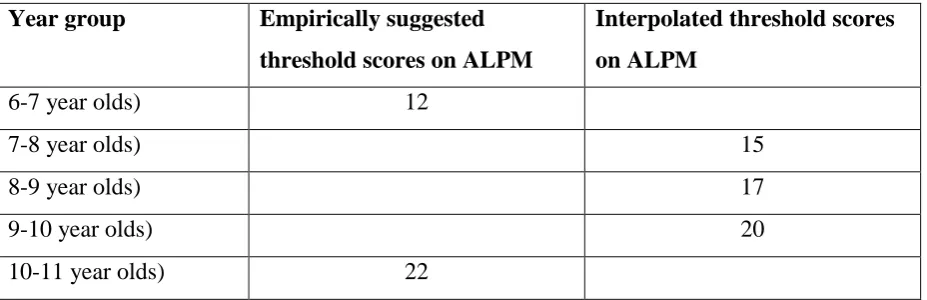
Both studies go some way towards identifying levels at which 7 and 11 year olds might benefit from improving their automaticity, in order to facilitate their composing. 7 year olds who scored around 12 ALPM, or less, on the alphabet task had only a 40% chance of achieving level 2b in the writing SAT, and 11 year olds scoring 22 ALPM or less had a similar chance of achieving the expected level 4 in their writing SAT. Although the Alphabet Task is not a screening mechanism for identifying all children at risk of achieving a low SAT score, it does identify many children for whom poor handwriting automaticity may be
It is, of course, tempting to interpolate likely threshold scores on the Alphabet Task for children between these ages. A graphical representation of the threshold scores we have found (see Figure 3) suggests that these thresholds are likely to be those given in Table 5.
Figure 3: ALPM threshold scores, with interpolations
TABLE 5: Interpolated threshold scores for primary children
Year group Empirically suggested
threshold scores on ALPM
Interpolated threshold scores
on ALPM
6-7 year olds) 12
7-8 year olds) 15
8-9 year olds) 17
9-10 year olds) 20
10-11 year olds) 22
In this paper we have begun the process of establishing the relationship between handwriting fluency (orthographic-motor integration) and composition ability. The evidence we have provided suggests that there is such a relationship, and that this may be much more important than hitherto realised. Our attempts to establish thresholds for handwriting automaticity which might help predict composition ability for children of various ages are, we accept, tentative. There is further research to do to explore the complex nature of the relationships we have uncovered. Yet we are convinced that these are potentially very fruitful lines of enquiry, for both researchers and for teachers of writing.
0 5 10 15 20 25
6-7 7-8 8-9 9-10 10-11
Threshold score on ALPM
[image:20.595.68.532.422.572.2]Appendix 1
Study 1 correlation matrix
ALPM (Alphabet task) LPM (Speed) SAT Handwriting Age in months Total writing SAT score Spelling SAT score Reading SAT score Composition SAT score ALPM (Alphabet task)
r 1 .599** .427** .075 .618** .561** .546** .581**
LPM (Speed)
r 1 .282** .046 .498** .473** .324** .440**
SAT Handwriting
r 1 .109 .636** .425** .430** .540**
Age in months
r 1 .091 -.043 -.037 .136
Total writing SAT score
r 1 .785** .798** .967**
Spelling SAT score
r 1 .632** .664**
Reading SAT score
r 1 .814**
Composition SAT score
r 1
r = Pearson product-moment correlation coefficient ** p < 0.001
Appendix 2
Study 2 correlation matrix
ALPM (Alphabet task) LPM (Speed) SAT Handwriting Age in months Total writing SAT score Spelling SAT score Reading SAT score Composition SAT score ALPM (Alphabet task)
r 1 .609** .076 .135 .489** .464** .465** .464**
LPM (Speed)
r 1 -.002 .133 .366** .414** .370** .321**
SAT Handwriting
r 1 -.065 .404** .219** .229** .345**
Age in months
r 1 .100 .038 .033 .111
Total writing SAT score
r 1 .679** .685** .975**
Spelling SAT score
r 1 .652** .559**
Reading SAT score
r 1 .637**
Composition SAT score
r 1
References
Alston, J. (1985) The handwriting of seven to nine year olds. British Journal of Special Educational Needs, 12, 68-72
Bentley, D. and Stainthorp, R. (1993) The needs of left handed children in the infant classroom- writing is not always right. Reading, 27, 4-9
Berninger, V. W. (1994). Reading and writing acquisition: A developmental neuropsychological perspective. Dubuque, IA: Brown and Benchmark.
Berninger, V. W., Abbott, R.D, Jones, J., Wolf, B., Gould, L., Anderson-Youngstrom, M., Shimada, S. and Apel, K. (2006) Early development of language by hand: Composing, reading, listening and speaking connections; Three letter writing modes and fast mapping in spelling. Developmental Neuropsychology, 29 (1), 61-92
Berninger, V. W, and Amtmann, D. (2004). Preventing written expression disabilities through early and continuing assessment and intervention for handwriting and/or spelling problems: research into practice. In L. Swanson, K. Harris, and S. Graham (Eds.), Handbook of researchon learning disabilities (pp. 345–363). New York, Guilford Press.
Berninger, V. W., and Graham, S. (1998). Language by hand: A synthesis of a decade of research on handwriting. Handwriting Review, 12, 11–25.
Berninger, V. W., Mizokawa, D. T., and Bragg, R. (1991). Theory-based diagnosis and remediation of writing disabilities. Journal of Educational Psychology, 29, 57–59.
Christensen, C. A. (2005) The role of orthographic-motor integration in the production of creative and well structured written text for students in secondary school, Educational Psychology. 25 (5), 441-453
Connelly, V., Campbell, S., MacLean, M., and Barnes, J. (2006). Contribution of lower order skills to the written composition of college students with and without dyslexia.
Connelly, V., and Hurst, G. (2001) The influence on handwriting fluency on writing quality in later primary and early secondary education. Handwriting Today 2, 5–57.
De La Paz, S., and Graham, S. (1995). Dictation: Applications to writing for students with learning disabilities. In T. Scruggs and M. Mastropieri (Eds.), Advances in learning and behavioral disorders (Vol. 9, pp. 227–247). Greenwich, CT: JAI Press.
DES/Ofsted (Department for Education and Skills/ Office For Standards in Education) (2006)
National School Improvement Summary Report for maintained Primary Schools. London: DES/Ofsted
DfEE/QCA (Department for Education and Employment/Qualifications and Curriculum Authority) (2000) The National Curriculum Handbook for Primary Teachers in England: Key Stages 1 and 2. London: HMSO
DfE (Dept for Education) (2012) Draft National Curriculum documents for primary English, mathematics and science. Available online:
http://www.education.gov.uk/schools/teachingandlearning/curriculum/nationalcurriculum/a0 0210036/sosletter
Gathercole, S. E., Pickering, S. J., Knight, C. and Stegmann, Z. (2004) Working memory skills and educational attainment: Evidence from national curriculum assessments at 7 and 14 years of age. Applied Cognitive Psychology, 18, 1-16.
Graham, S., Berninger, V., Abbott, R., Abbott, S., and Whitaker, D. (1997). The role of mechanics in composing of elementary school students: A new methodological approach.
Journal of Educational Psychology 89 (1), 170–182.
Graham, S., and Weintraub, N. (1996). A review of handwriting research: Progress and prospects from 1980 to 1994. Educational Psychology Review, 8, 7-87.
Hidi, S. and Hilyard, A. (1984) The comparison of oral and written productions in two discourse modes. Discourse Processes, 6, 2, 91-105.
Jones, D. (2004) Automaticity of the transcription process in the production of written text.
Unpublished Doctor of Philosophy Thesis, University of Queensland, Australia.
Jones, D., and Christensen, C. (1999). The relationship between automaticity in handwriting and students’ ability to generate written text. Journal of Educational Psychology, 91, 44-49.
Kellogg, R. T. (1996). A model of working memory in writing. In C. Levy and S. Ransdell (Eds.). The science of writing: Theories, methods, individual differences, and applications
(pp. 57-71). Mahwah, NJ: Lawrence Erlbaum.
Kellogg, R. T. (2001) Competition for working memory among writing processes, American Journal of Psychology, 114, pp. 175-191.
La Berge, D., and Samuels, S. J. (1974) Toward a theory of automatic information processing. Cognitive Psychology, 6, 283–323.
McCutchen, D. (1996) A capacity theory of writing: Working memory in composition.
Educational Psychology Review, 8, 299–325.
McCutchen, D. (1988) "Functional automaticity" in children's writing: A problem in metacognitive control. Written Communication, 5, 306-324.
Medwell, J. & Wray, D. (2008) ‘Handwriting: a forgotten language skill?’ Language and Education, Vol. 22 (1), pp. 34-47
Peverley, S. (2006). The importance of handwriting speed in adult writing. Developmental Neuropsychology, 29, 197– 216.
Scardamalia, M., Bereiter, C., and Goleman, H. (1982). The role of production factors in writing ability. In Nystrand, M. (Ed.), What writers know: The language, process, and structure of writtendiscourse (pp. 173–210). New York: Academic Press.
Wallen, M., Bonney, M. & Lennox, L. (1996) The Handwriting Speed Test Australia: Helios Art and Book Co.