1
Behavioural changes in dairy cows with lameness in an automatic milking
1system
2Giuliana G. Miguel-Pachecoa*; Jasmeet Kalera; John Remnanta; Lydia Cheynea; Caroline 3
Abbotta; Andrew P Frenchb; Tony P Pridmorec; Jonathan N. Huxleya 4
a
School of Veterinary Medicine and Science, University of Nottingham, Sutton Bonington 5
Campus, Sutton Bonington, LE12 5RD, United Kingdom 6
b
School of Biosciences, University of Nottingham, Sutton Bonington Campus, Sutton 7
Bonington, LE12 5RD, United Kingdom 8
c
School of Computer Science, University of Nottingham, Jubilee Campus, Nottingham, NG8 9
1BB, United Kingdom 10
11
*
Corresponding author: 12
Giuliana Giannina Miguel-Pacheco 13
Tel (44) 1159 516753 14
Fax (44) 1159 516415 15
17
18
19
20
21
22
23
24
2
Abstract
26
There is a tendency worldwide for the automation of farms; this has included the 27
introduction of automatic milking systems (AMS) in the dairy industry. Lameness in dairy 28
cows is highly prevalent and painful. These impacts potentially affect not only animal 29
welfare, but also farm economies. Three independent observational studies were carried out 30
to assess the impact of lameness on the behaviour of zero grazed high yielding Holstein cows 31
managed in an AMS. The aim of the first study was to examine the impact of lameness on 32
rumination time, the second study investigated differences between lame and sound dairy 33
cows in total eating time and the third study assessed the impact of lameness on milking 34
behaviour (frequency and time of visits to the AMS). In the first study data from 150 cows 35
were used to analyse rumination (collected using rumination collars) for the 48hr following 36
locomotion scoring. A multilevel linear regression demonstrated that lameness had a small 37
but significant negative association (coefficient: -7.88 (SE: 3.93)) with rumination. In the 38
second study the behaviour of eleven matched lame and sound pairs of cows at the feed face 39
was analysed for 24 hours after locomotion scoring. Each feeding behaviour variable (total 40
duration time, frequency of feeding bouts and length of bouts) was analysed using individual 41
single level regression models. There was a significant negative association between total 42
feeding time and lameness (coefficient: -73.65 (SE: 25.47)) and the frequency of feeding 43
bouts and lameness (-9.93 (2.49)). Finally, the third observational study used 38 matched 44
pairs of lame and sound cows. Data on the number and timings of visits to the AMS were 45
collected for 24 hours after each locomotion score and analysed using a binomial logistic 46
regression model. There was a significant difference in AMS visits between groups; lame 47
animals visiting the robot less frequently than sound cows (median difference 0.50 milking 48
visits; T = 256.0; N = 25; p = 0.01) and lame cows were 0.33 times less likely to visit the 49
3 affected feeding behaviour, rumination and AMS visits. All of these impacts are likely to 51
have negative consequences for farm profitability, but also implications for the health and 52
welfare of the animals. 53
Keywords: Automatic milking system; lameness; rumination; feeding; milking visits. 54
55
56
57
58
59
60
61
62
63
64
65
66
67
68
69
70
71
72
73
4
1.Introduction
75
Automatic milking systems (AMS) were introduced to the dairy industry approximately 76
20 years ago. The number of installations is increasing rapidly, currently there are 77
approximately 8000 farms with AMS around the world (Jacobs and Siegford, 2012). The 78
most attractive farm benefits for the use of AMS are the freedom they provide farmers 79
compared to conventional parlours and the opportunity to increase milking frequency 80
resulting in an increase in milk production (Uetake et al., 1997; Meskens et al., 2001). Of 81
equal importance, the cows may benefit from the freedom to control their activity, with the 82
possibility of longer periods of lying and reduced stress at the time of milking because they 83
are not gathered and crowded as they are in conventional parlours. Additionally, more 84
frequent milking reduces udder pressure whilst at the same time reducing stress on the udder 85
ligaments (Meskens et al., 2001; Osterman and Redbo, 2001). 86
As the dairy industry has developed over the last 50 years, there has been an increase in 87
the prevalence of lameness worldwide, for example in the UK the prevalence was 36.8% 88
(Barker et al., 2010), 28.5% in Canada (Ito et al., 2010) and between 28-33% in Chile 89
(Tadich et al., 2010). Lameness is a sign of pain and discomfort at the level of the leg but 90
more commonly at the level of the claw (Archer et al., 2010a). Affected animals show 91
behavioural signs of being in pain such as reduction in mobility and alterations in behaviour. 92
Due to discomfort and changes in behaviour it is not surprising that lameness has been 93
associated with a reduction in milk production (Green et al., 2002; Archer et al., 2010b) and 94
in reproduction success (Huxley, 2013). 95
In conventional parlours it has been observed that lame cows reduced their feeding time 96
(Gonzalez et al., 2008; Gomez and Cook, 2010), increased their lying time (Ito et al., 2010) 97
5 Broom, 2002). In previous studies investigating the association between rumination and 99
lameness, no definitive differences between lame and sound animals have been identified, 100
possibly because rumination measurement was carried out using visual observations of 101
behaviour over relatively short periods of time and / or across relatively small numbers of 102
animals (Hassall et al., 1993; Singh et al., 1993; Almeida et al., 2008; Pavlenko et al., 2011). 103
An AMS relies on the willingness of the cow to attend the robot by receiving a feed reward 104
when milking (Prescott et al., 1998). Overall studies on lame cows in AMSs in other parts of 105
the world have demonstrated that they visited the milking units less frequently compared to 106
sound animals (Klaas et al., 2003; Bach et al., 2007; Borderas et al., 2008). 107
Technologies on AMS and other modern dairy farms are monitoring and recording 108
increasing amounts of data on the behaviour of animals. These data have the potential to be 109
used as early indicators for diseases such as lameness and allow us to better understand the 110
secondary health and welfare consequences lameness may have on animals suffering from 111
this painful condition. Three independent observational studies were carried out to assess the 112
impact of lameness on the behaviour of zero grazed high yielding cows housed in an AMS. 113
The aim of the first study was to examine the impact of lameness on rumination time, 114
monitored continuously by rumination collars. The second study investigated differences 115
between lame and sound dairy cows in total eating time over a 24 hour period. Finally, the 116
third study assessed the impact of lameness on milking behaviour (frequency and time of 117
visits to the AMS). In each study the null hypothesis stated that there was no difference in 118
behaviour between lame and sound animals. 119
120
2.Materials and Methods 121
2.1. Animals and Housing
6 The studies were conducted on a 200 Holstein cows AMS unit, located in the midlands 123
region of the UK, with an average milk yield per cow of approximately 11500 L per 305 124
days. All study protocols were reviewed and approved by the University of Nottingham’s 125
School of Veterinary Medicine and Science Ethical Review Committee before data collection 126
began. 127
The unit consisted of four pens, each housing approximately 45 cows. Each pen consisted 128
of three rows of free-stalls bedded with a thin layer of sawdust on a mattress base and one 129
AMS (Lely Astronaut A3, Lely UK Ltd, St Neots, UK). Three of the four pens (Pen 2, 3 and 130
4) had 59 stalls and the remaining pen (Pen 1) contained 76 stalls. All walking and standing 131
areas were covered with rubber matting (Kraiburg, Kitt LTD. UK); passageways were 132
cleaned once per hour by automatic scrappers. Cows had free access to the AMS at any time; 133
a maximum of 5 milking visits per cow per day was permitted. The maximum interval 134
allowed between milking visits was set at 12 hours. Milking attendance was monitored twice 135
a day (at approximately 07:00 and 15:00 h) and cows were selected if their visit frequency 136
was inadequate (based on their days in milk, parity and yield). Selected individuals were 137
identified and moved to the robot for milking. 138
Fresh feed was provided as a mixed ration once per day at approximately 08:30; ration 139
was pushed up at 10:00, 12:00, 14:00, 17:00, 20:00 and 06:00. Feed was provided along one 140
side of each pen (approximately 37m) and each pen contained two large water troughs. In 141
addition, cows were provided with an individual concentrate ration (1.5kg/day) adjusted to 142
the frequency of milking visits, in the AMS. If the cow produced more than 23L/day, an 143
additional 0.16kg per each extra litre of milk was provided. 144
The farm had a lameness prevention and control plan in operation; all feet of all animals 145
7 that became lame were identified and treated as soon as possible by farm staff. Lactation 147
cows walked through a foot bath containing 5% copper sulphate placed at the AMS exit for at 148
least one day per week. Finally, the diet was fortified with 20mg of Biotin per cow per day to 149
aid in the prevention of claw horn lesions. 150
2.2. General Experimental Procedures
151
2.2.1. Locomotion score
152
For all the experiments, locomotion scoring was carried out following the UK industry 153
standard four point system (DairyCo, 2009): Score 0 a cow with good mobility, score 1 with 154
imperfect mobility, score 2 with impaired mobility with a limb that is immediately 155
identifiable and score 3 with severely impaired mobility. Trained observers locomotion 156
scored all the cows in each pen once every 7 (±1) days with the exception of experiment 2, 157
when locomotion scoring was carried out every 5 (±2) days and only in pen 2. Experiment 1 158
was entirely observational, identification and treatment of lame cows continued according to 159
standard farm management procedures throughout the study period. In experiments 2 and 3, 160
lame cows were treated within 48 hours of identification. 161
2.2.2. Milk production and weight data
162
Days in milk, parity, daily milk production and daily body weight data were recorded and 163
stored on the farm management system. At the end of the observational study, all data was 164
collected using T4C software (Lely, Netherlands). 165
2.3. Specific Experimental Procedures
166
2.3.1. Experiment 1
167
This experiment was design as an observational longitudinal study to investigate the 168
8 December 2011; each week they were assigned a locomotion score to identify them as lame 170
(Score 2 or 3) or control (Score 0 or 1). Each cow was fitted with a rumination collar (Qwes-171
HR, Lely WestNV, The Netherlands) which registered and recorded total rumination time, 172
chews per bolus and time between boluses (Schirmann et al., 2009). Rumination data was 173
collected for the following 48hr, starting at 24:00 h on the day of the locomotion score. 174
2.3.2. Experiment 2
175
This study was designed as a prospective case-control study to investigate the impact of 176
lameness on feeding behaviour. It was conducted between July and November 2010 on cows 177
in pen 2. 178
2.3.2.1.Case and control selection
179
Case cows were considered eligible for inclusion if they were severely lame (Score 3) and 180
had been calved for at least 20 days. They were included if a matching control animal (Score 181
0 or 1) could be identified in the population. Matching criteria for control animals are 182
outlined in Table 1. 183
2.3.2.2.Behaviour recording
184
Case-control pairs were identified individually using a small piece of fluorescent fabric 185
attached using adhesive (Kamar glue, Kamar Inc) over the left flank and the rump. Two 186
ceiling mounted CCTV cameras with low light capability were used to record the entire feed 187
face for 25 hours. 188
Videos were watched by a single trained observer using VLC Media Player (version 1.1, 189
VideoLAN, Paris); the first 30 minutes of footage was discarded to allow animals to settle 190
9 head into the feeding area and started to chew or nose the feed. Any other behaviour such as 192
throwing or playing with the feed was not included. 193
The feeding behaviour (number and duration of bouts) of case-control pairs was logged 194
over a continuous 24 hour period. Total feeding duration and frequency of feeding bouts in a 195
24h period were calculated per cow. The mean feeding bout duration in a 24h period was 196
calculated by dividing the total feeding duration by the frequency of feeding bouts per cow. 197
2.3.3. Experiment 3
198
This observational study compared the milking visit frequency and time of the milking visits 199
to the AMS between lame and non-lame cows. It was designed as a case-control study and 200
conducted between October and November 2011. 201
2.3.3.1. Case-control selection
202
After each locomotion score, case-control pairs were selected using the matching criteria 203
outlined in Table 1 and blocked by pen. Lame cows could only be included in the study once; 204
cows classified as controls could be used more than once, if they met the matching criteria for 205
more than one lame animal. 206
2.3.3.2.AMS visit data
207
Data for each case-control pair was downloaded for a 24 hour period beginning at 12:01. 208
Data collected included number of milking visits in the last 24 hours, time of each visit, the 209
number of refusals (the robot refused to milk the cow because the minimum milking interval 210
of 4 hours had not been reached) and the number of failures (the robot failed to attached the 211
teat cups to the cow). 212
2.4. Data Analysis
10 For all three experiments, downloaded data was managed in Microsoft Excel 2010 214
(Microsoft Corp., Redmond, WA). Descriptive analysis and statistical analysis, where 215
required, was carried out using Stata/SE 12.0 (Stata Corp 2011, USA). Multilevel and single 216
level regression models were built using MLwiN version 2.25 (Centre for Multilevel, 217
Modeling, University of Bristol). Level of significance was set as P≤ 0.05 for all the
218
experiments. Results from multilevel models are presented as follows (Coefficient (SE)). 219
2.4.1. Experiment 1
220
The rumination data was not normally distributed and contained outliers. The Fourth 221
Spread test (Devore, 2000) was used and extreme outliers were deleted. A multilevel linear 222
regression model was built in order to study the association between rumination and lameness 223
status. The model had the following form (Eq. 1): 224
yijk = β0ijk + β1x1ijk + β2x2ijk+ β3x3ijk+ β4x4ijk+ β5x5ijk+ eijk (Eq. 1) 225
The outcome variable (y) was rumination that was averaged across the 2 days after the 226
locomotion score in each observation week. The three levels of the model were AMS pen (k), 227
cow (j) and observation week (i). β0 was the intercept fixed at each level. βrepresents the 228
regression coefficient and the predictor variables are represented by x. x1 represents lameness 229
status (0 = no lame, 1 = lame and 2 = lame and treated), x2 stands for milk production (2 230
categories), x3 days in milk (3 categories), x4 for parity (4 categories), x5 for weight (3 231
categories) and e stands for the random error. The model fit was checked by graphical 232
analysis of normal distribution of residuals at level 2 (cow) and level 3 (observation week). 233
2.4.2. Experiment 2 234
Eleven case-control pairs were observed over seven separate recording periods. Data from 235
one pair of cows was excluded; animals lost their markers and could not be identified on the 236
11 Independent single level linear regression models were built for each feeding behaviour 238
variable, controlling for parity. Model took the following form (Eq. 2): 239
yi = β0 + β1x1i + β2x2i + β1x3i + β1x4i + β1x5i + β1x6i + ei (Eq. 2) 240
Where y was the outcome variable (total feeding duration, frequency of feeding bouts or 241
mean of feeding bout), i the pair ID level, β0 was the intercept fixed at level i. β was the 242
regression coefficient and the predictor variables were represented by x. x1 represents the 243
case-control ID variable, x (2-6) stands for parity as categorical variable (5 categories) and e 244
stands for the random error. 245
2.4.3. Experiment 3
246
The dataset of 38 pairs included AMS pen ID (1 to 4), cow ID, case (lame-1) or control 247
(sound-0), locomotion score, parity, daily milk production (last 24 hours) and days in milk 248
(DIM). Each visit to the AMS was allocated to one of four time periods (12:01 - 18:00; 18:01 249
- 24:00; 24:01 - 06:00 and 06:01 - 12:00). Parity, daily milk production and DIM were 250
normally distributed; the Mean Paired test was used to compare data between groups. The 251
total number of milking visits was not normally distributed and could not be successfully 252
transformed; therefore Wilcoxon Signed-rank test was used to compare data between groups. 253
Refusals data was analyzed using the Two Sample Proportion Test. 254
A multilevel binomial logistic regression model was carried out to compare the odds of 255
the milking visits to the AMS at specific time periods between case and control groups. The 256
model was set with 3 levels (AMS pen=k, cow ID=j and visit ID model=i) and the outcome 257
was defined as whether cows visited the robot during a particular time period (visit Y/N). 258
Visit ID for cases (1-4) and controls (5-8) were the explanatory variables were added as fixed 259
12 Logit (𝜋ijk) = β0x0ijk + β1x1ijk + β2x2ijk + eijk (Eq.3)
261
Where
𝜋
was visit/no visit to the AMS, β0 was the intercept fixed at each level, β 262represented the regression coefficient of each explanatory variables and the predictor 263
variables were represented by x. x1 represented robot (4 variables) and x2 represented visit ID 264
(8 variables). The random error is represented by e.
265
266
3.Results
267
3.1. Experiment 1
268
A total of 174 cows were observed during the study. Thirteen animals were excluded 269
because they did not have at least 2 consecutive locomotion scores and a further 11 because 270
they had either missing data or they suffered other disease conditions (e.g. mastitis) during 271
the observation period. Therefore statistical analysis was performed on the remaining 150 272
cows with a total of 1057 locomotion scores. 273
The 150 animals (mean ±SD; parity = 2.5 ±1.5; DIM = 147.1 ±110.1; daily milk 274
production = 38.11 ±9.6 L) had a mean body weight of 652.13 (±75.4) kg and a mean total 275
rumination of 508.8 (±93.1) minutes in 24hrs. In total 110 cows were observed lame and 40 276
were never lame during the observation period. From these 110 cows, 40 cows were lame at 277
least once, 42 were lame two or three times, 26 were lame between 5 to 8 times and 2 cows 278
were identified as lame throughout the 9 weeks study period. 279
The results of the multilevel linear regression model are outlined in Table 2. Lameness 280
had a small but significant (P ≤ 0.05) negative association with rumination; rumination was
281
reduced by 7.9 minutes per day, in the two days following a lame locomotion score. Parity 282
13 primiparous cows (P≤0.05) and cows greater than 130 days in milk ruminated more than
284
those less than 130 days in milk (P≤0.05). AMS pen did not have any significant effect on the
285
model. There was random variability between cows (Coefficient: 5081.41 (SE: 619.45)) and 286
between observation weeks (1997.87 (93.90)). 287
3.2. Experiment 2
288
As expected due to matching there were no significant difference in DIM, daily milk 289
production and body condition scoring between lame and sound cows. 290
The results from the linear regression model confirmed a significant negative association 291
between total feeding time and lameness (Coefficient: -73.65 (SE: 25.47)) and the frequency 292
of feeding bouts and lameness (-9.93 (2.49)). Lame cows spent less time feeding (191.7 293
±20.33 minutes / 24h) and had fewer feeding bouts (16.3 ±1.68 bouts/24h) than sound cows 294
(Feeding time: 263.7 ±16.62 minutes / 24h; feeding bouts: 26.6 ±2.43 bouts/24h) (Figure 1). 295
The mean duration of feeding bouts in a 24h period was 12.5 minutes (±1.4) for lame cows 296
and 10.48 minutes (±0.91) for sound cows (Figure 1), the difference was not significant. For 297
parity, the only significant positive association observed was between the mean length of a 298
feeding bout and cows in 5th (7.19 (2.64)) and 9th (10.093 (2.64)) parity. Pair ID presented a 299
significant (P<0.01) random variability for each of the three analysis (Total feeding time: 300
2929.85 (926.50); mean length of feeding bout: 5.69 (1.80) and frequency of feeding bouts 301
26.14 (8.27)). 302
3.3. Experiment 3
303
A total of 38 case-control pairs were enrolled in the observation period. Two cows were 304
used twice as controls in the pair matching. As expected due to matching there were no 305
significant difference in parity, DIM and daily milk production between lame and sound 306
14 The total number of visits to the AMS for lame cows was 164 and for the control group 308
was 140, from which refusals represented 25.6% of visits for the former and 22.9% for the 309
latter (NS). In the 24 hour observation periods, 5 lame cows and 4 control cows overdue for 310
milking were directed through the robot. 311
Lame cows visited a mean of 2.8 times per 24 hours (Range 1-4); control cows visited a 312
mean of 3.2 times (Range 2-5). The difference was highly significant (z =-2.706, p<0.001). 313
Results of the logistic regression model demonstrated that after controlling for the effect of 314
AMS pen, lame cows were significantly less likely to visit the AMS between 24:01 and 06:00 315
when compared to control animals (Table 3). 316
317
4.Discussion
318
Lame dairy cows managed in an intensive AMS in the UK demonstrated a reduction in 319
visits to the AMS, total rumination time, total feeding time and frequency of feeding bouts. 320
Additionally, lame cows visited the milking unit less at night (24:01-06:01) compared to their 321
sound herd mates. To the authors’ knowledge this is the first study to investigate the 322
association using rumination data collected continuously using collars over a prolonged 323
period of time. Lame animals ruminated for significantly shorter period of time each day, 324
compared to their sound herd mates, although the difference was small (~8 minutes / day). In 325
agreement with previous studies, primiparous cows ruminated less than multiparous cows 326
(Soriani et al., 2012). The effects of parity and days in milk were large compared to the 327
impacts of lameness (Table 2). 328
The reason for the small but significant reduction in rumination time observed in lame 329
15 feeding behaviour and lameness on the same unit (experiment 2), lame animals ate for 331
significantly shorter periods of time each day over significantly fewer meals. These findings 332
are in agreement with previous studies conducted in other parts of the world in cows 333
managed in a range of different systems (Bach et al., 2007; Gonzalez et al., 2008; Gomez and 334
Cook, 2010). The observed reduction in total rumination time could be associated with a 335
reduction in total dry matter intake (associated with the reduction in total feeding time) and 336
therefore lower fibre content in the rumen. However a previous study has demonstrated that 337
lame cows may compensate for the reduction in total feeding time by increasing their feed 338
intake rate (Gonzalez et al., 2008). Alternatively the change in feeding behaviour observed in 339
lame animals may adversely affect rumen function e.g. consuming the total daily dry matter 340
intake over fewer meals, at an increased rate, may decrease rumination. Finally the 341
discomfort / stress associated with lameness may directly affect rumen function via central 342
depression of the centres controlling rumination, previous work has demonstrated that 343
rumination is negatively associated with higher levels of cortisol (Bristow and Holmes, 2007; 344
Almeida et al., 2008). 345
Lame cows visited the AMS less frequently than matched, sound animals; the reduction 346
in visits was significant between midnight and 6am. These findings are in agreement with 347
other authors (Klaas et al., 2003; Bach et al., 2007; Borderas et al., 2008). The pain and 348
discomfort caused by lameness (Whay et al., 1997) may have reduced the cow’s willingness 349
to attend the AMS. In conventional parlours, lame cows are often the last to enter the milking 350
unit (Hassall et al., 1993) and tend to walk more slowly (Chapinal et al., 2010). It can be 351
postulated that the lame cows visited the AMS less because of the discomfort associated with 352
standing and walking to the unit. If lame cows do not visit the AMS as frequently as their 353
16 suffering discomfort from high fill, udder tension and intra-mammary infections (Gleeson et 355
al., 2007). 356
The significant reduction in overnight visits to the AMS is less easy to explain. As herd 357
and diurnal animals, cows tend to visit the AMS between 08:00 and 19:00 hours (Wagner-358
Storch and Palmer, 2003). The reduction in overnight visits may be associated with feeding 359
behaviour. On this unit TMR was pushed up to the cows between 6am and 8pm. Pushing up 360
is often associated with an increase in feeding activity i.e. it actively encourages animals to 361
stand and visit the feed face (Personal Observation), and previous work has demonstrated that 362
high yielding cows have higher motivations for feed than for being milked (Prescott et al., 363
1998). Once standing it seems plausible that animals are then more likely to visit the AMS. It 364
is logical to assume that the increased pressure placed on the feet during rising and standing, 365
is painful in lame animals. It seems possible that the absence of TMR being pushed up 366
overnight decreases the likelihood that lame animals will be motivated to stand and visit the 367
feed face and hence they are also less likely to visit the AMS. 368
Voluntary attendance to the milking unit is one of the principal benefits of AMS as it 369
reduces the staff costs associated with conventional milking (Meskens et al., 2001). If daily 370
voluntary visits to the AMS fall below an intervention threshold cows must be fetched and 371
encouraged through the milking unit manually, increasing farm labour requirements. The 372
process of fetching and tightly penning animals in a waiting area behind the robot can be a 373
stressful process even on farms with a good stockmanship. Therefore, reduction in visits to 374
the AMS may not only impact on profitability through losses in milk production and 375
increased labour requirements but also be detrimental for cow welfare. 376
377
17
5.Conclusion
379
The observational studies described here demonstrate that lameness in high yielding cows 380
managed in an AMS affects feeding behaviour, rumination and visits to the AMS. All of 381
these impacts are likely to have negative consequences for farm profitability, but also 382
implications for the health and welfare of the cows. Further studies are required in order to 383
maximise the use and benefits of the technologies available in AMSs as a tool to measure and 384
monitor the health status of cows. 385
386
Acknowledgements
387
Giuliana Miguel-Pacheco is funded by a Scholarship awarded by the University of 388
Nottingham International Office; the authors gratefully acknowledge their support. The 389
authors wish to thank Arjen van der Kamp (Research & Field Experience Farm Management 390
Support) and Moyna Bierma (T4C Support & Development) from Lely International 391
(Maassluis, Netherlands) for their technical support. 392
393
References
394
Almeida, P.E., Weber, P.S.D., Burton, J.L., Zanella, A.J., 2008. Depressed DHEA and 395
increased sickness response behaviors in lame dairy cows with inflammatory foot 396
lesions. Domestic Animal Endocrinology 34, 89-99. 397
Archer, S., Bell, N., Huxley, J., 2010a. Lameness in UK dairy cows: a review of the current 398
status. In Practice 32, 492-504. 399
Archer, S.C., Green, M.J., Huxley, J.N., 2010b. Association between milk yield and serial 400
locomotion score assessments in UK dairy cows. Journal of Diary Science 93, 4045-401
18 Bach, A., Dinares, M., Devant, M., Carre, X., 2007. Associations between lameness and 403
production, feeding and milking attendance of Holstein cows milked with an 404
automatic milking system. Journal of Dairy Research 74, 40-46. 405
Barker, Z.E., Leach, K.A., Whay, H.R., Bell, N.J., Main, D.C.J., 2010. Assessment of 406
lameness prevalence and associated risk factors in dairy herds in England and Wales. 407
Journal of Diary Science 93, 932-941. 408
Borderas, T.F., Fournier, A., Rushen, J., De Passille, A.M.B., 2008. Effect of lameness on 409
dairy cows' visits to automatic milking systems. Canadian Journal of Animal Science 410
88, 1-8. 411
Bristow, D.J., Holmes, D.S., 2007. Cortisol levels and anxiety-related behaviors in cattle. 412
Physiology & Behavior 90, 626-628. 413
Chapinal, N., De Passillé, A.M., Rushen, J., Wagner, S., 2010. Automated methods for 414
detecting lameness and measuring analgesia in dairy cattle. Journal of Diary Science 415
93, 2007-2013. 416
DairyCo, 2009. Mobility Score-Instructions. 417
Devore, J.L., 2000. Overview and Descriptive Statistics, Probability and statistics for 418
engineering and the sciences, Duxbury, Pacific Grove, CA. 419
Galindo, F., Broom, D.M., 2002. The effects of lameness on social and individual behavior of 420
dairy cows. Journal of Applied Animal Welfare Science 5, 193-201. 421
Gleeson, D.E., O'Brien, B., Boyle, L., Earley, B., 2007. Effect of milking frequency and 422
nutritional level on aspects of the health and welfare of dairy cows. Animal 1, 125-423
132. 424
Gomez, A., Cook, N.B., 2010. Time budgets of lactating dairy cattle in commercial freestall 425
herds. Journal of Dairy Science 93, 5772-5781. 426
Gonzalez, L.A., Tolkamp, B.J., Coffey, M.P., Ferret, A., Kyriazakis, I., 2008. Changes in 427
feeding behavior as possible indicators for the automatic monitoring of health 428
disorders in dairy cows. Journal of Dairy Science 91, 1017-1028. 429
Green, L.E., Hedges, V.J., Schukken, Y.H., Blowey, R.W., Packington, A.J., 2002. The 430
impact of clinical lameness on the milk yield of dairy cows. Journal of Dairy Science 431
85, 2250-2256. 432
Hassall, S.A., Ward, W.R., Murray, R.D., 1993. Effects of lameness on the behaviour of 433
cows during the summer. Veterinary Record 132, 578-580. 434
Huxley, J.N., 2013. Impact of lameness and claw lesions in cows on health and production. 435
Livest Sci 156, 64-70. 436
Ito, K., Von Keyserlingk, M.A.G., LeBlanc, S.J., Weary, D.M., 2010. Lying behavior as an 437
19 Jacobs, J.A., Siegford, J.M., 2012. Invited review: The impact of automatic milking systems 439
on dairy cow management, behavior, health, and welfare. Journal of Dairy Science 440
95, 2227-2247. 441
Klaas, I.C., Rousing, T., Fossing, C., Hindhede, J., Sorensen, J.T., 2003. Is lameness a 442
welfare problem in dairy farms with automatic milking systems? Animal Welfare 12, 443
599-603. 444
Meskens, L., Vandermersch, M., Mathijs, E., 2001. Literature review on the determinants and 445
implications of technology adoption. Deliverable no. 1 of EU project 'Implications of 446
the introduction of automatic milking on dairy farms', work package 1, Socio-447
economic aspects of automatic milking. 448
Osterman, S., Redbo, I., 2001. Effects of milking frequency on lying down and getting up 449
behaviour in dairy cows. Applied Animal Behaviour Science 70, 167-176. 450
Pavlenko, A., Bergsten, C., Ekesbo, I., Kaart, T., Aland, A., Lidfors, L., 2011. Influence of 451
digital dermatitis and sole ulcer on dairy cow behaviour and milk production. Animal 452
5, 1259-1269. 453
Prescott, N.B., Mottram, T.T., Webster, A.J.F., 1998. Relative motivations of dairy cows to 454
be milked or fed in a Y-maze and an automatic milking system. Applied Animal 455
Behaviour Science 57, 23-33. 456
Schirmann, K., von Keyserlingk, M.A.G., Weary, D.M., Veira, D.M., Heuwieser, W., 2009. 457
Technical note: Validation of a system for monitoring rumination in dairy cows. 458
Journal of Dairy Science 92, 6052-6055. 459
Singh, S.S., Ward, W.R., Lautenbach, K., Murray, R.D., 1993. Behaviour of lame and normal 460
dairy-cows in cubicles and in a straw yard. Veterinary Record 133, 204-208. 461
Soriani, N., Trevisi, E., Calamari, L., 2012. Relationships between rumination time, 462
metabolic conditions, and health status in dairy cows during the transition period. J. 463
Anim. Sci. 90, 4544-4554. 464
Tadich, N., Flor, E., Green, L., 2010. Associations between hoof lesions and locomotion 465
score in 1098 unsound dairy cows. Veterinary Journal 184, 60-65. 466
Uetake, K., Hurnik, J.F., Johnson, L., 1997. Behavioral pattern of dairy cows milked in a 467
two-stall automatic milking system with a holding area. J. Anim. Sci. 75, 954-958. 468
Wagner-Storch, A.M., Palmer, R.W., 2003. Feeding behavior, milking behavior, and milk 469
yields of cows milked in a parlor versus an automatic milking system. Journal of 470
Dairy Science 86, 1494-1502. 471
Whay, H.R., Waterman, A.E., Webster, A.J.F., 1997. Associations between locomotion, claw 472
lesions and nociceptive threshold in dairy heifers during the peri-partum period. 473
Veterinary Journal 154, 155-161. 474
Wildman, E.E., Jones, G.M., Wagner, P.E., Boman, R.L., Troutt, H.F., Lesch, T.N., 1982. A 475
dairy-cow body condition scoring system and its relationship to selected production 476
20 478
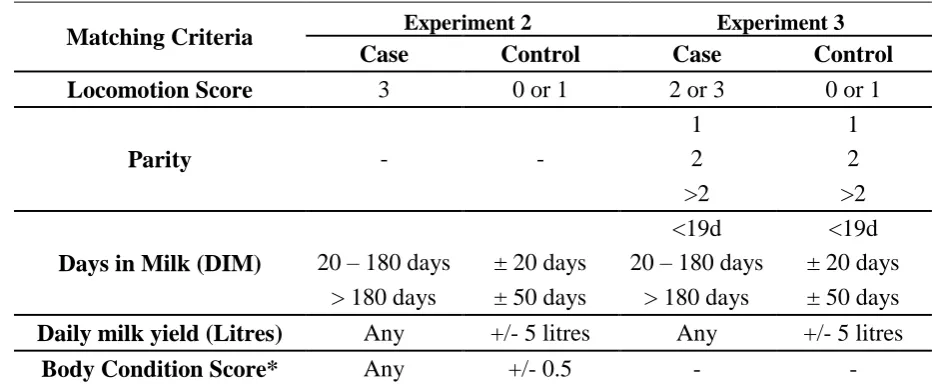
Table 1. Matching criteria used for selection of case and control animal in experiment 2 and 479
experiment 3. 480
Matching Criteria Experiment 2 Experiment 3
Case Control Case Control
Locomotion Score 3 0 or 1 2 or 3 0 or 1
Parity
1 1
- - 2 2
>2 >2
Days in Milk (DIM)
<19d <19d 20 – 180 days ± 20 days 20 – 180 days ± 20 days
> 180 days ± 50 days > 180 days ± 50 days
Daily milk yield (Litres) Any +/- 5 litres Any +/- 5 litres
Body Condition Score* Any +/- 0.5 - -
*BCS: one to five visual scale with inclusion of half points, assigned according to standard methodologies (Wildman et al., 1982).
481
482
483
484
485
486
487
488
489