Edward T. Tipper
PII: S0009-2541(15)30096-6
DOI: doi:10.1016/j.chemgeo.2015.11.004
Reference: CHEMGE 17758
To appear in: Chemical Geology
Received date: 22 June 2015
Revised date: 26 October 2015
Accepted date: 7 November 2015
Please cite this article as: Hindshaw, Ruth S., Heaton, Tim H.E., Boyd, Eric S., Lindsay, Melody L., Tipper, Edward T., Influence of glaciation on mechanisms of
mineral weathering in two high Arctic catchments, Chemical Geology (2015), doi:
10.1016/j.chemgeo.2015.11.004
ACCEPTED MANUSCRIPT
Influence of glaciation on mechanisms of mineral weathering in two high Arctic
catchments
Ruth S. Hindshawa,∗, Tim H. E. Heatonb, Eric S. Boydc, Melody L. Lindsayc, Edward T. Tipperd
aDepartment of Earth and Environmental Sciences, University of St. Andrews, St. Andrews, UK bNERC Isotope Geosciences Laboratory, Nottingham, UK
cDepartment of Microbiology and Immunology, Montana State University, Bozeman, Montana, USA dDepartment of Earth Sciences, University of Cambridge, Cambridge, UK
Abstract
In order to investigate the effect of glaciation on mineral weathering, the stream water chemistry and the bacterial
community composition were analysed in two catchments containing nominally identical sedimentary formations but
which differed in the extent of glaciation. The stream waters were analysed for major ions,δ34S,δ18OSO4andδ18OH2O
and associated stream sediments were analysed by 16S rRNA gene tagged sequencing.
Sulfate comprised 72-86% and 35-45% of the summer anion budget (in meq) in the unglaciated and glaciated
catchments respectively. This indicates that sulfuric acid generated from pyrite weathering is a significant weathering
agent in both catchments. Based on the relative proportions of cations, sulfate and bicarbonate, the stream water
chemistry of the unglaciated catchment was found to be consistent with a sulfide oxidation coupled to silicate
dissolu-tion weathering process whereas in the glaciated catchment both carbonates and silicates weathered via both sulfuric
and carbonic acids.
Stable isotope measurements of sulfate, together with inferences of metabolic processes catalysed by resident
microbial communities, revealed that the pyrite oxidation reaction differed between the two catchments. Noδ34S
fractionation relative to pyrite was observed in the unglaciated catchment and this was interpreted to reflect pyrite
oxidation under oxic conditions. In contrast,δ34S and δ18OSO4 values were positively correlated in the glaciated
catchment and were positively offset from pyrite. This was interpreted to reflect pyrite oxidation under anoxic
condi-tions with loss of S intermediates.
This study suggests that glaciation may alter stream water chemistry and the mechanism of pyrite oxidation
through an interplay of biological, physical and chemical factors.
Keywords:
chemical weathering, pyrite, sulfur isotopes, bacteria, biogeochemical cycles
∗corresponding author
ACCEPTED MANUSCRIPT
1. Introduction1
The Arctic is currently experiencing a period of warming, resulting in the retreat of glaciers and an increase in the 2
active layer depth of permafrost (Vaughan et al., 2013). Major emphasis has been placed on quantifying the effects of 3
warming on nutrient fluxes, especially carbon (e.g. Schuur et al., 2009; Elberling et al., 2013), but major ion fluxes 4
from both permafrost and glaciated areas (MacLean et al., 1999; Frey and McClelland, 2009; Pokrovsky et al., 2012; 5
Nowak and Hodson, 2015) are also predicted to change with continued warming. Decreased permafrost cover is 6
expected to increase overall fluxes of solutes as the active layer deepens (MacLean et al., 1999; Frey and McClelland, 7
2009). Likewise, solute fluxes from glaciers are predicted to increase by virtue of the increased discharge as a result of 8
a longer melt season (Lafrenière and Sharp, 2005). However, it is unclear if, in addition to an increase in solute flux, 9
the composition of this flux will change and what affect these changes will have on the carbon cycle and the microbial 10
community which mediate many of the chemical reactions occurring in these environments (Skidmore et al., 2005; 11
Boyd et al., 2011, 2014). 12
Chemical weathering, which is a key part of the biogeochemical cycles of many elements, is assumed to mainly 13
occur by reaction with carbonic acid, formed by the dissolution of carbon dioxide (CO2) in water. However, where
14
sulfide minerals e.g. pyrite (FeS2) exist, sulfuric acid may form through the oxidation of sulfide, which can also
15
result in mineral dissolution (Holland, 1978). Understanding which agent is responsible for mineral dissolution is 16
important for understanding inputs to the sulfur biogeochemical cycle and for quantifying the contribution of sulfuric 17
acid weathering to global chemical weathering fluxes (Berner and Berner, 1996). Chemical weathering by sufuric 18
acid does not involve drawdown of atmospheric CO2and can even be a net source of CO2if carbonates are weathered.
19
Therefore, if this reaction were significant on a global scale then the weathering-climate negative feedback would be 20
weakened (Calmels et al., 2007; Li et al., 2008; Torres et al., 2014). 21
Sulfide oxidation coupled to carbonate dissolution (SOCD) is a key process determining stream water chemistry 22
in the high physical erosion environment of glaciated catchments (Fairchild et al., 1999; Tranter et al., 2002; Sharp 23
et al., 2002; Skidmore et al., 2005; Robinson et al., 2009; Wadham et al., 2010; Boyd et al., 2014). The high rates 24
of physical erosion expose both the carbonate and pyrite grains allowing them to weather rapidly. In non-glaciated 25
Arctic catchments, weathering is also strongly influenced by physical erosion processes such as frost shattering (Huh 26
and Edmond, 1999; Hall et al., 2002) and where sulfide is present, sulfide oxidation is a key chemical weathering 27
reaction (Elberling and Langdahl, 1998; Thorn et al., 2001; Calmels et al., 2007). Significant weathering by sulfuric 28
acid is also observed in other high erosion settings such as Taiwan and the Himalayas (Wolff-Boenisch et al., 2009; 29
Turchyn et al., 2013; Torres et al., 2014). 30
The stable isotopes of sulfate (δ34S andδ18OSO4) provide a useful tool with which to investigate the sources of
sul-31
fate and the reactions leading to sulfate formation (e.g. Mandernack et al., 2003; Calmels et al., 2007; Wadham et al., 32
2007; Turchyn et al., 2013). Based on stable isotope evidence, sulfate reduction was identified at Borup Glacier in 33
ACCEPTED MANUSCRIPT
Finsterwalderbreen, Svalbard (Wadham et al., 2004) but not in the pro-glacial area of the same glacier (Wadham et al., 35
2007). However, bacterial sequencing data from other catchments has failed to detect sulfate reducing bacteria where 36
water chemistry evidence suggested sulfate reduction was occurring (Skidmore et al., 2000, 2005). It is therefore not 37
clear how widespread this reaction is in glaciated environments. 38
The chemical reactions involving sulfide oxidation and sulfate reduction are microbially mediated and it is only in 39
the last 15 years that the diversity and functional importance of microorganisms in glacial landscapes has been recog-40
nised (e.g. Skidmore et al., 2000; Hodson et al., 2008). More recently, it has been shown that the microbial community 41
composition is strongly influenced by bedrock composition and that the microbial community strongly influences so-42
lute chemistry (Larouche et al., 2012; Montross et al., 2013; Mitchell et al., 2013). In particular, the presence of FeS2
43
was shown to be a dominant control on the composition of communities inhabiting the subglacial environment of 44
Robertson Glacier, Canada (Mitchell et al., 2013), which likely reflects the utilisation of energy derived from mineral 45
redox reactions to support primary productivity (Boyd et al., 2014). It is therefore probable that minerals which can 46
serve as electron donors and acceptors play a key role in determining the composition of microbial communities, and 47
by extension the chemical composition of solute fluxes, in other oligotrophic and obligately chemotrophic subglacial 48
environments. 49
This study focusses on two adjacent catchments with nominally identical lithology: sedimentary rocks known to 50
contain pyrite. One catchment was glaciated and the other was unglaciated and underlain by permafrost. We assume 51
that the extent of glacial cover is the primary cause of differences in hydrology, biology and chemistry between the 52
two catchments. The paired catchment approach provides clues to long-term changes in weathering processes induced 53
by deglaciation. The aim of the study was to utilise the combination of stream water chemistry, S and O isotopes of 54
sulfate, and molecular analyses of microbial community composition to investigate the formation of and the role of 55
sulfuric acid weathering in the two catchments. 56
2. Description of field area 57
Svalbard is located in the Arctic Ocean. The archipelago has an arctic climate with a mean annual air temperature 58
of -5◦C and mean annual precipitation of 180 mm (measured at Longyearbyen airport, Humlum et al., 2003).
Per-59
mafrost is continuous throughout the islands and can be up to 500 m thick (Humlum et al., 2003). The two studied 60
catchments are situated next to each other (Fig. 1) in the Paleogene sedimentary Central Basin of Svalbard. The sedi-61
mentary formations exposed in the catchments are from the Van Mijenfjorden group which is Paleocene to Eocene in 62
age (66 - 33.9 Ma) and contain sandstones, siltstones and shale (Fig. 2, Major et al., 2000). 63
Dryadbreen has been retreating since the end of the Little Ice Age (∼1890, Ziaja, 2001). The thermal regime 64
of the glacier is expected to be cold-based with temperate patches, based on similar sized glaciers in the same area 65
(Etzelmüller et al., 2000; Etzelmüller and Hagen, 2005). Between 1936 and 2006 the area of the glacier decreased 66
from 2.59 to 0.91 km2leaving large terminal and lateral ice-cored moraines and a sandur in front of the glacier (Ziaja
ACCEPTED MANUSCRIPT
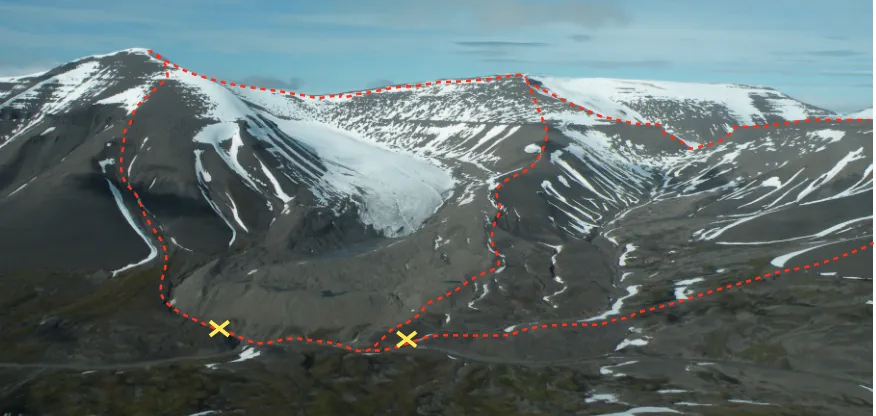
Figure 1: Panoramic view of the two study catchments. Dryadbreen is on the left and Fardalen on the right. The red dashed line demarcates the catchment boundaries and the yellow crosses indicate the water sampling locations for each catchment. Note the large end moraine and sandur in the glaciated catchment. Photograph credit: Alix Guillot.
and Pipała, 2007). The sandur surface lowered 14 m between 2001 and 2006 due to the melting of dead ice (Ziaja and 68
Pipała, 2007). The uppermost part of the catchment faces north-north-east and the valley then curves around such that 69
at lower elevations (<500 m) the catchment faces south-east. The catchment area is 4.8 km2and ranges in elevation
70
from 250 - 1031 m.a.s.l. The river in the sandur plain is braided, but the braids merge such that one stream drains 71
the end moraine. This stream was sampled just before the confluence with the river in the main valley. In this paper 72
‘Dryadbreen’ will be used to refer to the whole catchment and not just the glacier. 73
Fardalen is a non-glaciated catchment at the head of a valley of the same name. In contrast to Dryadbreen, the 74
whole catchment has a south-easterly aspect which contributes to the absence of present-day glaciation. The valley 75
is currently underlain by continuous permafrost and is likely to have been unglaciated for at least the last 10 kyr 76
(Svendsen and Mangerud, 1997). The catchment area is 3.4 km2and ranges in elevation from 250 - 1025 m.a.s.l. A
77
first-order stream drains the catchment and it was sampled just before the confluence with the river in the main valley. 78
3. Methods 79
3.1. Hydrology
80
Water stand and water temperature were recorded every 10 minutes by a CS450 Campbell Scientific pressure 81
transducer connected to a Campbell CR200X data logger. In Dryadbreen conductivity was recorded every 10 minutes 82
using a Ponsel CE4 meter. Water stand was converted to discharge using discharge measurements obtained by salt 83
tracing, which were performed using a point addition of 1-3 kg salt. The resulting change in conductivity ∼70 84
ACCEPTED MANUSCRIPT
20’ 40’
10’
15
oE
78
oN
2 0 km
Ice
Fluvial/glaciofluvial/marine shore deposits
Aspelintoppen Formation: sandstone, siltstone and shale, with thin coal seams
Battfjellet Formation: sandstone, subordinate siltstone and shale
Frysjaodden Formation: dark shale and siltstone, subordinate sandstone
Grumantbyen and Hollendardalen Formations: sandstone including shale Basilika Formation: dark shale and siltstone
Firkanten Formation: sandstone, siltstone and shale, with coal seams
Van Mijenfjorden Group (Paleocene-Eocene)
Adventdalen Group (Middle Jurassic - Lower Cretaceous)
[image:6.612.91.523.109.282.2]Carolinefjellet Formation: sandstone, siltstone, shale
Figure 2: Geological map of the study area. The red dot in the inset shows the location of the study area in relation to the rest of Svalbard. The two stars indicate the location of the two catchments: Dryadbreen (glaciated) and Fardalen (unglaciated). The red square marks the location of Nybyen (part of the town of Longyearbyen) and the red circle shows from where the photograph in Figure 1 was taken. The map and the legend are from Major et al. (2000).
conductivity meter and conversion to discharge was done following the procedure outlined in Hudson and Fraser 86
(2005). The amount of snow in May 2012 prevented installation of the loggers that early in the season, therefore high 87
resolution hydrological data is only available for the period 25thJuly to 3rdAugust 2012. In mid-May there was no
88
surface water and no sub-surface water was found by digging. Three weeks later, the landscape was still dominated 89
by snow but both streams were flowing. 90
3.2. Collection of water samples
91
The Dryadbreen and Fardalen streams were sampled twice a day from 14thto 18thJune 2012 and from 25thJuly
92
to 3rdAugust 2012. The number of days sampled corresponds to approximately 20% of the melt-season (Yde and
93
Knudsen, 2004). The two rivers were sampled just before they joined the main valley river. For Dryadbreen this 94
was approximately 1 km from the front of the glacier. Temperature and pH were measured in situ (Hanna HI 98160 95
pH meter). Water samples were filtered on the day of collection through 0.2µm nylon filters using a polycarbonate 96
vacuum filtration unit connected to a hand pump. A filtered water sample was titrated with 3.3 mM HCl within an 97
hour of collection and alkalinity was calculated from the titration curve using the Gran method (Stumm and Morgan, 98
1996). Assuming that alkalinity≈[HCO3−]+[CO32−] and using K1, K2, KHvalues for 4◦C, then HCO3−comprises
99
more than 99.9% of alkalinity for all samples and we therefore assume that the measured alkalinity is equivalent to 100
the bicarbonate concentration. Filtered samples were stored in pre-cleaned HDPE bottles and those intended for the 101
analysis of cations were acidified to pH 2 with single-distilled concentrated HNO3. Sulfate was pre-concentrated by
102
passing 3 L of filtered water through a column filled with 5 mL Dowex 1x8, 100-200 mesh chloride form resin. The 103
resin was pre-cleaned by rinsing with 60mL 3M HCl followed by 60 mL 18.2 MΩwater. Three snow samples were 104
ACCEPTED MANUSCRIPT
an HDPE bottle with a funnel. A supra-glacial stream sample was also collected. All of these samples were filtered 106
as described for river water samples. 107
3.3. Analysis of water samples
108
For all water samples, major cations and Si were measured by inductively-coupled plasma optical emission spec-109
trometry (ICP-OES, Perkin Elmer Optima 5300 DV at the University of Edinburgh) and anions by ion chromatography 110
(IC, Dionex DX 500 at Durham University). Measured cation concentrations of the water standards SLRS-5 (National 111
Research Council Canada) and BATTLE-02 (Environment Canada) were within 8% of the certified values. Measured 112
anion concentrations were within 5% of the certified values for LETHBRIDG-03 and BATTLE-02 (both Environment 113
Canada). External reproducibility, as measured by the mean normalized difference of 9 pairs of replicate field samples, 114
was<3% for cations and<5% for anions. Calculated charge balance errors (CBE) were<3% for the vast majority of 115
samples, confirming the accuracy of the anion and cation measurements (Table 1). 116
The oxygen isotopic composition (δ18OH2O) of water samples was measured on 750µL samples of water which
117
had been equilibrated with a mixture of 0.3% CO2and He in septum capped vials. The CO2/He mixture was measured
118
using a Gas Bench II (Thermo Scientific) connected to an isotope ratio mass spectrometer (IRMS, Delta PLUS XP, 119
Thermo Scientific at the University of St. Andrews). Measurements were calibrated with the international standards 120
SLAP-2, GISP and VSMOW-2. The results are reported in the conventional delta notation with respect to VSMOW 121
and sample standard deviation was less than 0.15h(2SD). 122
Sulfate from the anion resins was eluted with 2 M KCl, and the eluent acidified to pH 3 with HCl, heated to 123
sub-boiling, and barium sulfate precipitated by addition of BaCl2. The barium sulfate was then recovered by four
124
cycles of centrifugation, discard of the supernatant, and washing in de-ionised water before oven drying at 80◦C. The
125
sulfate blank for the process is less than 0.5 mg BaSO4(limit of determination), which is less than 1% of the smallest
126
sample.34S/32S ratios were determined by combustion to SO
2with V2O5in an EA-1120 elemental analyser on-line to
127
an IRMS (Delta+XL, ThermoFinnigan at the NERC Isotope Geosciences Laboratory), with34S/32S ratios calculated
128
asδ34S values versus CDT by comparison with standards IAEA SO6 and NBS-127. Analytical precision of replicates
129
was typically≤0.2h(1 SD).18O/16O ratios were determined by thermal conversion to CO in a TC/EA on-line to an
130
IRMS (Delta+XL, ThermoFinnigan at the NERC Isotope Geosciences Laboratory), with18O/16O ratios calculated as
131
δ18O
SO4values versus SMOW by comparison with standards IAEA SO5 and SO6. Analytical precision of replicates
132
was typically<0.5h(1 SD). 133
3.4. Analysis of solid samples
134
Three rock samples were collected: R01 was collected from the Frysjaodden Formation (Fig. 2) in Fardalen, 135
R02 was collected from the sandur in Dryadbreen and R04 was collected from the surface of the glacier. The rock 136
samples, in addition to a sediment sample taken at the water sampling location in each catchment (O - Dryadbreen 137
ACCEPTED MANUSCRIPT
spectrometry (XRF, PANalytical Axios at the Norwegian Geological Survey) and all samples were analysed by X-139
ray diffraction (XRD). S contents of the rock samples were analysed by high temperature combustion followed by 140
infrared detection (Leco SC-444 at the Norwegian Geological Survey). XRD analysis was performed on a PANalytical 141
PW1050 X-ray diffractometer with a Hiltonbrooks DG2 X-ray generator (Co-Kαradiation) at the University of St. 142
Andrews. Data were collected between 5 and 70◦2
θwith a step size of 0.02◦and a counting time of 3 s per step.
Semi-143
quantitative mineralogical abundances were obtained using the Siroquant software. The typical error on abundances is 144
estimated to be 5-10%. Carbon isotope analysis of calcite from R02 was performed by reaction of whole rock powder 145
with anhydrous phosphoric acid overnight at 25◦C and subsequent analysis of the liberated CO
2in a MAT 253 mass
146
spectrometer (ThermoFinnigan at the NERC Isotope Geosciences Laboratory).13C/12C ratios were converted toδ13C
147
values versus VPDB by comparison with a laboratory calcite standard calibrated against NBS-19 and NBS-18. 148
Pyrite was separated from two shale samples by using a solution of lithium heteropolytungstate (LST). The sep-149
arated fraction contained both pyrite and magnetite and the pyrite was separated from magnetite using a magnet and 150
hand-picking. Pyrite separates were ground to a powder in an agate mortar and34S/32S ratios determined by
com-151
bustion to SO2with V2O5in an EA-1120 elemental analyser on-line to an IRMS (Delta+XL, ThermoFinnigan at the
152
NERC Isotope Geosciences Laboratory), with34S/32S ratios calculated as δ34S values versus CDT by comparison
153
with standards IAEA S-1 and S-2. Analytical precision of replicates was≤0.4h(1 SD). 154
Suspended sediment samples (>0.2µm, collected on nylon filter papers) were washed offthe filter papers using 155
deionized water and freeze-dried. Depending on the amount of sediment recovered, part or all of the sample was 156
then reacted overnight with 1.5 M HCl to remove carbonates, washed free of acid, dried and homogenised. 13C/12C
157
ratios were determined by combustion to CO2 in an EA-1120 elemental analyser on-line to an IRMS (Delta+XL,
158
ThermoFinnigan at the NERC Isotope Geosciences Laboratory), with13C/12C ratios calculated asδ13C values versus
159
VPDB by comparison with laboratory standards calibrated against NBS 19 and IAEA CH-7. Analytical reproducibil-160
ACCEPTED MANUSCRIPT
3.5. Sequencing of bacterial 16S rRNA genes
162
Four surface sediment samples were sequenced: two from Fardalen collected in spring at the water sampling 163
location, L (river sediment) and M (sediment by the side of the river resting on snow) and two from Dryadbreen 164
collected in summer, A (sediment from a pool of water in the sandur, not connected to main river) and O (sediment 165
adjacent to the river at water sampling location). Sediment samples were scooped directly into either sterile 300 mL 166
PVC containers or sterile 50 mL centrifuge tubes. The samples were stored at ambient temperature (<4◦C) until they
167
were transported to the lab where they were desiccated by drying at 40◦C (4 days). Desiccated samples were shipped
168
internationally to the USA where they were subjected to molecular analyses. 169
Nucleic Acid Extraction and Quantification. DNA extraction and purification were carried out with a Fast 170
DNA Spin Kit for Soil (MP Biomedicals, Solon, OH). DNA was extracted in triplicate from three independent 250 171
mg subsamples of sediment. Equal volumes of each replicate extract were pooled and the concentration of DNA 172
was determined using a Qubit dsDNA HS Assay kit (Molecular Probes, Eugene, OR) and a Qubit 2.0 Fluorometer 173
(Invitrogen, Carlsbad, CA). 174
PCR Amplification of bacterial and archaeal 16S rRNA Genes from Genomic DNA.Purified genomic DNA 175
extracts were subjected to amplification of bacterial and archaeal 16S rDNA using primers 176
344F (5’-ACGGGGYGCAGCAGGCGCGA-3’) and 915R (5’-GTGCTCCCCCGCCAATTCCT-3’) at an annealing 177
temperature of 61◦C or 1100F (5’-YAACGAGCGCAACCC-3’) and 1492R (5’-GGTTACCTTGTTACGACTT-3’) at
178
an annealing temperature of 55◦C, respectively (Boyd et al., 2007). Approximately 1 ng of purified genomic DNA
179
was subjected to PCR in triplicate using the following reaction conditions: initial denaturation at 94◦C (4 min),
180
followed by 35 cycles denaturation at 94◦C (1 min), annealing at the optimal temperature for the primer pair (1 min),
181
primer extension at 72◦C (1.5 min), followed by a final extension step at 72◦C for 20 min. Reactions contained 2 mM
182
MgCl2(Invitrogen, Carlsbad, CA), 200µM each deoxynucleotide triphosphate (Eppendorf, Hamburg, Germany), 0.5
183
µM forward and reverse primer (Integrated DNA Technologies, Coralville, IA), 0.4 mg ml−1molecular-grade bovine
184
serum albumin (Roche, Indianapolis, IN), and 0.25 units Taq DNA polymerase (Invitrogen, Carlsbad, CA) in a final 185
reaction volume of 50µL. Positive control reactions were performed using genomic DNA fromAzotobacter vinelandii
186
DJ andSulfolobus solfataricusP2. Negative control reactions were performed in the absence of added genomic DNA. 187
PCR amplicons were only obtained from extracts when bacterial primer sets were applied. Archaeal 16S rRNA gene 188
amplicons were not recovered from any of the four sediment DNA extracts. 189
Sequencing and analysis of bacterial 16S rRNA genes. Bacterial 16S rDNA amplicons were sequenced by 190
Molecular Research LC (Lubbock, TX). 16S rDNA from each site were barcoded and were sequenced using a 454 191
Genome Sequencer FLX System. Post sequence processing was performed using the Mothur (ver. 1.33.3) sequence 192
analysis platform (Schloss et al., 2009). Raw libraries were trimmed to a minimum length of 250 bases and were sub-193
jected to a filtering step using the quality scores file to remove sequences with anomalous base calls. Unique sequences 194
were aligned using SILVA databases and sequences were trimmed using a defined start and end sites and a maximum 195
ACCEPTED MANUSCRIPT
and chimeras were identified and removed using UCHIME (Edgar et al., 2011). Operational taxonomic units (OTUs) 197
were assigned at a sequence similarity of 0.03 using the furthest-neighbour method. The remaining sequences were 198
randomly sub-sampled in order to normalize the total number of sequences in each library. Collectively, these steps 199
resulted in a normalized size of 1077 bacterial 16S rRNA gene sequences for each assemblage. Sequences were clas-200
sified using the Bayesian classifier (Wang et al., 2007) and the RDP database, with manual verification using BLASTn 201
(Supp. Table 1). Sequences representing each OTU have been deposited in the NCBI SRA database under accession 202
number SRR1562043. 203
Sequences representing each unique OTU (defined at 0.03% sequence identities) were compiled for each domain. 204
ClustalX (ver. 2.0.9, Larkin et al., 2007) was used to align nucleic acid sequences using default parameters and the 205
alignment was subjected to evolutionary model prediction via jModeltest (ver. 2.1.1, Darriba et al., 2012), Maximum-206
Likelihood phylogenetic reconstruction via PhyML (version 3.0, Guindon and Gascuel, 2003) specifying the general 207
time reversible model and gamma distributed rate variation with a proportion of invariable sites, and rate smoothing 208
using the multidimensional version of Rambaut’s parameterization as implemented in PAUP (ver. 4.0, Swofford, 209
2001) as previously described (Meuser et al., 2013). Phylocom was used to calculate Rao’s community phylogenetic 210
relatedness for the bacterial assemblages using relative sequence abundance weights and the rate-smoothed ultrameric 211
tree. PAST (ver. 1.72, Hammer et al., 2001) was used to generate cluster dendograms specifying single linkage and 212
Euclidean distances. Bootstrap values correspond to the frequency that each node was observed in a given position 213
out of 1000 replicates. 214
3.6. Precipitation correction
215
Snow is the primary source of precipitation to the two studied catchments, but the chemical composition of the 216
water derived from melting snow varies temporally (e.g. Johannessen and Henriksen, 1978). Therefore instead of 217
using the snow samples collected for this study, which were collected relatively late in the season as a measure of 218
precipitation inputs, we compiled literature data on pre-melt Svalbard snow-pack chemistry (Hodgkins et al., 1997; 219
Wynn et al., 2006; Tye and Heaton, 2007; Yde et al., 2008). Pre-melt snow-pack samples are typically taken in 220
April and are assumed to represent “fresh” snow. From these data averageX/Cl ratios were calculated, without any 221
weighting, whereXis a major cation or anion. By assuming that chloride is conservative and only derived from 222
precipitation, the stream water data are corrected for snow inputs using the following formula: 223
X∗=Xriver−(X/Cl)snow·Clriver (1)
whereX∗andX
riverdenote precipitation-corrected and uncorrected concentrations respectively. TheX/Cl ratios used 224
for the precipitation correction were (±1SD, n=8-10): Ca/Cl 0.11±0.10, Mg/Cl 0.09±0.04, Na/Cl 0.85±0.09, K/Cl 225
0.02±0.01 and SO4/Cl 0.11±0.04. The propagated error on the precipitation corrected values in summer was less than
226
7% (RSD) for K and Na and less than 4% (RSD) for Ca, Mg and SO4. In spring, the propagated error was higher
ACCEPTED MANUSCRIPT
Table 2: Precipitation-correctedδ34S andδ18OSO4values (δ34S∗andδ18OSO4∗).Sample SO4in δ34S δ34S∗ δ18OSO4 δ18OSO4∗
precipitation
(YYYYMMDD) % h h h h
Dryadbreen (glaciated) - spring
20120615D 21.3 -0.6 -4.5 -6.0 -10.2
20120617D 29.0 0.7 -4.7 -5.4 -11.5
Dryadbreen (glaciated) - summer
20120725D 4.8 -2.0 -2.8 -7.7 -8.6
20120727D 3.5 -2.3 -2.9 -8.1 -8.7
20120729D 3.8 -2.3 -2.9 -8.0 -8.7
20120731D 3.6 -2.6 -3.2 -9.7 -10.4
20120802D 4.9 -2.3 -3.1 -8.5 -9.4
Fardalen (unglaciated) - spring
20120614F 5.6 -3.6 -4.6 -8.1 -9.2
20120616F 6.4 -3.7 -4.9 -8.1 -9.2
20120618F 5.3 -3.4 -4.4 -8.4 -9.4
Fardalen (unglaciated) - summer
20120726F 1.1 -6.7 -6.9 -9.7 -9.9
20120728F 0.9 -7.1 -7.3 -9.5 -9.7
20120730F 1.0 -7.0 -7.2 -9.7 -9.9
20120801F 0.8 -7.7 -7.8 -10.1 -10.2
20120803F 0.9 -7.1 -7.3 -10.1 -10.2
due to the greater amount of snow-melt and the error was consistently higher in Dryadbreen. Errors were less than 228
25% (RSD) except for Na in Dryadbreen which were closer to 50% (RSD). Theδ34S andδ18OSO4values were also
229
corrected for snow inputs (Table 2). Reported values for theδ34S composition of snow in Svalbard vary from+11.5
230
to+18.0h(Tye and Heaton, 2007). To estimate a value ofδ34S for the snow pack we took the percentage of SO4
231
derived from snow for the spring samples and extrapolated to aδ34S value at 100% SO4from snow (Fig. 3). The value
232
estimated for snow using this approach was+14hwhich is within the range previously reported (Tye and Heaton,
233
2007). Using this value,δ34S values were corrected using the following formula: 234
δ34S∗=(δ34Sriver−f ·δ34Ssnow)/(1−f) (2)
wherefis the fraction of SO4from snowmelt.δ18OSO4values were corrected in an identical manner to that described
235
above forδ34S using a snow value of+9.5hbased on a fresh snow sample from Svalbard (Tye and Heaton, 2007). 236
Unless otherwise stated, precipitation-corrected values are used in all figures in this manuscript and are indicated by 237
an asterisk. 238
4. Results 239
4.1. Water chemistry and hydrology
240
The water samples taken in spring were dominated by snow-melt as evinced by the high proportion of Cl and 241
Na compared to the summer samples (Fig. 4, Table 1). The most abundant anion in Dryadbreen was HCO3−which
242
comprised 48-58% of the major anions (in meq) in summer. This was in stark contrast to Fardalen where SO42−was
243
ACCEPTED MANUSCRIPT
0 5 10 15 20 25 30 35
!"
!#
!$
!%
0
2
%SO
$from precipitation
!
&$
'!'(
$
)*+,-./0$,#+
(R2=0.99, p<0.001)
spring summer Fardalen
[image:13.612.203.430.107.283.2]Dryadbreen
Figure 3: Stream waterδ34S values against the calculated %SO
4derived from precipitation. The regression line is derived from the spring samples
only. Theδ34S value when 100% SO4is derived from precipitation is+14hwhich is comparable with the+11.5 to+18.0hrange reported
for snow (fresh snow and snow-pack) from Svalbard by Tye and Heaton (2007). Theδ34S value when 0% SO4is derived from precipitation is
-4.6±0.2hand is assumed to represent sulfate derived from a pyrite weathering source. The summer samples do not lie on the mixing line between snow and a pyrite source which either indicates additional pyrite sources with differentδ34S values or fractionation processes. Error bars smaller than symbol size are not depicted.
abundances of cations were similar in both catchments (Fig. 4). In Dryadbreen precipitation sources accounted for 245
34-48% of the cation abundance (in meq) in spring and 10% in summer. In Fardalen, the precipitation contribution 246
to the cation abundance was slightly less: 19-29% in spring and 4% in summer. The abundances of Ca and Mg were 247
very similar in both catchments but in Fardalen Mg was consistently more abundant compared to Dryadbreen where 248
Ca was most abundant. The total dissolved load of Fardalen (53±7 mgL−1, 1SD) was approximately double that of
249
Dryadbreen (25±4 mgL−1, 1SD).
250
Theδ18OH2Ovalue of the stream water varied from around -15hin spring to around -13hin summer (Table 1),
251
reflecting the decrease in snow cover from spring to summer (Hindshaw et al., 2011). There is no significant diff er-252
ence inδ18OH2Ovalues between the two catchments reflecting a common precipitation source. The sulfur isotopic
253
composition of sulfate (δ34S) decreased from spring to summer: from+0.73 to -2.64hin Dryadbreen and from -3.40 254
to -7.66hin Fardalen (Table 1). Similar toδ34S values,δ18O
SO4 values exhibited a seasonal shift towards lower
255
values in summer with the lowest value (-10.1h, Table 1) measured in Fardalen. 256
The discharge of both streams at the time of sampling is given in Table 1. Both streams exhibit diurnal cycles in 257
discharge and the range of discharge measured in both catchments was 0-0.5 m3s−1(not including periods of logger
258
malfunction), but the median discharge over the period of data collection for Dryadbreen (0.40 m3s−1) was greater
259
than for Fardalen (0.22 m3s−1).
ACCEPTED MANUSCRIPT
Table 3: XRF data for rock samples.Sample Class1 Fm.2 SiO
2 Al2O3 Fe2O3 TiO2 MgO CaO Na2O K2O MnO P2O5 LOI3 Total
wt% wt% wt% wt% wt% wt% wt% wt% wt% wt% wt% wt%
R01 Shale Fry. 63.2 16.3 7.1 0.8 1.4 0.3 1.0 2.6 0.1 0.3 7.5 101.0
R02 Wacke Batt. 65.4 13.0 7.9 0.6 1.5 0.6 0.7 2.2 0.1 0.3 7.2 99.5
R04 Shale Fry. 57.1 19.1 3.5 0.9 1.3 0.2 0.6 3.6 0.0 0.1 12.9 99.3
1Classification using SandClass for terrigenous sands and shales (Herron, 1988).
2Formation assignment based on Schlegel et al. (2013). Fry.=Frysjaodden Formation and Batt.=Battfjellet Formation. 3LOI=Loss on Ignition.
4.2. Solid samples
261
Based on the SandClass system for terrigenous sand and shale samples (Herron, 1988), R01 and R04 were clas-262
sified as shales and R02 as a wacke (Table 3). Schlegel et al. (2013) have previously classified rock core samples 263
from the Frysajodden Formation as shales and those from the Battfjellet and Aspelintoppen formations as wackes and 264
litharenites respectively. We therefore assume that R01 and R04 originated from the Frysajodden Formation and R02 265
from the Battfjellet Formation (Fig. 2). The main minerals in the bulk rock and sediment samples analysed by XRD 266
were quartz, plagioclase, chlorite, kaolinite, illite/mica and illite/smectite (Table 4). Clay minerals accounted for 44% 267
(sediment O) to 65% (R04) of the total composition. Calcite abundance was below 1% in all samples analysed. How-268
ever, calcite was detected in XRD analysis of orientated clay fractions from river sediments collected in the glaciated 269
catchment (Dryadbreen) but not in sediments collected from the unglaciated catchment (Fardalen). The low calcite 270
abundance is in agreement with previous studies which report<1-2% carbonate in core samples from these formations 271
(Dypvik et al., 2011; Schlegel et al., 2013). Calcite in rock sample R02 had aδ13C value of -1.7h(Table 5). The 272
δ13C values of suspended sediments show neither temporal nor spatial variation and the average value of -26h(Table 273
5) reflects carbon fixed by the Calvin-Benson-Bassham cycle (C3) which may be of plant (Kendall and Doctor, 2003) 274
or microbial origin (Havig et al., 2011). 275
Pyrite was detected in the bulk phase XRD analysis of R02 (Table 4) and was separated from both R01 and R02. 276
No gypsum was detected by XRD analysis and none was detected in thin sections from these same formations (Dypvik 277
et al., 2011; Schlegel et al., 2013). The S content of R01 and R02 was 0.02 and 0.90 wt% respectively. Assuming 278
that all the S is from pyrite with a formula FeS2, then this corresponds to 0.04 and 1.69 wt% pyrite in the two rocks
279
samples, in agreement with the XRD data (Table 4). It is therefore highly likely that pyrite is the main S-bearing 280
mineral phase in these rock samples. Theδ34S values of pyrite mineral separates from samples R01 and R02 were
281
-5.4±0.4hand -7.6±0.2h(1SD) respectively (Table 5). The difference in values is likely due to the two samples 282
being derived from different formations (Table 3). 283
4.3. Bacterial community composition
284
The phylogenetic affiliation of the 16S rRNA genes recovered from the sediment samples, as determined by 285
ACCEPTED MANUSCRIPT
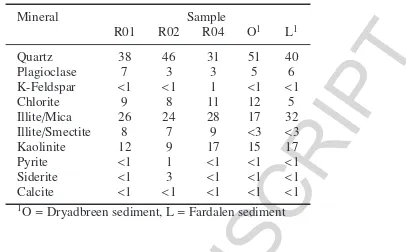
Table 4: Semi-quantitative mineral abundances (% total) in rock and sediment samples.Mineral Sample
R01 R02 R04 O1 L1
Quartz 38 46 31 51 40
Plagioclase 7 3 3 5 6
K-Feldspar <1 <1 1 <1 <1
Chlorite 9 8 11 12 5
Illite/Mica 26 24 28 17 32
Illite/Smectite 8 7 9 <3 <3
Kaolinite 12 9 17 15 17
Pyrite <1 1 <1 <1 <1 Siderite <1 3 <1 <1 <1 Calcite <1 <1 <1 <1 <1
1O=Dryadbreen sediment, L=Fardalen sediment
Table 5: Summary of C contents and C and S isotope data of solid samples.
Sample C 1SD∗ δ13C 1SD∗ δ34S 1SD∗
wt% h h
>0.2µm suspended sediments
Dryadbreen (glaciated)
20120615D# 4.07 -26.1
20120617D# 2.88 -26.3
20120725D 2.17 -25.6
20120725D# 2.33 0.10 -26.2 0.1
20120727D# 2.17 -26.2
20120729D 2.60 -25.7
20120729D# 2.64 0.25 -26.2 0.0
20120731D 2.46 -25.6
20120731D# 2.30 0.10 -26.2 0.1
20120802D# 2.54 -26.4
Fardalen (unglaciated)
20120616F# 2.43 -26.4
20120618F# 2.02 -26.6
20120726F# 2.59 -26.8
20120728F# 2.63 -26.0
20120730F# 2.49 -26.5
Pyrite mineral separates
R01 -5.4 0.4
R02 -7.6 0.2
Calcite mineral separate
R02 -1.7
∗Errors reported where there was enough sample material
for repeat measurements.
# Denotes that sample was treated with 5% HCl to remove carbonates.
Clear differences were observed in the composition of sediment associated bacterial communities that were sub-287
merged in the stream versus those that were collected on the banks of the stream. For example, samples M (Fardalen, 288
sediment on snow adjacent to river) and O (Dryadbreen, sediment adjacent to river) both comprised large numbers 289
of firmicutes, whereas the two samples collected under water (A and L) contained very low abundances of these lin-290
eages (Fig. 5b). A (Dryadbreen) and L (Fardalen) were dominated by sequences affiliated with Proteobacteria (48 291
and 65% of the total bacterial community, respectively) with those affiliated with Betaproteobacteria representing the 292
most abundant proteobacterial class (21% and 31% respectively). Sequencing studies from glaciated environments 293
have found that Betaproteobacteria are the dominant phylogenetic group in subglacial and proglacial sediments where 294
ACCEPTED MANUSCRIPT
0.8
0.8
0.6 0.4
0.6 0.4
0.4 0.2
0.2
Na+ + K+
Mg2+ Ca2+
Cl
-SO4 2-HCO3
-0.2
0.4
0.6
0.8
0.8 0.6 0.4 0.2
0.8
0.6
0.4
0.2
Dryadbreen (glaciated)
Uncorrected spring summer
Precipitation-corrected spring summer
Fardalen (unglaciated) 0.2
0.6
[image:16.612.117.495.113.341.2]0.8
Figure 4: Major ion water chemistry (in meq) shown in ternary diagrams. Uncorrected data are shown as open diamonds and precipitation corrected data are shown as filled-in circles. The data are further divided into samples collected in spring and those collected in summer. The striking difference between the two catchments is in their relative anion abundances with Dryadbreen (glaciated) dominated by HCO3−and Fardalen
(unglaciated) dominated by SO42−. Error bars are smaller than the symbols.
Mitchell et al., 2013). 296
Differences in the composition of the bacterial communities associated with sediments sampled from the two sub-297
merged sites A (Dryadbreen) and L (Fardalen) were also apparent. For example, sequences affiliated with the anaero-298
bic phylum Bacteriodetes represented the most abundant phylum (24%) in the community sampled from Dryadbreen 299
(A), whereas Bacteriodetes represented only a minor fraction of the community (3%) from Fardalen (L). This may 300
indicate a shift toward more anaerobic metabolisms in the proglacial sediment bacterial communities at Dryadbreen. 301
In the discussion we will focus on sediment samples A and L as representative of each catchment since they 302
were collected under water and therefore are most likely to be adapted to or responsible for the differences in water 303
chemistry observed between the two catchments. 304
5. Discussion 305
5.1. Overall weathering reactions
306
The most obvious difference between the two streams is in the anion composition: Dryadbreen is dominated by 307
HCO3−, whereas Fardalen is dominated by SO42−. This indicates that different weathering reactions are occurring
308
in the two catchments despite nominally identical lithology. A first indication of which weathering reactions are 309
ACCEPTED MANUSCRIPT
AO
L
M
Phylogenetic affiliation
Acidobacteria Actinobacteria Alphaproteobacteria
Bacteroidetes Betaproteobacteria Deltaproteobacteria
Firmicutes Gammaproteobacteria Other
Unclassified
Unc. Proteobacteria
Dissimilarity
0.5 0
Amount (%)
24 21 10 15 17
23 31 17 11
31 27 17
31 15 10 12
0 25 50 75 100
a b
Figure 5: (a) Dendrogram based on the Rao phylogenetic diversity index (Rao, 1982) which depicts the degree of phylogenetic dissimilarity between the bacterial communities associated with the different sediment samples. Samples A and O were collected in Dryadbreen (red letters) and L and M were collected in Fardalen (blue letters). Samples A and L were collected under water and form a cluster, indicating they are more similar in their bacterial phylogenetic composition as compared to samples O and M. Sample O was collected adjacent to the river and sample M was collected adjacent to the river but on top of snow. (b) Relative abundance of bacterial phyla or classes (Proteobacteria only) based on percent identities to their closest cultivated sequence, as determined by BLASTn analysis. The phyla Armatimonadetes, Chlamydiae, Gemmatimonadetes, Nitrospinae, Nitrospira, Nitrospirales, Planctomycetes, TM7, Verrucomicrobia and WS3 are grouped together in ‘Other’.
with either carbonic or sulfuric acids will give distinct ratios of cations versus SO42−and HCO3−(Fairchild et al.,
311
1994; Tranter et al., 2002; Wadham et al., 2010). Example reactions and their corresponding slopes in units of 312
equivalents (eq) are presented below (Eqns. 3-6) and in Table 6. Feldspars are the primary silicate minerals in these 313
rocks and although feldspars are a compositional solid solution between CaAl2Si2O8, NaAlSi3O8and KAlSi3O8, the
314
variation in composition does not affect the ratio (in equivalents) of the product cation (Na+, K+, Ca2+) to either the
315
HCO3−or the SO42−produced (cf. Eqns 5a, 5b, 6a and 6b). Analogous equations can be written for the main
Mg-316
bearing silicate phases: illite ((Al,Mg,Fe)2(Si,Al)4O10OH2) and chlorite ((Mg,Fe)3(Si,Al)4O10) (Table 4). In addition
317
to mineral weathering, the oxidation of organic matter will produce HCO3−, and this reaction, which is expected to
318
[image:17.612.94.521.101.285.2]ACCEPTED MANUSCRIPT
Carbonate dissolution with carbonic acid (CDC)
Ca1−x(Mgx)CO3(s)+CO2(aq)+H2O(l)⇋(1−x)Ca2+(aq)+xMg2+(aq)+2HCO−3(aq) (3)
Aerobic sulfide oxidation coupled to carbonate dissolution (SOCD)
16Ca1−x(Mgx)CO3(s)+4FeS2(s)+15O2(aq)+14H2O(l)⇋ 16(1−x)Ca2+(aq)+16xMg2+(aq)+16HCO−
3(aq)+8S O 2−
4 (aq)+4Fe(OH)3(s) (4a)
Anaerobic sulfide oxidation coupled to carbonate dissolution (SOCD)
4Ca1−x(Mgx)CO3(s)+FeS2(s)+14Fe(OH)3(s)⇋ 4(1−x)Ca2+(aq)+4xMg2+(aq)+4HCO−
3(aq)+15Fe(OH)2(s)+2S O24−(aq)+4H2O(l) (4b)
Silicate dissolution with carbonic acid, divalent cation (SDC)
2CaAl2S i2O8(s)+4CO2(aq)+6H2O(l)⇋
2Ca2+(aq)+4HCO−
3(aq)+Al4S i4O10(OH)8(s) (5a)
Silicate dissolution with carbonic acid, monovalent cation (SDC)
2NaAlS i3O8(s)+2CO2(aq)+11H2O(l)⇋
2Na+(aq)+2HCO−3(aq)+Al2S i2O5(OH)4(s)+4H4S iO4 (5b)
Sulfide oxidation coupled to silicate dissolution, divalent cation (SOSD)
2CaAl2S i2O8(s)+FeS2(aq)+
15 2O2(aq)+
11
2H2O(l)⇋ 2Ca2+(aq)+2S O2−
4 (aq)+Al4S i4O10(OH)8(s)+Fe(OH)3(s) (6a)
Sulfide oxidation coupled to silicate dissolution, monovalent cation (SOSD)
16NaS i3O8(s)+4FeS2(aq)+15O2(aq)+86H2O(l)⇋
16Na+
(aq)+8S O2−
4 (aq)+4Al4S i4O10(OH)8(s)+4Fe(OH)3(s)+32H4S iO4(aq) (6b)
Organic matter oxidation (OMO)
CH2O+O2⇋CO2+H2O⇋HCO−
3+H
+ (7)
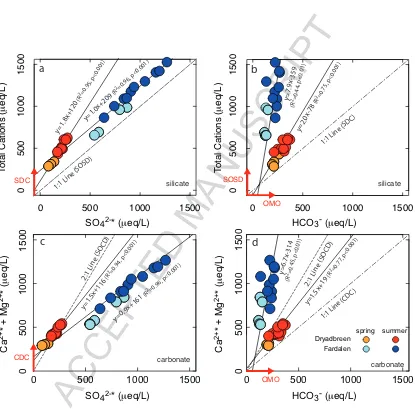
In the unglaciated catchment, Fardalen, the slope of the data in a plot of total cations versus SO42− (Fig. 6a) is
320
1.04±0.04 which is the same as the slope which would be expected by sulfide oxidation coupled to silicate weathering 321
(SOSD, Eqn. 6). The intercept of this line is not zero which suggests that a portion of the cations are being produced 322
by other weathering reactions such as silicate dissolution by carbonic acid (SDC, Eqn. 5). In Figs. 6b and 6d, the 323
slopes greater than 1 (carbonic acid weathering of silicates and carbonates, Table 6), together with the greater scatter 324
of the Fardalen points support the notion that sulfuric acid is the main weathering agent in this catchment. In summary, 325
ACCEPTED MANUSCRIPT
Table 6: Predicted and observed slopes of Ca+Mg and total cations versus either SO42−or HCO3−.Reaction Predicted slope (in eq)
Ca2++Mg2+ Ca2++Mg2+ Total Cations Total Cations vs SO42− vs HCO3− vs SO42− vs HCO3−
Carbonate+H2CO3(Eqn. 3) ∞ 1 -
-Carbonate+H2SO4(Eqn. 4a,b) 2 2 -
-Silicate+H2CO3(Eqn. 5a,b) - - ∞ 1
Silicate+H2SO4(Eqn. 6a,b) - - 1 ∞
Observed slope
Dryadbreen 1.54±0.14 1.48±0.29 1.84±0.18 2.04±0.42
Fardalen 0.88±0.04 6.68±2.10 1.04±0.04 7.92±2.50
7, the data from Fardalen is consistent with weathering mainly by a sulfide oxidation coupled to silicate dissolution 327
process. 328
If only silicate minerals were weathering in the glaciated catchment (Dryadbreen) then the slopes of the data in 329
Figs. 6a and 6b, which lie intermediate between SOSD (Eqn. 6) and SDC (Eqn. 5), would suggest that silicates 330
are weathered by both carbonic and sulfuric acid. However, if it were assumed that all the Ca and Mg came from 331
carbonates then the data points would also be consistent with carbonate weathering by sulfuric and carbonic acids 332
(Figs. 6c and 6d). In summary, the data from Dryadbreen suggests that all four reactions are occurring i.e. weathering 333
of both silicates and carbonates by both carbonic and sulfuric acid and further data from, for example,δ13C-DIC and
334
87Sr/86Sr, would be needed to constrain the relative proportions of the different reactions.
335
The high proportion of silicate weathering in the unglaciated catchment is likely due to the presence of the active 336
layer (the seasonally thawed top layer of soil above permafrost). If, over a long enough period, the active layer has 337
remained at a constant depth, this would mean that despite frost-shattering exposing fresh mineral surfaces, the vast 338
majority of carbonate phases will have already been leached, leaving behind the silicate minerals to weather. This 339
is in agreement with the lack of carbonate detected by XRD in the orientated clay fractions of solid samples from 340
Fardalen (Section 4.2). However, if the active layer deepens through a warming climate then fresh carbonates could 341
become exposed (Keller et al., 2010). In contrast, high rates of physical erosion still occur in the glaciated catchment 342
exposing carbonates to chemical weathering. 343
The nature of the weathering reactions in the glaciated catchment is in agreement with the conclusions of Tranter 344
et al. (2002) who identified sulfide oxidation and Fe(III) reduction as key reactions in subglacial environments. The 345
importance of sulfide oxidation reactions is also apparent in high-latitude unglaciated, permafrost dominated catch-346
ments (Fig. 6). This is in contrast to low-latitude, unglaciated catchments where weathering reactions are mainly 347
driven by reaction with CO2either from respiration or from the atmosphere (Tranter et al., 2002).
348
Although the information in Fig. 6 provides an overview of the weathering reactions occurring in each catch-349
ment, further processes may modify these broad interpretations. Firstly, it is assumed that reactions have idealised 350
stoichiometry and secondly, reactions removing solutes are not considered. The latter point is especially critical in 351
subglacial environments where carbonate precipitation and sulfate reduction can occur (Wadham et al., 2004). Car-352
bonate precipitation would decrease Ca2+and HCO
3−, whereas sulfate reduction would decrease SO42−. All water
ACCEPTED MANUSCRIPT
samples were undersaturated with respect to calcite and we therefore assume that carbonate precipitation did not have 354
a significant impact on the stream water chemistry. In the following section we utilise the fact that the isotopes of sul-355
fate (δ34S andδ18OSO4) are fractionated during reduction and can therefore be used to assess whether sulfate reduction
356
is occurring and under what conditions. 357
5.2. Oxic or anoxic weathering conditions?
358
Sulfate reduction only occurs under anoxic conditions and previous studies have distinguished between aerobic 359
and anaerobic environments based on the source of O atoms in sulfate (e.g. Bottrell and Tranter, 2002; Wadham et al., 360
2004). There are two main sources of oxygen: atmospheric O2and aqueous oxygen (H2O) and each has a distinct
361
isotopic composition. 362
During the oxidation of sulfide to sulfate the exchange of oxygen atoms in the intermediate molecules is very 363
rapid but once sulfate has formed then exchange is negligible (Lloyd, 1968). Previously it has been assumed that if 364
more than 75% of the O atoms in sulfate derive from water then the pyrite was oxidised under anoxic conditions and 365
less than 75% implied oxidation under oxic conditions (Taylor et al., 1984; van Everdingen and Krouse, 1985). The 366
fraction of O atoms in sulfate derived from atmospheric O2or water can be calculated as follows (Balci et al., 2007):
367
δ18O∗SO4=x(δ18OH2O+ε18OSO4-H2O)+(1−x)(δ18OO2+ε18OSO4-O2) (8)
wherexis the fraction of O atoms derived from H2O andεare the fractionation factors. When this principle was
368
applied to glaciated catchments it was found that FeS2 oxidation in subglacial environments proceeded primarily
369
under anoxic conditions (Bottrell and Tranter, 2002; Wadham et al., 2004; Wynn et al., 2006; Wadham et al., 2007). 370
However, recent studies have questioned the utility ofδ18OSO4 isotopes in distinguishing between oxic and anoxic
371
conditions. These studies (Usher et al., 2004, 2005; Chandra and Gerson, 2011) found that even in solutions containing 372
dissolved O2the vast majority of the oxygen atoms in sulfate derive from water because water outcompetes O2for
373
adsorption sites. The percentage of oxygen atoms derived from water can therefore not be used to assess whether 374
anoxic conditions are present or not during the oxidation of sulfide. 375
The bacterial sequencing data can, however, be used to gain a rough idea of the redox status of the two catchments. 376
The samples from Dryadbreen were collected in summer whilst those from Fardalen were collected in spring and 377
therefore may not be directly comparable as a result of seasonal variation in the microbial community composition 378
(Crump et al., 2009; Schostag et al., 2015). However, a study on seasonal variations in the microbial community 379
composition in soils found that the relative abundance of most phyla was constant over a year (Schostag et al., 2015). 380
In addition, Arctic stream microbial community compositions were found to be strongly correlated with inorganic 381
stream water chemistry (Crump et al., 2009) and given that there is more variation in relative ion proportions between 382
the catchments than between the seasons (Fig. 6), we assume limited seasonal variability in the microbial community 383
ACCEPTED MANUSCRIPT
Table 7: Abundance (%) of bacteria associated with Fe and S cycling. Sites A and O are from Dryadbreen and site L and M are from Fardalen.
Phylum/Class Order Genera A O L M
Reduces Fe(III)
Acidobacteria Holophagales Geothrix 1.9 0.4 0.5 7.9
Betaproteobacteria Burkholderiales Albidiferax 0.6 1.1 0.2 1.3
Betaproteobacteria Burkholderiales Rhodoferax ferrireducens 2.9 4.1 0.4 1.3
Deltaproteobacteria Desulfuromonadales Geobacter 8.1 1.8 0.0 3.9
Oxidizes Fe(II)
Betaproteobacteria Ferritrophicales Ferritrophicum radicicola 0.5 0.0 0.0 0.0 Betaproteobacteria Gallionellales Sideroxydans lithotrophicus 0.6 1.1 3.4 0.1
Betaproteobacteria Hydrogenophilales Thiobacillus 5.9 0.1 2.9 0.8
Oxidizes reduced S compounds
Betaproteobacteria Burkholderiales Thiobacter subterraneus 0.0 0.1 0.8 0.0
Betaproteobacteria Hydrogenophilales Sulfuricella 0.9 0.0 0.8 0.4
Betaproteobacteria Hydrogenophilales Thiobacillus 5.9 0.1 2.9 0.8
Gammaproteobacteria Chromatiales Halothiobacillus neapolitanus 0.0 0.0 0.5 0.0 Gammaproteobacteria Chromatiales Thioalkalivibrio versutus 0.0 0.0 0.1 0.0 Gammaproteobacteria Chromatiales Thiocapsa machilipatnamensis 0.0 0.0 0.5 0.0
Reduces sulfate
Deltaproteobacteria Desulfobacterales Desulfatiferula 0.0 0.1 0.0 0.0 Deltaproteobacteria Desulfobacterales Desulfobulbus 0.0 0.0 0.0 0.1
Deltaproteobacteria Desulfobacterales unclassified 0.1 0.4 0.0 0.4
Firmicutes Clostridiales Desulfosporosinus 0.3 0.6 0.0 5.2
Some bacteria only live in anaerobic environments and therefore their presence can be used as an indication 385
that anoxic conditions are present. In both catchments, we found evidence for both anaerobic and aerobic bacteria 386
in the under-water sites (A and L) suggesting that anoxic micro-niches exist in the aqueous system. Sequences 387
affiliated withThiobacillus, a facultative aerobe capable of oxidizing iron and sulfur compounds was represented in 388
both catchments (Table 7). It is likely thatThiobacillusis involved in the aerobic oxidation of pyrite and as a result 389
may help establish anoxic conditions. However, the Deltaproteobacteria class of bacteria, which consists of numerous 390
lithotrophic anaerobes (Kuever et al., 2005), was strongly represented in Dryadbreen (glaciated, Site A, 10.3%) but 391
was nearly absent in Fardalen (unglaciated, Site L, 0.1%) (Fig. 5), suggesting that anoxic conditions may be more 392
prevalent in the glaciated catchment and that iron reduction may be an important process. In support of this notion, 393
a number of genera capable of reducing iron compounds were identified (Table 7). For example, 8.1% and 2.9% 394
of the sequences from Dryadbreen (A) were closely affiliated withGeobacter(obligate anaerobe, Lovley, 2000) and 395
Rhodoferax(facultative anaerobe, Finneran et al., 2003) respectively (Table 7). Anoxia may be more prevalent in 396
the glaciated catchment due to the sandur, which is a large wet area covered by fine glacial flour, conditions which 397
would favour pyrite oxidation and the development of anoxia, analogous to marine sediments (e.g. Burdige, 1993). 398
Additionally, the sandur is underlain by ice (Ziaja and Pipała, 2007) which could be hydraulically linked to the 399
subglacial drainage system providing a pathway for anoxic subglacial meltwater to enter the stream downstream of 400
the apparent glacier front (Irvine-Fynn et al., 2011). In the unglaciated catchment, the aforementioned processes are 401
not relevant. Although the deeper permafrost areas will be anoxic, they may not have a strong hydraulic connection 402
ACCEPTED MANUSCRIPT
5.3. Sulfur isotope fractionation: oxidation or reduction?
404
Sulfate reduction only occurs in anaerobic environments and in low-temperature natural systems it is biologically 405
mediated (Seal II, 2006). During sulfate reduction bothδ34S andδ18OSO4 values in the remaining SO4will increase
406
as the light isotope is the preferred reactant. A positive correlation betweenδ34S andδ18OSO4 has therefore been
407
proposed as diagnostic of sulfate reduction (e.g. Mandernack et al., 2003). 408
The springδ34S values from both catchments have similarδ34S values that are within error of one of the measured 409
pyrite mineral separates suggesting that no sulfate reduction has occurred (Fig. 7). The summerδ34S values from 410
Fardalen are about 3hlighter inδ34S compared to the spring points but have the same isotopic composition as one
411
of the measured pyrite mineral separates, again suggesting the absence of sulfate reduction. The apparent shift in the 412
inferred source pyriteδ34S value could be due to differences in pyriteδ34S values between the different formations 413
(Table 5): waters in spring could predominantly drain the Frysjaodden Formation whereas waters in summer could 414
access formations higher up in the catchment (e.g. Battfjellet) as the snow pack retreats. However, the summer 415
δ34S values from Dryadbreen are heavier inδ34S compared to both measured and inferred pyrite compositions and, 416
additionally, there is also a significant positive correlation between∆18OSO4-H2Oandδ34S (R2=0.99, p<0.001, m=6±1)
417
which is suggestive of sulfate reduction (Mandernack et al., 2003; Turchyn et al., 2013).∆18OSO4-H2Ois used instead
418
ofδ18OSO4in order to remove the effect onδ18OSO4of the temporal variation inδ18OH2O. The gradient of the slope
419
betweenδ18OSO4 andδ34S is thought to give information on reaction pathways. Oxygen isotope variations during
420
reduction are thought to be controlled by a combination of intra-cellular isotope exchange between intermediate sulfur 421
compounds and ambient water (Brunner et al., 2005; Farquhar et al., 2008) and kinetic fractionation at the cell level 422
(Aharon and Fu, 2000; Mandernack et al., 2003). The balance between exchange and kinetic isotope fractionation 423
is dependent on the overall reaction rate. Thus, the exact slope ofδ18O
SO4versusδ34S depends on which microbial
424
species mediate the reaction and the forward and backward reaction rates (Aharon and Fu, 2000; Mandernack et al., 425
2003; Kleikemper et al., 2004; Turchyn et al., 2010; Wankel et al., 2014). The slope of∆18OSO4-H2Oversusδ34S from
426
Fig. 7 is 6 which would indicate a slow reaction rate (Brunner et al., 2005). 427
However, if significant sulfate reduction was occurring in Dryadbreen then appreciable amounts of sulfate reducing 428
bacteria would have been expected to be detected using molecular analysis. In the sediment sample (A), only 0.4% of 429
the bacteria were inferred to have the capacity to reduce sulfate. In addition, attempts to amplify the gene encoding a 430
fragment of the alpha and beta subunit of the bisulphate reductase (dsrAB, a biomarker for sulfate reduction, Wagner 431
et al., 1998) were not successful in any of the four sediment samples despite 40 cycles of PCR (data not shown). This 432
supports the notion that the observed sulfur isotope fractionation was not due to sulfate reduction. 433
It is generally assumed that negligible sulfur isotope fractionation occurs during pyrite oxidation, however frac-434
tionation can occur under certain conditions. Several biotic and abiotic experiments under anoxic and oxic conditions 435
have observedεS O4−pyritewith values between -1.3 and+3.5h(Balci et al., 2007; Pisapia et al., 2007; Brunner et al., 436
2008). The difference between pyrite and sulfate in the Dryadbreen summer samples is∆34SS O
4−sul f ide = +2.2 to 437
ACCEPTED MANUSCRIPT
= +3.5 and+0.4) have previously been reported for the initial, non-stoichiometric stages of pyrite oxidation (Pisapia 439
et al., 2007; Brunner et al., 2008). Non-stoichiometric reactions are expected to occur in areas of significant physical 440
erosion e.g. glaciated catchments, as material is removed before reactions are completed (kinetic limitation, Stallard 441
and Edmond, 1983). Positive values ofεS O4−sul f idehave been attributed to heightened loss of SO2in the early stages
442
of the reaction and the breaking of thiosulfate S-S covalent bonds (Pisapia et al., 2007; Brunner et al., 2008). De-443
gassing of SO2is likely under acidic conditions, but the pH of this river is around 6.5 (Table 1), suggesting that this
444
mechanism of fractionation is likely to be minor. Similarly, the fractionation of O isotopes in sulfate can occur when 445
sulfite species are present, allowing oxygen isotope exchange with water, enriching sulfite, and ultimately sulfate, 446
with18O (Brunner et al., 2008). The∆18O
S O4−watervalues from Dryadbreen summer samples (+3.0 to+5.4h) are 447
in agreement withε18OS O4−waterdata from pyrite oxidation experiments (+2.8 to+16h, Balci et al., 2007; Pisapia 448
et al., 2007; Brunner et al., 2008). In conclusion, sulfate enriched in both34S and18O, as observed in Dryadbreen,
449
does not necessarily imply sulfate reduction and can be adequately explained as a result of non-stoichiometric reaction 450
pathways during the oxidation of pyrite. 451
In Dryadbreen (site A) 21.7% of the bacteria (collected in summer) are inferred to be involved in Fe and S cycling 452
reactions and 13.5% are inferred to have the ability to reduce Fe(III) e.g. Geobacter and Rhodoferax (Table 7). 453
Given that pyrite is likely the main source of iron in the system, the obligate anaerobic nature ofGeobacter and 454
the facultative anaerobic nature ofRhodoferax, are suggestive of the presence and potential importance of anoxic 455
portions of the catchment where the ‘anoxic’ pyrite oxidation pathway may occur (Eqn 4b, note that this pathway can 456
also occur where oxygen is present e.g. Balci et al. (2007)). The pH of the water is circumneutral, likely due to the 457
buffering capacity of calcite dissolution, and at this pH Fe can be cyclically oxidised and reduced (Moses and Herman, 458
1991) accounting for the presence of bacteria associated with both Fe reduction and Fe oxidation. It is also possible 459
for other compounds to act as the electron acceptor in pyrite reduction such as NO3and MnO2, and it is likely that all
460
will be involved in pyrite oxidation to some extent if they are available in the system (e.g. Burdige and Nealson, 1986; 461
Jørgensen et al., 2009). Indeed, an abundant component of the microbial community identified at Site A (Dryadbreen) 462
is Thiobacillus(Table 7) which can couple FeS2 oxidation with NO3− reduction (Bosch et al., 2012). Therefore,
463
the presence of the above-mentioned bacteria indicates that the non-stoichiometric reaction pathway, identified as 464
being responsible for the observed change inδ34S andδ18OSO4 values, most likely occurs under anoxic conditions
465
and involves the reduction of Fe. In Fardalen (site L) the bacteria involved in Fe and S cycling are associated with 466
oxidation of Fe and reduced S compounds, with a much lower fraction (∼1%) inferred to be involved in Fe reduction. 467
This corroborates the inference of pyrite oxidation under oxic conditions and isotopic fractionation of S and O in 468