Enzymatic pretreatment and microwave extraction of
asiaticoside from Centella asiatica
Cheng-Xiao Wang, Wei Han*, Liang Fan, Chun-Li Wang
Engineering Center for Traditional Chinese Medicine Modernization, East China University of Science and Technology, Shanghai, China.
E-mail: *whan@ecust.edu.cn
Received 3 July 2009; revised 13 July 2009; accepted 19 July 2009.
ABSTRACT
The extraction of asiaticoside from Centella asiatica by enzymatic pretreatment and microwave extraction (EPME) was studied in this article. The effects of several important factors such as temperature of en-zymatic pretreatment, liquid to solid ratio and mi-crowave radiation time were investigated by quadric regression orthogonal design experiment and were analyzed by response surface. An extraction model with well forecast performance was then established. The results indicate that the optimum extraction condition was as follows: liquid to solid ratio was 36mL/g, temperature of enzymatic pretreatment was 45℃, enzymatic time was 30min, and microwave ra-diation time was 110s. On such conditions the yield was 27.10%.
Keywords: Asiaticoside; Enzymolysis; Microwave Ex-traction; Centella Asiatica
1. INTRODUCTION
Centella asiatica (L.) Urban, a perennial herb belonging to the umbelliferae family, is well known as a traditional Chinese herbal medicine. Its conventional efficacy is clearing away heat and toxic, inducing diuresis and re-ducing edema. The major active constituents of Centella asiatica are asiaticoside and madecassoside. It has been used for the treatment of hot and humid jaundice, trau-matic injuries, infectious hepatitis and dermatosis [1]. Currently, some conventional extraction methods are mostly adopted for the extraction of asiaticoside [2,3,4], such as aqueous extraction and ethanol extraction.
In recent years, new kinds of extraction techniques appeared, including enzymolysis and microwave extrac-tion. The former has impressive effects with characteris-tics of high catalytic efficiency, high specificity, mild reactive conditions and preserving the original efficacy of active compounds to the maximum [5]. The later
method has many advantages, such as shorter time, less solvent, higher extraction rate and better products with lower cost [6,7]. However, the application of the combi-nation of these two methods on plant materials was rare- ly reported.
For the purpose of improving the efficient of asiatico-side extraction, reducing the cost, the EPME method is employed in this article, quadric regression orthogonal design is adopted to investigate the effects of three main extraction parameters including temperature of enzyma- tic pretreatment, liquid to solid ratio and microwave ra-diation time on the yield of asiaticoside, and optimum extraction process is worked out.
2. MATERIALS AND METHODS
2.1. Equipments and Reagents
An ER-692 microwave oven (as shown in Figure 1)
with a power output of 650W, operating at 2450MHz, was mechanically modified to fit a reflux system that enables extraction performed under atmospheric settings and permits solvent containment. The extraction vessel was a 250-mL three-necked round-bottomed flask con-nected to a water condenser.
Thermostat with magnetic stirrer (Model DF-101S, Yuhua Experimental Apparatus Co., Shanghai) was used as enzymolysis device. UV spectrophotometer (Model 1900PC, Yayan Electronic Co., Shanghai) was used for determination.
Dry Centella asiatica (fitted for the Chinese Pharma-copoeia); Asiaticoside standard (Provided by National Institute for the Control of Pharmaceutical and Biologi-cal Products, Beijing); Cellulase (≥400U/mg); Anhy-drous ethanol and concentrated sulfuric acid used in the experiment were all of analytical grade.
2.2. Analytic Method of Asiaticoside
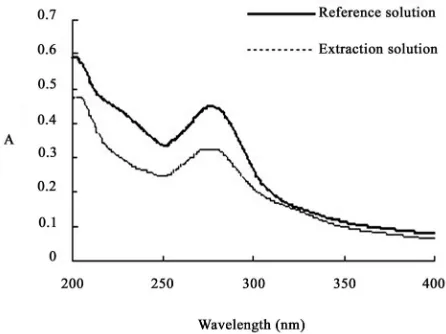
extrac-tion quantity (g asiaticoside/g Centella asiatica). The asiaticoside standard sample solution (was diluted by anhydrous ethanol) and extraction solution were scan ed at 200-400nm respectively, there were the same ab-sorption peak at 277nm (Figure 2), which was close to the literature values [9]. So 277nm was chosen for the UV wavelengths.
The asiaticoside standard sample solution (concentra-tion: 92µg/mL) was precisely measured at 0.0, 0.5, 1.0, 1.5, 2.0, 2.5mL, and put into a 10mL volumetric flask. Firstly, volatilized out the solvent ethanol in the boiling water bath, and then added the 2mL concentrated sulfu-ric acid (H2SO4) after the flask cooling to the ambient
temperature, heated for 30min in 80℃ water bath. Fi-nally, added anhydrous ethanol to the scale after the flask getting to the ambient temperature. According to the ultraviolet spectrophotometry, the prepared solution was measured at 277nm. Regression equation and corre-lation coefficient were y=43.40x-2.49 and r=0.9992 (n=7) respectively. The linear range was 4.6~23.0µg/mL.
The 0.5mL test sample solution was accurately meas-ured and placed into a 10mL volumetric flask, following the preparation method of regression equation. The ab-sorbance of test sample was determined, and the yield of asiaticoside in the test sample was calculated in accor-dance with the following equation:
Yield of asiaticoside (%, w/w)=
%
100
10
3
)
49
.
2
40
.
43
(
6
Vn
A
(1)
where, A, the absorbance of asiaticoside in test sample; V, volume of solvent, mL; n, diluted times.
[image:2.595.312.535.79.246.2]Figure 1.Microwave equipment diagram; 1-Water condenser; 2-Air condenser; 3-Copper tube; 4-Tailored tube; 5-Air agitator; 6-Status display; 7-Microwave oven timer; 8-Microwave oven; 9-Flask; 10-Base of flask.
Figure 2. UV spectra of reference solution and extraction solution.
2.3. Enzymatic Pretreatment and Microwave
Extraction
The dry Centella asiatica (sieved through 10 screen me- sh) 3.0g was accurately weighed and placed into a three- neck flask with 3% cellulase solution (dissolved by de-ionized water), then the dede-ionized water as solvent was added in according to a certain ratio (mL/g) of material to solvent volume, and the mass of system was weighed.
Three-neck flask was put into the thermostat with magnetic stirrer, setting enzymolysis time at 30min ac-cording to the pre-experiment, while the temperature of enzymatic reaction and stirring speed were set at certain values. Then the flask was taken out and placed into the microwave oven immediately. The radiation exposure was 30s for preventing the serious evaporation of solvent. At the end of each exposure, the system was brought back to ambient temperature during 2~3 min interval by cooling it with a water bath. An extraction cycle was defined as the combination of phases of radiation and phases without radiation in which the solvent cooled. The sum of radiation exposure of processing extraction cycles served as the overall intensity of microwave ra-diation. The extraction solution was agitated with an air pump to promote heat uniformity while exposing to mi-crowave radiation. After the radiation, the flask was tak- en out to weigh the total mass again, and the lost weight was supplemented. The extract was filtered through 0.45µm millipore filter, and then abandoned the initial filtrate, added 0.5mL subsequent filtrate to a 10mL volu- metric flask with anhydrous ethanol as the test sample.
3. RESULTS AND DISCUSSIONS
3.1. Effect of Temperature of Enzymatic
Pretreatment on EPME
[image:2.595.61.282.490.664.2]at 45℃. Because the temperature of enzymatic pretreat-ment was a significant factor in the process of enzymo-lysis, it affected the enzyme activity as well as the rates of enzyme-catalyzed reactions. When the temperature was lower than 45℃, the increase of temperature can improve the cellulase activity, accelerate the degradation of cytoderm. While the temperature of enzymatic pre-treatment was higher than 45℃, the cellulase activity was decreased, leading to the reduction of the yield. Therefore the temperature of enzymatic pretreatment for 45℃ was used.
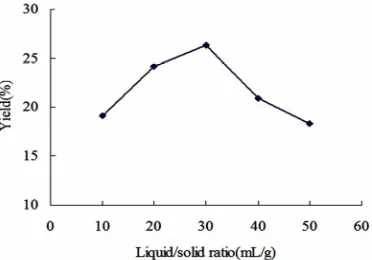
3.2. Effect of Liquid to Solid Ratio on EPME
As it is known, the liquid to solid ratio is very important in the extraction. From the perspective of mass transfer, it mainly affects the concentration gradient between liq-uid phase and solid phase. Figure 4 shows that the yield of asiaticoside was increased with the increase of liquid to solid ratio. After the peak, the yield of asiaticoside was decreased with the increase of liquid to solid ratio. The higher liquid to solid ratio, the longer time for the solution elevated to the same temperature was required. At the same microwave radiation, the temperature of the system with larger amount of solvent was relatively lower; the solute diffusion would be affected. So the ratio for 30mL/g was chosen.
3.3. Effect of Microwave Radiation Time on
[image:3.595.332.518.81.211.2]EPME
Figure 5 described that the extraction yield sharply in-creased before 60s and was asymptotic to a steady value during 60~120s, then falls down after 120s. At the pre-liminary stage of extraction, the velocity of molecular thermal motion quickened and the asiaticoside was qui- ckly separated from the cell into solution. The extraction process had tended towards equilibrium since 60s. When
Figure 3.Effect of temperature of enzymatic pretreatment on EPME.
[image:3.595.334.517.242.381.2]Figure 4. Effect of liquid to solid ratio on EPME.
Figure 5. Effect of microwave radiation time on EPME.
the microwave radiation time exceeded 120s, the system was hyperthermal, the vaporization reflux of solution increased. All of above brought about the reduction of effective contact interval of solvent and plants, and caused the decrease of the thermal effects. In addition, the extension of microwave radiation time would in-crease the consumption of energy. Thus the microwave radiation time for 60s was used in the experiment.
3.4. Quadratic Regression Orthogonal Design Results
The quadratic regression orthogonal design was employ- ed to evaluate the relevance of the three main extraction factors including enzymatic temperature, liquid to solid ratio and the microwave radiation time, while other fac-tors including grinding degree of plant material, concen-tration of enzyme, enzymatic pretreatment time and pH of the solvent were constant according to the pre-expe- riments. The multivariate study allows the identification of interactions between variables and provides a com-plex exploration of the experimental domain to be stud-ied with a number of experiments optimized.
[image:3.595.60.283.538.700.2]Table 1.Factors of orthogonal experiment.
X1-Microwave X2-Liquid to X3-Enzymatic
-γ 9 13 28
-1 30 20 35
0 60 30 45
1 90 40 55
γ 111 47 62
Δ 30 10 10
The statistical analysis software was applied in this experiment to establish a regression Eq.2, in this equa-tion, the terms of Y, X1, X2, and X3 respectively
repre-sent the yield of asiaticoside, microwave radiation time, liquid to solid ratio and enzymatic temperature:
Y=25.8963+1.8150X1-0.7646X2+0.3464X3
+0.9363X1X2+0.4688X1X3+0.1363X2X3 (2)
-0.7065X12-0.6852X22-1.7547X32
Analysis of variance was carried out in order to test the signification of the regression model. Thus, various statistical data such as sum of squares (SS), mean sq- uares (MS), F-ratio were given in Table 2.
The F-ratio in Table 2 was the ratio of the meansq- uared error to the pure error obtained from the replicates at the design center. The significance of the F-ratio de-pends on the number of degrees of freedom (d. f.) in the model. Thus, the effects lower than 0.05 in this column were significant.
As shown in Table 2, FRegression=10.866>F0.05 (9,
8)=3.388, the regression of (2) was significant, while FLack of fit=3.478<F0.05 (5, 8) =3.687, the lack of fit was
non-significant. Therefore, (2) had well predictivity un-der the experimental condition. In the test of regression coefficient, F-ratio for terms X3, X1X3, X2X3 (1.253,
1.344, 0.114) were lower than F0.05 (1, 8) =5.318, so
these terms were not significant. On the contrary, the F-ratio for other terms (X1, X2, X1X2, X12, X22 and X32)
which were higher than F0.05, indicated the significance
of these terms. As the orthogonality of this experiment, the insignificant terms were cut out to simplify the (3):
Y=25.8963+1.8150X1-0.7646X2+0.9363X1X2
[image:4.595.58.285.586.721.2]-0.7065X12-0.6852X22-1.7547X32 (3)
Table 2. Variance analysis of test results.
Source d.f. SS MS F F0.05
X1 1 44.995 44.995 34.409 5.318
X2 1 7.985 7.985 6.106
X3 1 1.639 1.639 1.253
X1X2 1 7.012 7.012 5.363
X1X3 1 1.758 1.758 1.344
X2X3 1 0.148 0.148 0.114
X12 1 7.935 7.935 6.068
X22 1 7.463 7.463 5.707
X32 1 48.949 48.949 37.432
Regression 9 127.885 14.209 10.866 3.388 Lack of fit 5 22.740 4.548 3.478 3.687 Pure error 8 10.461 1.308
Total 22 161.087 7.322
Eq.3 indicated that the microwave radiation time and liquid to solid ratio were the main factors that influence the yield because of the significance of the terms X1 and
X2 .The significance of X1X2 suggested the obvious
in-teraction between microwave radiation time and liquid to solid ratio. And the significance of all the quadratic terms demonstrated the nonlinear relationship between the three factors and the yield of extraction.
3.5. Analysis of Response Surface
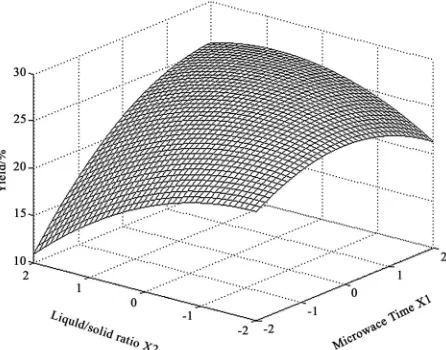
The 3D surface curves were drawn to illustrate the main and interactive effects of the three factors on the yield. The response surfaces are shown in Figures 6,7,8 with one variable kept at optimum level and the other two varied within the experimental range.
Figure 6 shows the effect of liquid to solid ratio(X2) and extraction time(X1) on the yield. A quadratic effect for both factors on the response can be observed. At a low level of X2 (-2), the system was readily hyperther-mal and vaporization of the solvent could reduced the yield with the increasing of microwave time. And at a high level of X2 (2), the yield displayed an increasing curve in the experimental range of X1. It is due to the distinctly interaction between X1 and X2, which was implied in the Eq.3. The maximum yield was predicted when X1 was in the range of 1.5 to 1.7 and X2 varied from 0.4 to 0.6.
Figure 7 depicts the effect of enzymatic tempera-ture(X3) and extraction time(X1),as both them exerting a quadratic effect. As shown in the Figure 7, an increase in yield resulted when X3 was increased in the level range from –2 to 0, then the curve started to go down, which may indicate that a level of X1 at approximate 0 is required to achieve maximum yield. Likewise, an in-crease in yield resulted when X1 was inin-creased in the code range from –2 to 1.5, and then the yield was slightly reduced. In the response surface, X1 exerted a more significant effect on yield than X3, and no obvious interaction between X1 and X3 was observed, which was well in agreement with Eq.3.
In Figure8, yield showed quadratic curve depending upon the liquid to solid ratio(X2), whereas no significant effect was observed in the enzymatic temperature(X3). Because the ratio was a key factor which influences the impetus in mass transfer of both enzymatic pretreatment and microwave extraction processes, it exerted a more significant effect on yield than the factor of enzymatic temperature. According to the response surface, there was no obviously interaction between X2 and X3, and it was also supported by the Eq.3.
3.6. Optimization of EPME Condition
Figure 6. Response surface graph of microwave radiation time and liquid/solid ratio.
[image:5.595.311.537.96.186.2]Figure 7.Response surface graph of microwave radiation time and enzymatic temperature.
Figure 8. Response surface graph of liquid/solid ratio and enzymatic temperature.
Table 3. Optimum values and verification results
Yield/% Coded
Value
Calculated
Value mated
Esti-Value
Measured Value
X1(s) 1.672 110
X2(mL/g) 0.584 36
X3(℃) 0 45
27.19 27.10
to (3), model was then built up as described hereinafter [10]:
Objective function: Y(X1,X2,X3);
Constraint conditions: –1.682≤Xi≤1.682; (i=1,2,3)
The optimum parameters and maximal yield were worked out by Newton’s iteration method. The results were shown in Table 3. To compare the predicted result (82.10%) with the practical value, the rechecking ex-periment was performed using this deduced optimal condition. The mean value of 27.10% (n=3), obtained from real experiments, demonstrated the validity of the model, since there was no significant differences tween 27.19% and 27.10%. The strong correlation be-tween the real and the predicted results confirmed that the extraction model was adequate to reflect the ex-pected optimization.
4. CONCLUSIONS
The quadratic regression orthogonal design was used in this research, an extraction model which can accurately predict the yield of asiaticoside extraction under the ex-perimental condition was established.
Through the analysis of experiment data, it can be found that the microwave radiation time and liquid to solid ratio significantly influence the yield of the extrac-tion. Especially, there was an obvious interaction be- tween the microwave radiation time and liquid to solid ratio.
The optimum combination of the parameters for the extraction of asiaticoside was obtained by the mathema- tical methology; it was microwave radiation time for 110s; liquid to solid ratio for 36mL/g, and enzymatic pretreatment temperature for 45℃. On this condition, the maximum yield of extraction was 27.10%, closed to the estimated value 27.19%.
The EPME procedure had the advantages of less time, high efficiency of extraction, and environmentally frie- ndly. It can be applied to other extraction of plant mate-rials. But the expansive cost of the enzyme and difficulty in industrialization of microwave extraction would limit the further application of EPME.
5. ACKNOWLEDGMENTS
[image:5.595.59.285.297.475.2] [image:5.595.59.281.512.691.2]REFERENCES
[6] Bayramoglu, B., Sahin, S., and Sumnu, G., (2008) Sol-ventfree microwave extraction of essential oil from oregano, J. Food Eng., 88, 535−540.[1] Randriamampionona, D., Diallo, B., and Rakotoniriana, F., (2007) Comparative analysis of active constituents in Centella asiatica samples from Madagascar: Application for ex situ conservation and clonal propagation, Fitotera- pia, 78, 482–489.
[7] Proestos, C. and Komaitis, M., (2008) Application of microwave-assisted extraction to the fast extraction of plant phenolic compounds, Food Sci. Technol-LEB, 41, 652−659.
[2] Verma, K., Bhartariya, G., and Gupta, M., (1999) Rever-sephase high performance liquid chromatography of asi-aticoside in Centella asiatica, Phytochem. Anal., 10, 191–193.
[8] Pan, X. J., Niu, G. G., and Liu, H. Z., (2003) Micro-wave-assisted extraction of tea polyphenols and tea caf-feine from green tea leaves, Chem. Eng. Process, 42, 129− 133.
[3] Sarma, K., Khosa, L., and Chansauria, N., (1995) An-tistress activity of Tinospora cordfolia and Centella asi-atica extracts, Phytother. Res., 10, 181−183.
[9] Lu, X. Y., “Determination of asiaticosides by UV- spec-trophotography. (2005) J Modern Food Drug, 16, 15−16. [10] Ma, S. F., Wang, L. Q., and Hu, Z. C., (2005) Enzymatic
extraction of the submerged mycelium polysaccharide from Pleurotus nebrodensis, T CSAE, 22, 198−201. [4] Flora, S. and Gupta, R., (2007) Beneficial effects of
Cen-tella asiatica aqueous extract against arsenic-induced oxidative stress and essential metal status in rats,
Phyto-ther. Res., 21, 980−988. [11] Virot, M., Tomao, V., and Colnagui, G., (2007) New mi-crowave-integrated Soxhlet extraction an advantageous tool for the extraction of lipids from food products, J. Chromatogr. A, 1174, 138−144.