DOI:10.1051/0004-6361/201423939 c
ESO 2014
Astrophysics
&
Revisiting the transits of CoRoT-7b at a lower activity level
S. C. C. Barros
1, J. M. Almenara
1, M. Deleuil
1, R. F. Diaz
1,2, Sz. Csizmadia
3, J. Cabrera
3, S. Chaintreuil
4, A. Collier
Cameron
5, A. Hatzes
6, R. Haywood
5, A. F. Lanza
7, S. Aigrain
8, R. Alonso
10,11, P. Bordé
9, F. Bouchy
1, H. J. Deeg
10,11,
A. Erikson
3, M. Fridlund
3, S. Grziwa
12, D. Gandolfi
7, T. Guillot
13, E. Guenther
6, A. Leger
9, C. Moutou
1,14,
M. Ollivier
9, T. Pasternacki
3, M. Pätzold
12, H. Rauer
3,15, D. Rouan
4, A. Santerne
16, J. Schneider
17, and G. Wuchterl
61 Aix-Marseille Université, CNRS, LAM (Laboratoire d’Astrophysique de Marseille) UMR 7326, 13388 Marseille, France e-mail:susana.barros@lam.fr
2 Observatoire Astronomique de l’Université de Genève, 51 chemin des Maillettes, 1290 Versoix, Switzerland 3 Institute of Planetary Research, German Aerospace Center, Rutherfordstrasse 2, 12489 Berlin, Germany
4 LESIA, UMR 8109 CNRS, Observatoire de Paris, UVSQ, Université Paris-Diderot, 5 place J. Janssen, 92195 Meudon Cedex, France
5 SUPA, School of Physics and Astronomy, University of St Andrews, St Andrews KY16 9SS, UK 6 Thuringer Landessternwarte, 07778 Tautenburg, Germany
7 INAF-Osservatorio Astrofisico di Catania, via S. Sofia, 78, 95123 Catania, Italy
8 Department of Physics, University of Oxford, Denys Wilkinson Building, Keble Road, Oxford OX1 3RH, UK 9 Institut d’Astrophysique Spatiale, Université Paris-Sud & CNRS, 91405 Orsay, France
10 Instituto de Astrofísica de Canarias (IAC), 38200 La Laguna, Tenerife, Spain
11 Dept. Astrofísica, Universidad de La Laguna (ULL), 38206 La Laguna, Tenerife, Spain
12 Rheinisches Institut für Umweltforschung an der Universität zu Köln, Aachener Strasse 209, 50931 Köln, Germany 13 Observatoire de la Côte d’Azur, Laboratoire Cassiopée, BP 4229, 06304 Nice Cedex 4, France
14 CNRS, Canada-France-Hawaii Telescope Corporation, 65-1238 Mamalahoa Hwy., Kamuela, HI 96743, USA 15 Center for Astronomy and Astrophysics, TU Berlin, Hardenbergstr. 36, 10623 Berlin, Germany
16 Centro de Astrofísica, Universidade do Porto, Rua das Estrelas, 4150-762 Porto, Portugal
17 LUTH, Observatoire de Paris, CNRS, Université Paris Diderot; 5 place Jules Janssen, 92195 Meudon, France
Received 3 April 2014/Accepted 30 July 2014
ABSTRACT
The first super-Earth with measured radius discovered was CoRoT-7b and it has opened the new field of rocky exoplanet character-isation. To better understand this interesting system, new observations were taken with the CoRoT satellite. During this run 90 new transits were obtained in the imagette mode. These were analysed together with the previous 151 transits obtained in the discovery run and HARPS radial velocity observations to derive accurate system parameters. A difference is found in the posterior probability distribution of the transit parameters between the previous CoRoT run (LRa01) and the new run (LRa06). We propose that this is due to an extra noise component in the previous CoRoT run suspected of being transit spot occultation events. These lead to the mean transit shape becoming V-shaped. We show that the extra noise component is dominant at low stellar flux levels and reject these tran-sits in the final analysis. We obtained a planetary radius,Rp =1.585±0.064 R⊕, in agreement with previous estimates. Combining
the planetary radius with the new mass estimates results in a planetary density of 1.19±0.27ρ⊕which is consistent with a rocky composition. The CoRoT-7 system remains an excellent test bed for the effects of activity in the derivation of planetary parameters in the shallow transit regime.
Key words.stars: individual: CoRoT -7b – planetary systems – stars: activity – techniques: photometric – methods: observational
1. Introduction
Léger et al. (2009) anounced the discovery of CoRoT-7b, the first transiting super-Earth and one of the most interest-ing planets detected by the Convection Rotation and planetary Transits (CoRoT) space telescope. This planet was detected in the LRa01 run of CoRoT from 24 October 2007 to 3 March 2008. The planet orbits a G9V type star every ∼0.85 days (Léger et al. 2009). The host star was found to be young (1.2–2.3 Gyr) and active showing a 2% amplitude variability in the CoRoT light curve. The stellar activity severely affected the radial velocity (RV) follow-up observations needed to con-firm the planet and to derive its mass (Queloz et al. 2009). During the RV observations the semi-amplitude of activity-induced RV variability was 20 m/s and hence, higher than the planet signature ∼1.6−5.7 m/s. Several methods were devel-oped to correct the activity-induced RV variability. However,
the measured RV planet signature was found to be method dependent with estimates of the mass of CoRoT-7b ranging from 2.260M⊕ to 8.0M⊕ (Queloz et al. 2009; Hatzes et al. 2010,2011;Boisse et al. 2011;Pont et al. 2011;Ferraz-Mello et al. 2011). Nevertheless, 90% are consistent with a mass 6.2± 1.2 M⊕. Interestingly, two additional planetary signatures were seen in the RVs, one with a period of 3.69 days and a mass of 8.4±0.9 M⊕ (Queloz et al. 2009) and a second companion with period 9.0 days and mass of 16.7M⊕(Hatzes et al. 2010).
It was suspected that the stellar activity also affected the derived transit parameters of CoRoT-7b (Léger et al. 2009). The stellar density derived from transit fitting was found to be much lower (ρ∗=0.12ρ) than the derived spectroscopic value (ρ∗ = 1.4ρ). However, the authors noted that when subsets of 4–5 transits were fitted separately, the resulting stellar density was in agreement with the expected value for a G9V type star. Therefore, they concluded that adding all the transits together
degraded the transit shape and they suggested two possible causes. The first was transit timing variations due to hypothet-ical additional planets in the system and the second was stellar variability. To avoid the underestimation of the stellar density, the spectroscopic derived radius was used as a prior in their tran-sit fitting. Later, an in-depth spectroscopic study of the host star improved the stellar radius and consequently the planetary radius which was found to be 1.58±0.10 R⊕(Bruntt et al. 2010).
In this paper we test the effect of stellar activity in the tran-sit observation of CoRoT-7b. Stellar activity can affect the tran-sit light curves in two different ways (Czesla et al. 2009). Dark spots or bright faculae outside the transit chord (projected path of the planet in the stellar surface) alter the out-of-transit stel-lar flux and can also introduce trends in the normalisation. Spots or faculae inside the transit chord (planet-spot occultations) will affect the transit shape. Both effects will influence the parameter estimation.
The out-of-transit stellar variability of CoRoT-7b during the LRa01 CoRoT observations was modelled byLanza et al.(2010) who found that the photometric variability is dominated by cool spots with reduced facular contribution in comparison to the sun. This was also confirmed by ground-based colour-photometry ac-quired in Dec. 2008 to Feb. 2009 (Queloz et al. 2009). Moreover, Lanza et al. (2010) found that in CoRoT-7 there were three main active longitudes with rotation periods ranging from 23.6 to 27.6 days, which were attributed to differential stellar rota-tion. These active longitudes could persist for several years as suggested by the phase coherence of the light modulation be-tween LRa01 CoRoT light curve and the light curve ofQueloz et al.(2009). The mean lifetime of individual active regions is about 18 days and they cover a maximum of 1.6% area of the stellar surface. Furthermore, an analysis of the spot model resid-uals lead Lanza et al. (2010) to propose that there is a pop-ulation of small active regions with lifetime of 4–5 days that cover∼0.1 percent of the stellar surface.
Planet-spot occultations were first observed in the transit of HD 209459b byDeeg et al.(2001);Silva(2003). For example in CoRoT-2b (Alonso et al. 2008), the analysis of the evolution of the spots through several transits allowed probing the stellar surface and deriving spot properties (Lanza et al. 2009;Wolter et al. 2009;Silva-Valio et al. 2010;Silva-Valio & Lanza 2011). However, in ground based observations where only a few transits are observed, the effects of spots can be difficult to recognise and to correct (Barros et al. 2013).
To better understand and characterise this iconic system CoRoT-7 was re-observed with the CoRoT satellite for addi-tional 80 days, from the 10th of January 2012 to the 29th of March 2012. Furthermore, simultaneous RV observations were taken with HARPS in the first 26 consecutive nights of the CoRoT observation. In this paper we present the results of the analysis of the new CoRoT photometric observations. These new data allowed a better understanding of the effect of stellar ac-tivity in shallow transits and updating the system parameters. Although the RV analysis will be presented elsewhere (Haywood et al. 2014; Hatzes, et al., in prep.), the full HARPS RV set is in-cluded in our analysis in order to obtain consistent parameters. We begin by presenting the data reduction procedure in Sect. 2 where we also describe the CoRoT imagette pipeline. In Sect. 3 we present our transit fitting model and show our results for the new LRa06 data in Sect. 4. In Sect. 5 we compare the two CoRoT observations, LRa01 and LRa06. The tests performed to LRa01 to investigate the distortion of the parameter posterior distributions that lead to rejecting some transits are explained in
Sect. 6. The final results presented in Sect. 7 are discussed in Sect. 8. Finally the conclusions are given in Sect. 9.
2. Data reduction
The CoRoT satellite has two science channels for its two science goals: asteroseismology and exoplanet search. In the exoplanet channel 6000−12 000 target stars are monitored in each run and because of limitations on telemetry, data reduction is performed on board and only the light curves are transmitted to the ground. However, for 40 targets per channel, a window of 15×10 pix-els is transmitted to the ground. These are called imagettes and are used for special targets or for the bright stars in the field. While there are two sampling rates in the light curve mode: 512 s and 32 s, in the imagette mode the sampling rate is al-ways 32 s. The imagette mode has several advantages compared to the light curve mode and hence, the CoRoT-7 re-observation was performed in the imagette mode. In LRa01 CoRoT-7 was observed in the light curve mode with a sampling rate of 32 s. A full description of the CoRoT satellite can be found inAuvergne et al.(2009).
2.1. Imagette pipeline
The imagette pipeline is composed of two parts. The first is related to image calibration and consists of three main cor-rections: the bias correction, the cross talk effect1 correction, and the background correction. To estimate the latter, there are 196 background windows spread over the CCD each con-sisting of 10×10 pixels. In the beginning of the mission, the background was evaluated to be very uniform over the CCD and therefore the median of the background windows was used for the correction. However, recently it was found that because of the ageing of the CCD the background is no longer uniform and depends on the position along the reading direction of the CCD (y-direction). This is mainly due to an increase in the dark current and a decrease of the transfer efficiency (Chaintreuil et al., in prep.). Consequently, a correction which depends on the y-position of the target in the CCD was added to the median in the estimation of the background. This correction was included for both observations of CoRoT-7 presented here.
In the second part of the pipeline, the extraction of the light curve from the image time series is performed using aperture photometry. The procedure starts by com puting the aperture that maximises the signal-to-noise in the mean image. Subsequently the centroid of each image is computed. The centroid position is used to centre the images before extracting the flux inside the optimum aperture. Since there is a prism in the exoplanet chan-nel in front of the CCD that produces a low resolution spectrum, colour information can also be extracted. The imagette pipeline provides three colour light curves for the red, green, and blue parts of the spectrum; however, these colours do not correspond to the standard photometric filters. The number of columns in the dispersion direction used for each colour is calculated so that the red flux is 40±12%, the blue flux is 30±8% of the total flux and there is at least one column for the green (Rouan et al. 1999). An important part of the pipeline is the flagging of the bad data points mainly due to passage through the south Atlantic anomaly (SAA), cosmic ray events and hot pixels.
Recently, the computation of the barycentre was also in-cluded in the imagette pipeline. The barycentre is computed
0
1000
2000
3000
4000
5000
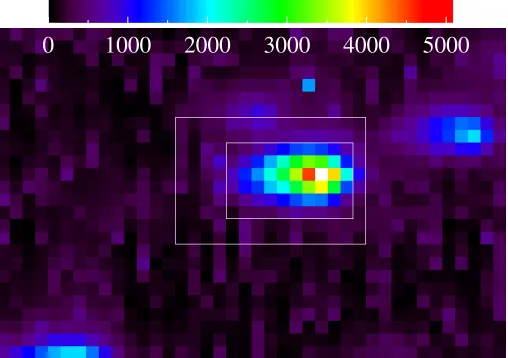
Fig. 1.Field of the CoRoT CCD around CoRoT-7. The bigger rectangle shows the imagette position while the smaller rectangle is the optimum aperture used to obtain the final light curve. The images are shown in a square root scale of the flux so that the contaminant in the top left of CoRoT-7 becomes visible.
by subtracting the mean position of the stars in the field (CoRoT line of sight) from the position of the centre of light of the target star. The barycentre is very sensitive to the existence of contaminant stars inside the aperture (Barros et al. 2007) which can be used to discard false positives as it is done for theKepler candidates (e.g.Borucki et al. 2011).
2.2. Customised data reduction
During the CoRoT run LRa06 which started on the 10th of January 2012 and was finished on the 29th of March 2012, CoRoT-7 was re-observed in the imagette mode. The most ob-vious advantage of the imagette mode is that the data reduction can be optimised and customised for a particular target. In Fig.1, we present an image of the field of view around CoRoT-7 where we show the position of the imagette (larger rectangle) on the CoRoT CCD.
To improve the data reduction, we started by optimising the target aperture in order to minimise the rms of the final light curve on timescales shorter than 30 min. Variability on timescales longer than 30 min is dominated by intrinsic stellar variability while variability on shorter timescales is dominated by instrumental and reduction noise. From our signal-to-noise optimisation procedure, we realised that because of jitter noise and the elongated PSF shape, rectangular shapes were preferred and pixels in the border of the imagette should be avoided. The optimum aperture found is the smaller rectangle of 10×6 pixels shown in Fig.1. The contaminant seen on the top border of the imagette was deliberately excluded from the aperture, resulting in a zero estimated contamination inside the final aperture. The final step of the data reduction was the removal of the light curve outliers that deviate from the local mean by more than 5σ.
The customisation of the data reduction led to a 50% de-crease of the light curve’s rms relative to the automatic pipeline. The final light curve after sigma clipping is shown Fig.2. It has a mean rms of 1300 ppm per point, i.e.∼1.3×the expected pho-ton noise. The rms is higher than in the previous run probably because of the ageing of the CCD which resulted in an increas-ing of the dark current and a decreasincreas-ing of the charge transfer efficiency. To reach the photon noise level, as in this case, it is
4400 4420 4440 4460 4480 4500 4520 JD−2 450 000
0.990 0.995 1.000 1.005
Normalised Flux
5940 5960 5980 6000
JD−2 450 000 0.990
0.995 1.000 1.005
Normalised Flux
Fig. 2.Light curve of CoRoT-7b binned to 30 min for clarity during LRa01 (top) and LRa06 (bottom). It is evident that the variability level during LRa01 is twice that in the LRa06 CoRoT light curve.
very important to reduce sources of systematic effects for ex-ample due to movement of the target across the CCD (Barros et al. 2011b). The guiding of the CoRoT satellite is based on bright stars in the seismology field and is very accurate, result-ing in a very stable stellar centroid. For example, the centroid of CoRoT-7 varied by 0.2 pixels in thex-direction (dispersion di-rection) and 0.09 pixels in they-direction during the 80 days of the run.
We included in our transit analysis procedure the previous transits of CoRoT-7b obtained in the LRa01 run and presented byLéger et al.(2009). We used the latest version of the light curve pipeline to re-reduce the previous data that includes the background correction in they-direction mentioned above. The aperture used for the LRa01 data is larger than the one for LRa06. It has a total of 96 pixels and a shape closer to the CoRoT-7 point spread function. This results in a contamination value of 0.92±0.57% (Gardes et al. 2011) which is slightly higher than for LRa06 but not significantly so.
[image:3.595.39.293.77.256.2]of each of transit light curve were scaled to account for the red noise. We estimated the time corrected noiseβusing the proce-dure ofWinn et al.(2008). For LRa01 the mean of the beta of each transit is 1.56 and beta ranges from 1.1 to 2.23. For LRa06 the mean is 1.04, the maximum is 1.33 but most of the values are 1.
3. Transit model
The transits observed by CoRoT in the runs LRa01 and LRa06 were modelled simultaneously with the radial velocities from HARPS with the PASTIS code (Díaz et al. 2014). The HARPS radial velocities comprise the previous observations presented byQueloz et al. (2009) and recent observations described by Haywood et al.(2014). As mentioned before, the recent RV ob-servations are simultaneous with the LRa06 CoRoT observa-tions. To obtain consistent system parameters, PASTIS uses a Markov chain Monte Carlo (MCMC) algorithm to sample the parameter’s posteriors. The radial velocities are modelled by a Keplerian orbit, the transit light curves are modelled with the EBOP code (Etzel 1981;Popper & Etzel 1981) and the stellar parameters are interpolated from Geneva (Mowlavi et al. 2012), Dartmouth (Dotter et al. 2008) or PARSEC (Bressan et al. 2012) stellar evolution tracks. At each step of the chain, the proposed stellar density is combined with the stellar metallicity, stellar temperature and the stellar tracks in order to derive the stellar mass and radius. Consistent quadratic limb darkening parame-ters are also derived from the tables ofClaret & Bloemen(2011) at each step. To minimise the effect of stellar variability and of other possible planets on the measured RVs we used a method similar toHatzes et al.(2010,2011). We only considered nights with more than 1 RV observation per night and we included a RV offset for each night which was fitted simultaneously with the system parameters. This is similar to a low pass filter, re-moving variability on timescales longer than 1 day.
The fitted parameters in our full model are: the orbital pe-riod P, the transit epoch T0, the stellar reflex velocityK, the orbital eccentricity e, the longitude of the periastronω, the incli-nationi, the ratio of planet radius to star radiusRp/R∗, the stellar
densityρ∗, 53 nightly radial velocity offsets, the out of transit flux for each CoRoT run and jitter noise for each CoRoT run. Uniform priors were used for all the parameters except for the relative planet to star radius,Rp/R∗, the inclination and stellar
parameters. ForRp/R∗the Jeffreys prior was used while for the
inclination a sine prior was used to impose an isotropic distribu-tion of orbit orientadistribu-tions. Normal priors were used for the stellar density, metallicity and temperature according to the values of (Bruntt et al. 2010; logg =4.47±0.05, [Fe/H]=0.12±0.06, Teff =5250±60 K). The age of CoRoT-7 was constrained to be
less than 3 Gyr as in previous analysis (Léger et al. 2009;Bruntt et al. 2010). For the final results 30 MCMC chains for each of the three stellar models were combined. Each MCMC is comprised of 400 000 steps and was started at random points drawn from the joint posterior. PASTIS uses a principal component analysis that improves mixing while convergence is tested withGelman & Rubin(1992) statistic (Díaz et al. 2014).
3.1. Pure geometric model
The analysis of the CoRoT-7 full data set proved to be com-plex because of the low signal-to-noise transit signal. The transit depth is∼0.00034 which is approximately one third of the rms of the light curve. Therefore, the transits need to be combined to derive the transit shape which implicitly assumes a constant
transit shape and a linear ephemeris. To test these assumptions and gain insight into transit parameter derivation for low signal-to-noise transits in the presence of stellar activity we performed several tests. For these tests, we included only the transit light curves in the PASTIS fit, which we refer to as a pure geometric fit. In this fit the fitted parameters are: three shape parameters (Rp/R∗, the inclination (i) and the normalised separation of the
planet (a/R∗)), the two ephemeris parameters (P andT0), the out-of-transit flux and the jitter. For simplicity, we kept the limb darkening coefficients fixed to the values ofLéger et al.(2009) and assumed a circular orbit. Hence, a/R∗ represents the nor-malised separation of the planet at the time of the transit and needs to be corrected in a first order approximation by1+√esinω
1−e2 , for eccentric orbits. In the next sections we describe the most enlightening of our tests before we present our results in Sect.7.
4. Analysis of LRa06 new CoRoT data
We begin by performing a pure geometric fit to the LRa06 tran-sit light curves. This results in a/R∗ = 5.90+0.05
−2.8 , i = 90◦−10
and Rp/R∗ = 0.017020−.00023.00052 which implies a stellar density
of 3.79+−03..122 ρ. This is higher than the stellar density derived from spectroscopy but consistent within the errors. However, our transit derived stellar density contrasts with the unconstrained analysis of LRa01 (Léger et al. 2009) that led to a transit de-rived stellar density lower than expected from spectroscopy as mentioned above. To solve this inconsistency, in the analysis of LRa01 the stellar radius was used as a prior in the tran-sit fit which resulted in the final solutiona/R∗ = 4.27±0.20, i=80.1±0.3◦,Rp/R∗=0.0187±0.003 (Léger et al. 2009). This
is consistent with our results within 1σ.
We find that, for LRa06, the inclination is poorly con-strained, with the 2σinterval ranging from 68◦ to 90◦, i.e. all possible values that would produce a transit. This suggests that because of the low signal-to-noise of the transit, the transit shape of CoRoT-7b is not well resolved leading to a degenerate solu-tion. This hypothesis is tested in the next subsecsolu-tion.
4.1. White noise test
To test the posterior distribution of transit parameters derived from low signal-to-noise light curves we simulated transits using a preliminary full PASTIS fit (presented in Sect.7). The transits were simulated using theMandel & Agol(2002) transit model parametrised bya/R∗ = 4.08,i = 79.20◦, Rp/R∗ = 0.01781,
the limb darkening coefficientsγ1 = 0.4396 andγ2 = 0.2598
and assuming a linear ephemeris (period of 0.85359199 days and epoch of 2454398.07669). This transit model shape will be used in all the tests presented here.
For observed times within the same transit windows as the data analysed above, we simulated transits and added white Gaussian noise with standard deviation equal to the standard de-viation of the real data,σ=0.0013.
Fig. 3. Posterior distribution of the parameters, a/R∗ and i for the PASTIS pure geometric fits of LRa06 (red) and the transit model plus white noise simulations at the observing times of LRa06 (blue).
be higher than 68◦, i.e. all the values that would produce a tran-sit are allowed. We note that the specific shape of the distribu-tion might depend on the specific parametrisadistribu-tion of the transit shape and priors. In conclusion, the LRa06 parameter posterior distributions are consistent with the final results presented by Léger et al. (2009). Moreover, for low signal-to-noise transits the transit-derived stellar density is not well constrained and the stellar density derived from spectroscopy or asteroseismology can help constrain the transit geometry as we explore next.
4.2. Stellar density
In this section we discuss in detail our treatment of the stellar density which constrains the planetary parameters. In particu-lar, we explain the differences between our transit fitting method implemented in PASTIS and the method applied byLéger et al. (2009).
Usually, for high signal-to-noise transit light curves the stel-lar density is derived directly from the transit (Seager & Mallén-Ornelas 2003) and at better precision than the logg estimated from spectroscopy. Therefore, the stellar density derived from the transit together withTeff and [Fe/H] estimated from
spec-troscopy can be combined with the stellar models (Sozzetti et al. 2007) or empirical calibrations (Torres et al. 2010) and used to constrain the stellar mass and radius (e.g.Barros et al. 2011b). Interesting tests on using the transit derived density to better con-strain stellar parameters can be found inTorres et al. (2012); Gómez Maqueo Chew et al.(2013). However, for low signal-to-noise transits where the constraint on the stellar density by the transit is weak, it can be advantageous to use the spectroscopic derived loggto estimate the stellar mass and radius, which con-sequently constrains the transit parameters. This was the method applied byLéger et al.(2009) for CoRoT-7b, who included the spectroscopic derived radius as a prior in the transit analysis. This was necessary to solve the density inconsistency that was mentioned before. Within PASTIS the transits are modelled to-gether with the stellar models and the stellar properties (stellar density, [Fe/H] andTeff), which is equivalent to a prior in the
[image:5.595.321.540.76.249.2]stellar properties but works in a self-consistent way, appropri-ately weighting the constrains on the density.
Fig. 4.Dartmouth (Dotter et al. 2008) stellar evolution tracks for stellar metallicities of 0.05 (solid lines) and 0.15 (dashed lines). The posterior distribution 1σ, 2σand 3σcontours for a pure geometric fit of LRa06 is shown in blue. Including the stellar models in the fit allows to better constrain the density by reducing the posterior distribution to the red area.
In Fig.4we show the density derived from the fit of LRa06 transit data including the stellar models and excluding the stel-lar models. We also show the stelstel-lar tracks for stars with masses from 0.6 to 1.3Mwith [Fe/H]=0.05 and [Fe/H]=0.15. It is evident that the stellar density derived from the transit is poorly constrained with the 2σinterval including 0.2−4.7ρ. This is due to the short ingress/egress time for small-sized planets com-bined with the low signal-to-noise of the light curve. In this case, stellar evolution tracks together with logg,Teffand [Fe/H]
esti-mated from spectroscopy add information to our model and help constrain the transit parameters. Including the stellar models in the transit analysis and assuming a circular orbit the solution is much better constrained and we obtaina/R∗ = 4.475+0.052
−0.17 , i = 81.280−.036.8◦ and Rp/R∗ = 0.018130−.000033.00085. This solution
agrees within 1σwith the final solution presented byLéger et al. (2009).
5. Comparison of LRa01 and LRa06
As mentioned above when stellar priors are not included, the transit-derived stellar density for LRa06 is much higher than for LRa01. To investigate this inconsistency we compared the posterior distributions of the parameter fits for each observa-tion. Therefore, we perform a pure geometric fit to the obser-vations of LRa01 following the same procedure as described above for LRa06. The most probable solution (the mode of the distribution) for LRa01 is given in Table1together with the re-sults for LRa06 (LRa01 geo and LRa06 geo). The transit-derived stellar density for LRa01 is 0.27+0.17
−0.10ρ, significantly different
than for LRa06. The parameter posterior distributions ofa/R∗,i, andRp/R∗for LRa01 and LRa06 are shown in Fig.5. It is
Table 1.Geometric fitted parameters for LRa01 and LRa06.
Reference a/R∗ Rp/R∗ i[◦] LRa01 geo [1] 1.9±0.1 ∼0.0215 ∼65 LRa01 star [1] 4.27±0.2 0.0187±0.003 80.1±0.3 LRa01 geo 2.28+0.65
−0.12 0.02096±0.0008 67.0+ 5.1
−2.7 LRa01 star 4.487+0.041
−0.19 0.018673 0.00025
−0.00042 80.82 0.28
−0.74 LRa06 geo 5.90+0.05
−2.8 0.01702 0.0023
−0.00052 90−10 LRa06 star 4.475+0.052
−0.17 0.01813 0.00033
−0.00085 81.28 0.36
−0.8
[image:6.595.44.286.98.190.2]Notes.We also show the results presented by (Léger et al. 2009) ([1]) for a simple fit and a fit with a prior on the stellar radius.
Fig. 5.Posterior distribution of the geometric parameters for the sepa-rate fits of the LRa01 (red) and the LRa06 (blue) runs.
the depth of the transits. However, instrumental noise is not ex-pected to produce large differences ina/R∗ori. To better illus-trate the differences between the parameter posterior distribu-tions of LRa01 and LRa06 the correlation plots fora/R∗,Rp/R∗
andiderived by the pure geometric fits of each run are shown in Fig.6. This can be directly compared with Figure 18 ofLéger et al.(2009) for LRa01.
In Table1 we also give both parameter solutions found by Léger et al. (2009). The unconstrained analysis (LRa01 geo Léger et al.(2009) ) agrees well with our geometric solution for LRa01. The results obtained by including the stellar models in the PASTIS fit and assuming a circular orbit for each of the runs are also given in Table1(LRa01 star and LRa06 star). The stellar models constraina/R∗that constrainsRp/R∗andi(Figs.6
and4). We conclude these agree with each other and agree with the solution ofLéger et al.(2009). This shows that our geomet-ric and full model fit including stellar models are consistent with the method and results ofLéger et al.(2009). The inconsistency is between the geometric solution for LRa01 and the final so-lution constrained by the stellar models that agree only at 3σ. Hence, the posterior probability distribution of LRa01 seems to be somehow distorted. It is important to understand this incon-sistency to avoid biasing the estimation of the derived systems parameters.
[image:6.595.45.285.241.441.2]The cause of the density inconsistency was investigated by Léger et al.(2009) and two possible causes were suggested. The
Fig. 6.Correlation plots for thea/R∗,Rp/R∗andiderived by the pure
geometric fits of LRa01 (red) and LRa06 (blue). For each we show the 1σ, 2σand 3σcontours.
first one was transit timing variations (TTVs) caused by the pres-ence of other planets in the system. This hypothesis was sup-ported by the fact that the derived stellar density was higher if TTVs were accounted for. However, the TTVs timescales were inconsistent with gravitational interaction with other planets and a second hypothesis suggested, that TTVs were induced by stel-lar activity.Léger et al.(2009) favoured the stellar activity hy-pothesis as the cause for the degradation of the transit shape re-sulting on the ingress and egress being less steep than expected. Therefore, the authors chose to fix the stellar radius in the pa-rameter fit process to obtain the system papa-rameters (LRa01 star Léger et al. 2009) for their adopted solution.
Fortunately, the stellar activity was lower during LRa06 observations. During LRa06, the peak-to-peak variability am-plitude of the light curve is half of the value during LRa01. The activity induced RV variations have a maximum amplitude of 53 m s−1 for the follow-up run of LRa01 while for the
si-multaneous observations with LRa06 it is 30 m s−1 (Queloz et al. 2009;Haywood et al. 2014). The spectroscopic activity index (logRHK) measured in both RV data sets also decreased from−4.60±0.03 to−4.73±0.03. Therefore, it is possible that the stellar activity deformation of the transit shape is higher in LRa01 than in LRa06 which would explain our results. Another hypothesis is that the cause of the shape deformation is instru-mental. These two possibilities will be investigated in the next Sect.6. However, we start by testing the TTV hypothesis.
5.1. Transit timing variations
Table 2.CoRoT-7 system parameters.
Eccentric Circular
adopted
Planet orbital period,P[days]• 0.85359163±5.8e-7 0.85359159±5.7e-7 Mid-transit time,Tc[BJD]• 2 454 398.07741±6.9e-4 2 454 398.07756−+47..54ee−−44 cov(P,Tc) [days2] –2.37×10⁻¹⁰ –2.02×10⁻¹⁰ Orbital eccentricity,e• 0.137+0.094
−0.053<0.32† Argument of periastron,ω[deg]• 81±30 Orbit inclination,i[deg]• 81.20+1.5
−0.44 80.78+ 0.51
−0.23 Orbital semi-major axis,a[AU] 0.017027+1.6e−4
−4.7e−5 0.017016+ 1.7e−4
−3.6e−5 semi-major axis/radius of the star,a/R 4.469−+00..087040 4.484±0.070
Radius ratio,k=Rp/R• 0.01721±0.00060 0.01784±0.00047
Linear limb darkening coefficient,ua 0.517±0.015 0.515±0.014
Quadratic limb darkening coefficient,ub 0.187±0.010 0.188±0.011
Transit duration,T14[h] 1.049+−00..035019 1.059±0.026
Impact parameter,b 0.594+0.066
−0.14 0.713+ 0.017
−0.026 Radial velocity semi-amplitude,K[m s−1]• 3.85±0.60 3.94±0.57
Effective temperature,Teff[K]• 5267±60 5259±58 Metallicity, [Fe/H] [dex]• 0.137±0.059 0.138±0.061 Stellar Density,ρ[ρ]• 1.665±0.080 1.671±0.073
Star mass,M[M] 0.915±0.019 0.913±0.017
Star radius,R[R] 0.818±0.016 0.820±0.019
Deduced stellar surface gravity, logg[cgs] 4.572±0.011 4.573±0.011
Age of the star [Gyr] 1.32±0.76 1.32±0.75
Planet mass,Mp[M⊕] 5.55±0.85 5.74±0.86
Planet radius,Rp[R⊕] 1.528±0.065 1.585±0.064 Planet mean density,ρp[g cm−3] 8.1±1.6 7.5±1.4 Planet surface gravity, loggp[cgs] 3.348±0.068 3.332±0.065 Planet equilibrium temperature∗,Teq[K] 1759±30 1756±27
Distance of the system [pc]• 154.2±4.7 153.7±4.5
Adopted planet mass,Mp[M⊕] 4.73±0.95 (Haywood et al. 2014) Adopted planet mean density,ρp[g cm−3] 6.59±1.5 (Haywood et al. 2014)
Notes.(•)MCMC jump parameter.(†)Upper limit, 99% confidence.(∗)T
eq=Teff(1−A)1/4
R
2a, using an albedoA=0.
transit times we used a procedure similar toBarros et al.(2011b) but each transit was fitted individually with the fixed shape. We included a linear baseline function in the fit and hence three pa-rameters were fitted for each transit: T0,FoutandFgrad. Because
of the poor quality of the light curve we imposed a uniform prior in the transit times, restricting them to be within half of the tran-sit duration from the linear ephemeris. Using a prior with double or half of this size did not significantly alter the results. We es-timated the transit times with the median of the distribution and the 1σlimits as the value at which the normalised integral of the distribution equals 0.341 at each side of the median. The pos-terior distributions of the transit times are clearly not Gaussian and some present several peaks hence, we caution the reader to an over-interpretation of the individual results and instead prefer to analyse them in a qualitative way. The residual transit times after removing a linear ephemeris, also called transit timing vari-ations (TTVs) are shown in Fig.7.
We find that the transit times of CoRoT-7b agree well with a linear ephemeris, with a reduced chi-square of 0.95 correspond-ing to p-value of 29. We also conclude that there is neither a sig-nificant period variation nor a transit timing variation between
the two epochs of the CoRoT observations. To explore period-icities in the TTVs, the Lomb-Scargle periodogram was com-puted (Fig.8). There is no significant peak at the 2σconfidence limit (dashed horizontal lines) if we perform a random period-icity search. The conclusion is that we do not detect any transit timing variations in CoRoT-7b due to the gravitational influence of other planets.
0 20 40 60 80 100 120 140 Epoch
−40 −20 0 20 40
O−C linear (min)
[image:8.595.74.533.70.300.2]1800 1820 1840 1860 1880
Fig. 7.Derived TTVs for CoRoT-7b assuming a linear ephemeris for LRa01 (left panel) and LRa06 (right panel).
0.0 0.1 0.2 0.3 0.4 0.5
Frequency (cycl/pb) 0
2 4 6 8 10
Power
2 sigma any P
Prot
3 sigma for known P
Fig. 8.Lomb scargle periodogram of the derived TTVs of CoRoT-7b. The rotation period of the star and half of the rotation period of the star are shown as vertical red lines. We over lay the 2σ false alarm probability level for any period (black horizontal line) and the 3σfalse alarm probability level for a known period (blue horizontal line).
duration of 1.056±0.017 h for LRa01 and 1.105±0.035 h for LRa06 when we include stellar models. These are compatible within 1σ.
However, if the TTVs are induced by stellar activity they can have periodicities related to the stellar rotation period. For Kepler-17b, that shows clear planet-spot occultation events, the TTVs have a periodicity at half of the rotation period of the star (Désert et al. 2011). In WASP-10b the TTVs periodicity is at the rotation period of the star (Barros et al. 2013) and for CoRoT-8b the TTVs periodicity is also related to the rotation period of the star (Bordé et al. 2010). In the Lomb-Scargle periodogram of the CoRoT-7b TTVs there is a peak close to half of the rotation period of the star. Although this period is not significant in a blind periodicity search, if we search specifically at the rotation period of the star or half of the rotation period of the star we find that the latter is significant at 3σ. Therefore, there is a hint that the transit shapes and times of CoRoT-7b are affected by stellar activity. In the case of planet-spot occultations, the deformation
of the transit shape is accompanied by apparent transit timing variations (Alonso et al. 2009;Barros et al. 2013).
6. Distortion of the posteriors of LRa01
6.1. White noise test
As shown in Sect.4.1the derived parameters from LRa06 are poorly constrained because of the low signal-to-noise of the tran-sits. However the solution is more precise for LRa01 given that the distortion of the transit shape results in a high impact param-eter. The best geometric solution derived from LRa01 is only consistent with the final solution presented inLéger et al.(2009) at 3σ. In order to test if the difference in the posterior distribu-tion shape of the LRa01 relative to LRa06 is caused by the dif-ferent sampling due to the gaps during the SAA passage we also tested the white noise hypothesis for LRa01. At the LRa01 ob-served times we simulated transits with the same transit model shape as used for the LRa06 white noise test (this corresponds to the final solution given in Table2). To the simulated transits we added white noise with standard deviation corresponding to this runσ=0.00097. The simulated transits were fitted with the pure geometric PASTIS model. Stellar models were not included in these intermediate tests because they strongly restrict the pa-rameter space, they will only be included in the final analysis. We found that the parameter posterior distributions the simu-lated transits is the same as for LRa06 implying that the differ-ence in the posterior distribution shape is neither due to the low signal-to-noise of the data nor to the different time of the sam-pling. The difference between the posterior distributions ofa/R∗ for the LRa01 and the LRa01 white noise simulations is higher than zero at 95% confidence limit. Therefore, we conclude that the LRa01 posterior parameter distributions cannot be explained by the assumed transit shape and white noise.
6.2. Instrumental noise test
[image:8.595.52.279.337.511.2]Fig. 9.Posterior distribution ofa/R∗(top) andi(bottom) for pure ge-ometric fits of the simulated transit model plus white noise (WN) at phase 0, and the transit model plus real data at phase 0.6 (RN) for both LRa01 and LRa06. For comparison we also show the results for the observations of LRa01.
chosen because of the combination of its brightness (V =12.3) and its proximity to CoRoT-7 (9.5). The transits were injected in the light curve of 102727008 at the transit times of CoRoT-7b according to a linear ephemeris as before. The posterior distri-bution of the parameters is similar to the one obtained for the white noise simulations. Hence, we exclude global instrumental noise as the cause of the distortions of the posterior parameter distributions.
6.3. Red-noise/Out-of-transit variability test
In this section, we investigate if the posterior distribution shape of LRa01 may be caused by non-white noise in the light curve of CoRoT-7. This may be due to out-of-transit stellar variability or localised instrumental effects. A possible way to test this is to inject transits in the real light curve of CoRoT-7 at phases different from the transit phase. Therefore, transits were injected in both CoRoT runs at phases 0.2, 0.4, 0.6 and 0.8 with the same transit model explained above. The simulated transits were fitted with the pure geometric model as explained above. We find that the posterior distributions for the different phases agree well. In Fig.9, we present a comparison of the posterior distributions of the most problematic parameters,a/R∗andi, for transits injected in the two observed light curves of CoRoT-7 at phase 0.6, as an example. In the same figure we also show the analysis of transits injected at phase zero which include only white noise (WN) and the results for the real transits of LRa01 for comparison.
It is evident that the shape of the parameter posterior dis-tributions for all the injected transits light curves is similar but different from the LRa01 light curve. For phases 0.2, 0.6 and 0.8 the difference the posterior of a/R∗ from the observed LRa01 is non zero at 95% confidence but for phase 0.4 the difference is only non-zero at 90% confidence. This implies that neither the out-of-transit stellar variability nor instrumental red-noise is unlikely to explain LRa01 observations. However, LRa01 data could still be affected by in-transit stellar activity, more specifi-cally planet-spot occultation events. Because of the low signal-to-noise ratio of each individual transit, fitting a spot model is not feasible, so this hypothesis cannot be tested directly.
Fig. 10.Posterior distribution ofa/R∗(top) andi(bottom) for pure ge-ometric fits of the transit selections based on the out of transit flux. The transits at high flux levels are shown in red for LRa01 and blue for LRa06 while the one at the low flux levels are shown in magenta for LRa01 and cyan for LRa06.
6.4. Test out-of-transit flux
Our previous tests suggest that there is an extra noise component in the LRa01 not present at other transit phases. This degrades the transit shape which appears more V-shaped. To test if this is related to the visible spots we divided transits according to their out-of-transit flux level and use the median as a threshold separately for LRa01 and LRa06. Each of the selections were fitted with the pure geometric models as before.
In Fig.10, we show a comparison of the posterior distribu-tions ofa/R∗andifor the high and low flux levels of each run. We find that the posterior distributions are all similar except for the selection of the low flux level of LRa01. We conclude that the low flux level transits of LRa01 appear to have more extra noise than the other samples. As mentioned above, in CoRoT-7 the activity is dominated by spots. Low flux levels imply a larger spot coverage and hence a higher probability of spot occultation events during transit. In LRa06 the amplitude of the flux vari-ability was half of the one found in LRa01. If we assume that the maximum flux in both light curves (LRa01 and LRa06) is the same, LRa06 has similar spot coverage than the high flux level selection of LRa01 which could explain our results.
6.5. Selecting transits
The effect of stellar activity on individual transits is not clear because of the low signal-to-noise ratio. Our tests, however, show that the deformation of the transits is not related to out-of-transit stellar variability or instrumental noise. Both the peri-odicity found in the TTVs related to half of the rotation period of the star and the distortion of the posterior probability distri-butions for lower flux levels support that the cause of the extra noise is spot occultation events.
[image:9.595.45.286.77.278.2]Fig. 11.Phase folded light curve of CoRoT-7b binned for clarity. In green we show the best transit model derived from fitting simultaneously the CoRoT light curves and HARPS RVs that corresponds to the circular solution given in Table2. We also show the best pure geometric transit model for LRa01 (red) and LRa06 (blue) corresponding to the solutions presented in Fig.5and Table1.
Fig. 12.Phase folded radial velocities. The different nights were plotted with a different combination of colour and symbol.
of the transit. Therefore, we opt to select transit on the basis of out-of-transit flux that does not assume a transit shape. For the final result we combined the high flux level selection of LRa01 with the LRa06 full dataset.These two light curves show almost the same amplitude of flux variability and similar parameter pos-terior distributions.
7. Results
In our final analysis of the data we combined all transits of LRa06 with transits of LRa01 that have out-of-transit flux level higher than the median flux. These were fitted with PASTIS to-gether with the RVs and with the stellar models as described in Sect.3to derive full system parameters. From Table1we con-clude that the derivedRp/R∗for both runs agree within 1σwhen
stellar models are included. Therefore, there is no significant dif-ference in contamination between both runs. The mode of the posterior distribution and the 68.3% central confidence interval of the derived system parameters are presented in Table2. Since the value of the eccentricity is consistent with zero, the circular orbit solution is also presented in the same table. The determined stellar parameters were combined with the CoRoT-7 photomet-ric magnitudes from APASS2, 2MASS (Skrutskie et al. 2006), and WISE catalogues (Wright et al. 2010) to derive the distance to the system which is also given in Table2.
2 http://www.aavso.org/apass
We performed a Bayesian model comparison between the circular and the eccentric orbit model. In order to estimate the evidence, we use theChib & Jeliazkov(2001) method, obtaining log10of the Bayes factor of the circular over the eccentric orbit model of 3.0±2.4. We conclude that there is no preference over both models (Díaz et al. 2014). For the sake of simplicity we adopt the circular orbit solution. We note that the results of both solutions are within 1σ. A full discussion on the eccentricity will be presented elsewhere (Haywood et al. 2014; Hatzes et al., in prep.). We show the adopted circular model overlayed on the phase folded transits of CoRoT-7b, in Fig.11. In Fig.12, we show the phase folded radial velocities.
Our derived stellar parameters,ρ∗=1.671±0.073ρ,R∗= 0.820±0.019RandM∗ =0.913±0.017Magree well with those ofBruntt et al.(2010),ρ∗ =1.65±0.15ρ,R∗ =0.82± 0.04RandM∗=0.91±0.03M.
The measured planet-to-star radius, Rp/R∗ = 0.01784±
0.00047 and planetary radius,Rp=1.585±0.064R⊕agree well
with the previous estimate (Léger et al. 2009). The derived planet mass,Mp =5.74±0.86M⊕agrees with the previous estimates
byQueloz et al.(2009);Hatzes et al.(2010,2011);Boisse et al. (2011);Haywood et al.(2014). This implies a planetary density of 1.35±0.25ρ⊕or 7.5±1.4 g/cm3.
For high signal-to-noise light curves where the limb darken-ing can be fitted a discrepancy between the fitted values and the tabulated values from stellar atmospheric models was reported (e.g.Claret 2009;Barros et al. 2012). This can be a source of systematic errors in the derived planetary parameters (Csizmadia et al. 2013). The fitting of the limb darkening parameters, how-ever is not feasible in our case. We tried fitting a linear limb darkening law and foundγ1 ∼1 but it is not well constrained.
The derived planetary radius for this fit was smaller by 0.35σ. Therefore, it can be concluded that fixing the limb darkening does not significantly affect our results.
The stellar age derived by gyrochronology and by activity-age relations (Age= [1.2,2.3] Gyr,Léger et al. 2009; Bruntt et al. 2010) was used to constrain the stellar models in previ-ous studies. In addition, in our analysis we constrained the stel-lar age to be less than 3 Gyr. However, if stelstel-lar age is not con-strained, we find the most probable stellar age to be 8.4+5.0
−3.3Gyr
[image:10.595.44.287.276.424.2]constrain on the stellar density for example with asteroseismol-ogy would significantly improve the accuracy of the planetary parameters.
7.1. Planetary density
As mentioned before, the uncertainty on the mass of CoRoT-7b prevented constraining its bulk composition in previous works. The lower mass estimate fromPont et al.(2011) allows a gaseous composition. However, all the other mass estimates imply a rocky composition (Valencia et al. 2010;Valencia 2011;Barnes et al. 2010;Leitzinger et al. 2011) between Earth-like (33% iron and 67% silicate mantle) and Mercury-like (63% iron and 37% silicate mantle). The new radial velocity data set allowed a bet-ter constraint on the planetary mass. As mentioned above, the derivation of the planetary mass is the subject of companion pa-pers (Haywood et al. 2014; Hatzes et al., in prep.). The RVs were included in our analysis to confirm that the eccentricity is not significant given that a better accuracy on the eccentricity can be achieved when a combined fit of the transits and RVs is performed (e.g.Barros et al. 2011a). An accurate eccentricity is needed to derive accurate transit parameters. Using our simple method to filter the activity in the RVs we found no significant eccentricity and the derived planetary mass agrees well with the results byHaywood et al.(2014).Haywood et al.(2014) use the light curve to correct the radial velocities with theff’ method ofAigrain et al.(2012) combined with a Gaussian process that has the same covariance properties as the light curve. We show these two very different techniques result in values of the plane-tary mass and eccentricity that are in agreement at 1σ. This con-trasts with previous estimates of the mass of CoRoT-7b when the stellar activity was higher. Since theff’ method is a phe-nomenological method we adopted their derived planetary mass Mp=4.73±0.95 M⊕instead of our value using a simple
filter-ing technique. Combinfilter-ing the new value for radius with the mass derived by (Haywood et al. 2014) we obtain a planetary density ofρp=6.59±1.5 g/cm3. This implies that CoRoT-7b is slightly
more dense than the Earthρp=1.19±0.27ρ⊕. Figure13shows
the position of CoRoT-7b on a mass-radius diagram alongside other exoplanets for which mass and radius have been measured. According to composition models byZeng & Sasselov(2013) for solid planets, CoRoT-7b could be composed of silicates com-bined with water ice or iron. These are also in agreement with the models ofWagner et al.(2011). In this case any water ice is mixed with the silicates and does not imply the planet has an at-mosphere. Hence, the planetary parameters are compatible with a rocky composition.
However, the existence of an atmosphere would introduce a degeneracy in the models. The short orbital period and high equi-librium temperature of the planet,Teq =1756±27 K might be
[image:11.595.324.541.75.380.2]hard to reconcile will an atmosphere dominated by a volatile gas, H2O. The stability of similar Water ocean-planet was studied by Selsis et al.(2007) that derived a lower limit for the lifetime of atmosphere of planets under the erosion of Extreme UV and stellar wind life of the star. According to Fig. 4 ofSelsis et al. (2007) it is possible that for the derived parameters of CoRoT-7 the atmosphere would have been eroded. However, the contrary cannot be excluded since no upper limit on the lifetime was pre-sented. A similar conclusion was found byValencia(2011) that shows that in CoRoT-7b the age of the system is similar to the timescale of the evaporation of water vapour. The presence of an atmosphere will be clarified with future observations with JWST (Samuel et al. 2014). A better constrain on the stellar and planetary parameters are needed to obtain further insight into the composition of CoRoT-7b.
Fig. 13.Mass-radius diagram for low mass planets showing the position of CoRoT-7b withMp=4.73±0.95 M⊕(Haywood et al. 2014) and the
derived the radius for the selected sample,Rp=1.585±0.064R⊕(blue).
We show the position of Earth and Venus (diamonds) for comparison. The solid lines show the mass and radius for planets with different com-positions according to the models ofZeng & Sasselov(2013).
8. Discussion
We have showed that the transit-derived stellar density for each of the CoRoT-7b observations is different from the spectroscopic derived density, for LRa01 it is lower while for LRa06 it is higher. The comparison between the transit derived stellar den-sity and the spectroscopic derived value has long been used as a blend test in transit surveys (Collier Cameron et al. 2007; Tingley et al. 2011). Furthermore, it has also been used to es-timate the orbital eccentricity directly from the transit for some Keplercandidates byDawson & Johnson(2012), the technique was first suggested by Ford et al. (2008). Recently, Kipping (2014) discusses five other effects that would lead to the transit derived stellar density being different from the true stellar den-sity. In this paper we show two other effects that can lead to a poor precision or accuracy of the stellar density from the transit, respectively the poor resolution of the egress/ingress time and transit spot occultation events that are not resolved in a single transit.
To solve the poor resolution of the egress/ingress time we have used the spectroscopic derived stellar properties (logg, [Fe/H] andTeff) together with stellar models to help constrain
the transit shape. This allows to constrain the system parameters but assumes that the other effects are negligible.
the effect of spot occultation events in transits, specially dur-ing dur-ingress and egress as shown byBarros et al. (2013). Once the spot occultation events are identified there are several ways to account for them, for example, masking the affected transit phase, simultaneously fitting a occultation spot model or reject-ing affected transits. However, when the individual transits are not resolved like for the case of CoRoT-7b presented here, it was not possible to identify affected transits. The only option we found was rejecting transits based on the out-of-transit flux which is related to the spot coverage.
Assuming the distortion of the posterior is significant and re-lated to spot occultation events, these could have affected the ra-dius estimate. For example, for CoRoT-2b it has been shown that spot occultation events lead to an underestimation of the planet-to-star radius (Silva-Valio et al. 2010). However, in our case case we found no significant difference in the derived planet-to-star radius. If we consider all the transits we obtain a value of the planet-to-star radius consistent within one sigma with value ob-tained with the selection.
The transit chord covers latitudes between 38 and 41.6 degrees in stellar surface. Sun spots are located at lati-tudes lower than 30 degrees; however, for stars more active than the sun the spots can reach higher latitudes (Moss et al. 2011). Besides a difference in the stellar activity level between LRa01 and LRa06 the spot mean latitudes have also changed (Lanza et al. 2010; and in prep.). This can explain the difference of ef-fect of activity in the transit derived parameters between both runs.
Besides the bias in the parameter estimation due to spot oc-cultation events, the stellar activity in CoRoT-7 can also intro-duce a bias due to out-of-transit flux variations (Czesla et al. 2009). Assuming the stellar variability in CoRoT-7 is domi-nated by cool spots (Queloz et al. 2009; Lanza et al. 2010), the planet-to-star radius is overestimated. Using Eq. (19) of Kipping(2014), for a stellar variability amplitude of 2% we es-timate the true planet-to-star radius is 0.99×the observed value which implies an overestimation of the planetary radius of 0.5%. Furthermore, spots that do not produce significant rotational flux modulation will lead to a higher overestimation of the planetary radius that could only be detected by long term monitoring of the star.
9. Conclusions
We present new photometric observations of CoRoT-7 with the CoRoT satellite during the LRa06 run. These were combined with the previous CoRoT-7 observations during the LRa01 run and radial velocity observations obtained with HARPS and fit-ted with the PASTIS code. Due to the lower activity level of CoRoT-7 during LRa06, we were able to disentangle the effects of activity and the difficulty of differentiating the ingress/egress time in shallow transits with low signal-to-noise.
For pure geometric fits, we find a difference in the transit parameter posterior distribution of the two CoRoT-7 runs. For LRa06 the results are consistent with what would be expected by white noise while for LRa01 we show that the transit param-eter posterior distribution is distorted implying a transit shape deformation.
To investigate the degradation of the transit shape in LRa01, we performed several tests that excluded the low signal-to-noise of the transit and out-of-transit variability due to either activ-ity or instrumental noise as causes of the transit shape defor-mation. This suggested that the transit shape deformation could be due to planet-spot occultation events and is supported by the fact that the transit times show a periodicity related to half of the
rotation period of the star. Moreover, the distortion of the poste-rior happens only for transits with out-of-transit flux lower than the median level in LRa01. To avoid biasing the estimation of the parameters these transits were discarded in our analysis.
During the observations of LRa06 the star was in a lower activity level and the spot latitudes had probably migrated with respect to LRa01 (Lanza et al. 2010; in prep.). Consequently, the transit shape was less affected by activity and the parameter pos-terior distributions are consistent with the derived transit model for white noise dominated data. However, because of the low signal-to-noise of the transits the ingress/egress time is not well defined leading to a poor constraint on the inclination. Therefore, stellar models were included in our transit fitting procedure in order to constraint the system parameters.
The transits with out-of-transit flux higher than the me-dian level in LRa01 were modelled simultaneously with all LRa06 data, the HARPS radial velocity data and stellar models to derive system parameters using PASTIS.
We obtained a planetary mass ofMp=5.74±0.86 M⊕
sup-porting the previous values byQueloz et al.(2009);Hatzes et al. (2010,2011);Boisse et al.(2011);Haywood et al.(2014). The derived planetary radius,Rp = 1.585±0.064 R⊕agrees well
with previous results. Combining our planetary radius with the planetary mass derived byHaywood et al. (2014) we obtain a planetary density of 1.19±0.27ρ⊕which implies a composition with a significant amount of silicates.
Our results illustrate the difficult in recognising the effects of activity in small planet transits. However, in this case we find that there is no significant effect on the derived planetary parameters. This could be due to the solution being dominated by the prior on the stellar density using stellar models. Therefore, our results are strongly dependent on the stellar parameters and the age limit assumed and would benefit from tighter constraints on the stellar properties.
Acknowledgements. We thank the referee Roberto Sanchis-Ojeda for his careful review and constructive comments, which significantly contributed to improving the quality of the paper. The CoRoT space mission, launched on December 27th 2006, has been developed and is operated by CNES, with the contribution of Austria, Belgium, Brazil, ESA (RSSD and Science Programme), Germany and Spain. We acknowledge the PNP of CNRS/INSU, and the French ANR for their support. The team at LAM acknowledges support by grants 98761 (SCCB) and 251091 (JMA). R.F.D. was supported by CNES via the its post-doctoral fellowship program. AS acknowledges the support of the European Research Council/European Community under the FP7 through the Starting Grant agreement number 239953. This research was made possible through the use of the AAVSO Photometric All-Sky Survey (APASS), funded by the Robert Martin Ayers Sciences Fund. This publication makes use of data products from the Two Micron All Sky Survey, which is a joint project of the University of Massachusetts and the Infrared Processing and Analysis Center/California Institute of Technology, funded by the National Aeronautics and Space Administration and the National Science Foundation. This publica-tion makes use of data products from the Wide-field Infrared Survey Explorer, which is a joint project of the University of California, Los Angeles, and the Jet Propulsion Laboratory/California Institute of Technology, funded by the National Aeronautics and Space Administration. The team at IAC acknowl-edges support by grant AYA2012-39346-C02-02 of the Spanish Ministerio de Economiá y Competividad. The German CoRoT team (TLS and University of Cologne) acknowledges DLR grants 50OW0204, 50OW0603, and 50QM1004. The research leading to these results has received funding from the European Union Seventh Framework Programme (FP7/2007-2013) under grant agreement No. 267251.
References
Agol, E., Steffen, J., Sari, R., & Clarkson, W. 2005, MNRAS, 359, 567 Aigrain, S., Pont, F., & Zucker, S. 2012, MNRAS, 419, 3147 Alonso, R., Auvergne, M., Baglin, A., et al. 2008, A&A, 482, L21
Auvergne, M., Bodin, P., Boisnard, L., et al. 2009, A&A, 506, 411
Barnes, R., Raymond, S. N., Greenberg, R., Jackson, B., & Kaib, N. A. 2010, ApJ, 709, L95
Barros, S. C. C., Marsh, T. R., Dhillon, V. S., et al. 2007, MNRAS, 374, 1334 Barros, S. C. C., Faedi, F., Collier Cameron, A., et al. 2011a, A&A, 525, A54 Barros, S. C. C., Pollacco, D. L., Gibson, N. P., et al. 2011b, MNRAS, 416, 2593 Barros, S. C. C., Pollacco, D. L., Gibson, N. P., et al. 2012, MNRAS, 419, 1248 Barros, S. C. C., Boué, G., Gibson, N. P., et al. 2013, MNRAS, 430, 3032 Boisse, I., Bouchy, F., Hébrard, G., et al. 2011, A&A, 528, A4
Bordé, P., Bouchy, F., Deleuil, M., et al. 2010, A&A, 520, A66 Borucki, W. J., Koch, D. G., Basri, G., et al. 2011, ApJ, 728, 117 Bressan, A., Marigo, P., Girardi, L., et al. 2012, MNRAS, 427, 127 Bruntt, H., Deleuil, M., Fridlund, M., et al. 2010, A&A, 519, A51 Chambers, J. E. 1999, MNRAS, 304, 793
Chib, S., & Jeliazkov, I. 2001, J. Am. Stat. Assoc., 96, 270 Claret, A. 2009, A&A, 506, 1335
Claret, A., & Bloemen, S. 2011, A&A, 529, A75
Collier Cameron, A., Wilson, D. M., West, R. G., et al. 2007, MNRAS, 380, 1230
Csizmadia, S., Pasternacki, T., Dreyer, C., et al. 2013, A&A, 549, A9 Czesla, S., Huber, K. F., Wolter, U., Schröter, S., & Schmitt, J. H. M. M. 2009,
A&A, 505, 1277
Dawson, R. I., & Johnson, J. A. 2012, ApJ, 756, 122 Deeg, H. J., Garrido, R., & Claret, A. 2001, New Astron., 6, 51
Désert, J.-M., Charbonneau, D., Demory, B.-O., et al. 2011, ApJS, 197, 14 Díaz, R. F., Almenara, J. M., Santerne, A., et al. 2014, MNRAS, 441, 983 Dotter, A., Chaboyer, B., Jevremovi´c, D., et al. 2008, ApJS, 178, 89 Dvorak, R., Schneider, J., & Eybl, V. 2010, unpublished
[arXiv:1004.4129]
Etzel, P. B. 1981, in Photometric and Spectroscopic Binary Systems, eds. E. B. Carling, & Z. Kopal (Dordrecht: D. Reidel PublishingCo), 111
Ferraz-Mello, S., Tadeu Dos Santos, M., Beaugé, C., Michtchenko, T. A., & Rodríguez, A. 2011, A&A, 531, A161
Ford, E. B., Quinn, S. N., & Veras, D. 2008, ApJ, 678, 1407
Gardes, B., Chabaud, P.-Y., & Guterman, P. 2011, in Proc. of the 2nd CoRoT Symp., 2, 119
Gelman, A., & Rubin, D. 1992, Statistical Science, 7, 457
Gómez Maqueo Chew, Y., Faedi, F., Cargile, P., et al. 2013, ApJ, 768, 79 Hatzes, A. P., Dvorak, R., Wuchterl, G., et al. 2010, A&A, 520, A93 Hatzes, A. P., Fridlund, M., Nachmani, G., et al. 2011, ApJ, 743, 75
Haywood, R. D., Collier Cameron, A., Queloz, D., et al. 2014, MNRAS, 443, 2517
Holman, M. J., & Murray, N. W. 2005, Science, 307, 1288 Kipping, D. M. 2014, MNRAS, 440, 2164
Lanza, A. F., Pagano, I., Leto, G., et al. 2009, A&A, 493, 193 Lanza, A. F., Bonomo, A. S., Moutou, C., et al. 2010, A&A, 520, A53 Léger, A., Rouan, D., Schneider, J., et al. 2009, A&A, 506, 287
Leitzinger, M., Odert, P., Kulikov, Y. N., et al. 2011, Planet. Space Sci., 59, 1472
Mandel, K., & Agol, E. 2002, ApJ, 580, L171
Moss, D., Sokoloff, D., & Lanza, A. F. 2011, A&A, 531, A43 Mowlavi, N., Eggenberger, P., Meynet, G., et al. 2012, A&A, 541, A41 Pont, F., Aigrain, S., & Zucker, S. 2011, MNRAS, 411, 1953 Popper, D. M., & Etzel, P. B. 1981, AJ, 86, 102
Queloz, D., Bouchy, F., Moutou, C., et al. 2009, A&A, 506, 303
Rouan, D., Baglin, A., Barge, P., et al. 1999, Phys. Chem. Earth C, 24, 567
Samuel, B., Leconte, J., Rouan, D., et al. 2014, A&A, 563, A103 Sanchis-Ojeda, R., Winn, J. N., Holman, M. J., et al. 2011, ApJ, 733, 127 Seager, S., & Mallén-Ornelas, G. 2003, ApJ, 585, 1038
Selsis, F., Chazelas, B., Bordé, P., et al. 2007, Icarus, 191, 453 Silva, A. V. R. 2003, ApJ, 585, L147
Silva-Valio, A., & Lanza, A. F. 2011, A&A, 529, A36
Silva-Valio, A., Lanza, A. F., Alonso, R., & Barge, P. 2010, A&A, 510, A25
Skrutskie, M. F., Cutri, R. M., Stiening, R., et al. 2006, AJ, 131, 1163 Sozzetti, A., Torres, G., Charbonneau, D., et al. 2007, ApJ, 664, 1190 Tingley, B., Bonomo, A. S., & Deeg, H. J. 2011, ApJ, 726, 112 Torres, G., Andersen, J., & Giménez, A. 2010, A&ARv, 18, 67 Torres, G., Fischer, D. A., Sozzetti, A., et al. 2012, ApJ, 757, 161
Valencia, D. 2011, in IAU Symp. 276, eds. A. Sozzetti, M. G. Lattanzi, & A. P. Boss, 181
Valencia, D., Ikoma, M., Guillot, T., & Nettelmann, N. 2010, A&A, 516, A20
Wagner, F. W., Sohl, F., Hussmann, H., Grott, M., & Rauer, H. 2011, Icarus, 214, 366