SLC26A9 delays diabetes onset in cystic
fibrosis
Anh-Thu N. Lam, … , Scott M. Blackman, Garry R. Cutting
J Clin Invest. 2020;
130(1)
:272-286.
https://doi.org/10.1172/JCI129833
.
Graphical abstract
Research Article
Endocrinology
Genetics
Find the latest version:
Introduction
Cystic fibrosis (CF), one of the most common life-limiting auto-somal recessive disease in the white European population, is caused by deleterious variants in the CF transmembrane con-ductance regulator (CFTR) gene (1). Successful management of disease symptoms and malnutrition have dramatically improved CF life expectancy well into adulthood (2). As individuals with CF live longer, age-dependent complications, such as diabetes, are becoming more prevalent. Although only 2% of children with CF manifest CF-related diabetes (CFRD), approximately 20% of ado-lescents and 50% of adults have this complication and more than 90% of pancreatic-insufficient individuals with CF have CFRD by the approximate age of 50 (3, 4). The development of diabetes is associated with increased morbidity (5) and mortality (3, 4). CFRD has overlapping features with type 1 and type 2 diabetes (T1D and T2D, respectively), but also displays cellular, histological, and clin-ical differences, thereby warranting a separate diagnostic classi-fication (3). Reduced insulin production is observed in both T1D and CFRD; however, CFRD is not associated with the islet auto-immunity that causes T1D (6). Both CFRD and T2D show increases in prevalence with age, a progressive defect in β cell function, and an accumulation of amyloid polypeptide in pancreatic islets (7); in addition, susceptibility genes for T2D also modify CFRD (8). However, in contrast to what occurs in T2D, insulin sensitivity is usually normal in CFRD (3).
Since CFRD results from the progressive decline in insulin secretion, age at onset is an important indicator of the rate of dis-ease progression, as it marks the point at which treatment for dia-betes is initiated (3). Provision of insulin improves lung function, weight, and survival. There is a high degree of variability in age at onset of CFRD, even after accounting for the level of CFTR dys-function (4). Studies of twins and siblings with CF indicated that variants in genes other than CFTR account for most of the variabil-ity in developing CFRD (9). Subsequently, a genome-wide study identified variants 5′ of and within noncoding regions of SLC26A9 that associate with age at onset of CFRD (8). SLC26A9 is a mem-ber of the SLC26 family of anion transporters that functions as a WNK kinase–regulated Cl–/HCO
3
– exchanger and Cl– channel
(and possibly as a Na+-anion cotransporter) (10–14).
Cryoelec-tron microscopy paired with electrophysiologic studies show that murine SLC26A9 forms homodimers that operate as rapid trans-porters of Cl– as opposed to forming ion channels (15).
SLC26A9 has a diverse range of functions in vivo including acid regulation in the gastric parietal cells (16, 17), bicarbonate transport in the intestine (17). and regulation of systemic arterial pressure and chloride excretion in the kidney medullary collecting duct (18). In the lung, SLC26A9 contributes to constitutive chloride secretion in the airway (19) and mucociliary clearance (20). Vari-ants in SLC26A9 have been previously associated with atypical CF-like lung disease and risk for asthma (20, 21) and modulation of airway response to CFTR-directed therapeutics (22, 23). SLC26A9 has been reported to be expressed in epithelial cells of the lung and stomach and multiple other tissues, including salivary gland, heart, skin, kidney, thyroid, and prostate (10, 13, 24–27).
SLC26A9 is a compelling candidate as a modifier of CFRD.
First, in vitro studies have shown that SLC26A9 interacts with Diabetes is a common complication of cystic fibrosis (CF) that affects approximately 20% of adolescents and 40%–50% of
adults with CF. The age at onset of CF-related diabetes (CFRD) (marked by clinical diagnosis and treatment initiation) is an important measure of the disease process. DNA variants associated with age at onset of CFRD reside in and near SLC26A9. Deep sequencing of the SLC26A9 gene in 762 individuals with CF revealed that 2 common DNA haplotypes formed by the risk variants account for the association with diabetes. Single-cell RNA sequencing (scRNA-Seq) indicated that SLC26A9 is predominantly expressed in pancreatic ductal cells and frequently coexpressed with CF transmembrane conductance regulator (CFTR) along with transcription factors that have binding sites 5′ of SLC26A9. These findings were replicated upon reanalysis of scRNA-Seq data from 4 independent studies. DNA fragments derived from the 5′ region of SLC26A9-bearing variants from the low-risk haplotype generated 12%–20% higher levels of expression in PANC-1 and CFPAC-1 cells compared with the high- risk haplotype. Taken together, our findings indicate that an increase in SLC26A9 expression in ductal cells of the pancreas delays the age at onset of diabetes, suggesting a CFTR-agnostic treatment for a major complication of CF.
Increased expression of anion transporter
SLC26A9
delays diabetes onset in cystic fibrosis
Anh-Thu N. Lam,1 Melis A. Aksit,1 Briana Vecchio-Pagan,1,2 Celeste A. Shelton,3,4 Derek L. Osorio,1 Arianna F. Anzmann,1 Loyal A. Goff,1 David C. Whitcomb,3 Scott M. Blackman,1 and Garry R. Cutting1
1McKusick-Nathans Department of Genetic Medicine, Johns Hopkins University School of Medicine, Baltimore, Maryland, USA. 3University of Pittsburgh, Pittsburgh, Pennsylvania, USA. 2Applied Physics
Laboratory, Johns Hopkins University, Laurel, Maryland, USA. 4Ariel Precision Medicine, Pittsburgh, Pennsylvania, USA
Conflict of interest: The authors have declared that no conflict of interest exists.
Copyright: ©2020, American Society for Clinical Investigation.
Submitted: April 30, 2019; Accepted: September 25, 2019; Published: November 25, 2019.
details). For reference, 5 kb was sufficiently large to encompass all CFRD-associated variants in the 5′ region of SLC26A9. Numerous combinations of common variants (minor allele frequency [MAF] > 1%) in intron 1 and 5′ of SLC26A9 were significantly associated with age at onset of CFRD (P < 2.7 × 10–04), but none achieved
greater significance than observed with individual common vari-ants in this region (Figure 1B). Notably, variant combinations that included rs7512462 in intron 5 generated less robust evidence of association than variant combinations in intron 1 and 5′ of
SLC26A9. None of the rare variants or 5 kb windows containing
only rare variants were significantly associated with age at onset of CFRD (Figure 1B). These results show that neither a single com-mon or rare variant nor a combination of physically close variants solely accounts for the association with age at onset of CFRD in this region. Consequently, we tested the effects of association of the naturally occurring combinations of variants (i.e., haplotypes) with age at onset of diabetes.
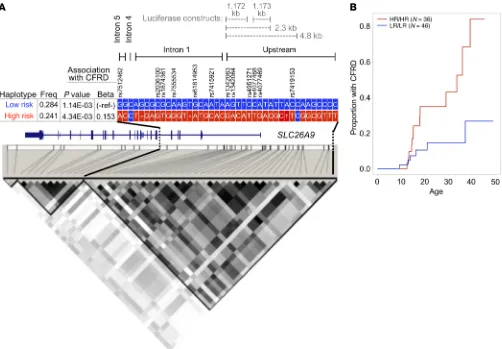
CFRD-associated variants are in linkage disequilibrium and combine into haplotypes that associate with either high risk or low risk of CFRD. The analysis of single and small clusters of variants
suggested that association with CFRD is likely due to multiple variants, possibly distributed over several regions of SLC26A9. To address this concept, we derived the haplotypes formed by common variants (MAF > 15%) for all 762 individuals that were sequenced. Two ancestrally maintained regions (i.e., linkage dis-equilibrium [LD] blocks) defined by a single recombination event between introns 5 and 8 were identified (Figure 2A; note SLC26A9 is on the [–] DNA strand). All CFRD-associated variants located in the region encompassing portions of intron 5 and extending 9.9 kb 5′ of the first exon of SLC26A9 were commonly inherited together (i.e., high LD; D′ > 0.80) (Figure 2A). This LD block has 2 common haplotypes that associated with CFRD; one associated with later onset of CFRD (low risk [LR]; minor haplotype frequency (MHF): 28.4%; P = 1.14 × 10–03), while the second associated with earlier
onset of CFRD (high risk [HR]; MHF: 24.1%; P = 4.34 × 10–03)
(Fig-ure 2A). The LR haplotype contained all the alleles of the variants that associated with later onset of CFRD in the GWAS (8) (labeled with asterisks in Supplemental Figure 1), and the HR haplotype contained all alleles associated with earlier onset of CFRD. The finding that the HR and LR haplotypes were associated with CFRD is based on 594 individuals with phenotype information available, of which 457 have at least 1 HR or LR haplotype and 137 did not. In addition to reporting the significance of the association of the LR and HR haplotypes with age at onset of CFRD, we illustrated the strength of the clinical association in the data set by performing a log-rank test for difference in proportion with CFRD in the 82 individuals carrying either 2 copies of the LR haplotype or 2 copies of the HR haplotype. Using this subset of individuals, we show that the cumulative incidence of CFRD differed significantly between individuals homozygous for the LR haplotype (LR/LR) and those homozygous for the HR haplotype (HR/HR); log rank P = 6.5 × 10–03; Figure 2B). From a clinical perspective, by age 40, more than
80% of individuals with 2 copies of the HR haplotype (HR/HR) have developed CFRD compared with only approximately 25% of LR/LR individuals. A third less common haplotype (HR 2) that shares 11 of the 12 CFRD-associated alleles with the HR haplotype was also associated with earlier age at onset of diabetes (Supple-CFTR via its STAS domain and PDZ-binding motif and that
con-stitutive basal chloride conductance generated by SLC26A9 is regulated by CFTR (13, 19, 28). Second, the CFRD-associated vari-ants in and near SLC26A9 have been shown to modify prenatal exocrine pancreatic damage in CF (assessed by immunotrypsino-gen levels at birth) (29) and to confer risk for CFRD by affecting exocrine pancreatic function (30, 31). Third, these variants have also been associated with risk for neonatal intestinal obstruction (meconium ileus [MI]) in CF (32), a complication that appears to be intimately linked to pancreatic exocrine insufficiency (33).
Elucidating the mechanisms underlying the increasingly prevalent diabetes may be essential for continued improvement in the survival of individuals with CF. Modifiers reveal potential pathways that can be targeted for therapeutic interventions and individualized treatment of CF that can operate beyond dysfunc-tion of the causal gene (34, 35). Importantly, a CFTR-agnostic approach may be needed for diabetes, as CFTR modulators that effect dramatic improvements in lung function have not provided clear evidence of improvement in diabetic status (36–40). In this study, we investigated the genetic architecture and cellular distri-bution of SLC26A9 to inform expression assays. In cell lines that reflect the native environment of SLC26A9 in the pancreas, DNA fragments derived from the 5′ region of SLC26A9 drove reporter gene expression. Importantly, 5′ variants associated with later onset of diabetes generated significantly higher levels of expres-sion (P = 5.15 x 10-09 [PANC-1]; P = 2.00 x 10-03 [CFPAC-1]). When combined, these results imply that increased expression of SLC26A9 delays the onset of diabetes in individuals with CF. Greater understanding of the pathologic mechanism or mecha-nisms provides insight that can inform molecular-based treat-ments to delay or avert onset of diabetes.
Results
CFRD-associated variants in SLC26A9 are common and noncoding.
To evaluate the genetic architecture of SLC26A9, we sequenced 47.7 kb encompassing the SLC26A9 locus (9.9 kb 5′, 30.4 kb gene, and 7.4 kb 3′) in 762 individuals with CF who were homozygous for the common CF-causing variant p.Phe508del (legacy name: F508del) (see Methods for details). The sequenced region com-pletely encompassed the variants 5′ and within SLC26A9 that are significantly associated with age at onset of diabetes (8). Using linear regression of martingale residuals of age at onset of CFRD (Figure 1A), we observed that the variants that achieved signif-icance in the genome-wide study were associated with CFRD in this data set (P < 0.005) (Supplemental Table 1; supplemental material available online with this article; https://doi.org/10.1172/ JCI129833DS1). rs7512462 in intron 5 had the lowest P value; how-ever, a cluster of variants in intron 1 and 5′ of SLC26A9 were also associated with age at onset of CFRD. All CFRD-associated vari-ants were in noncoding regions, either intronic or 5′ of the gene. No individual variant was associated with CFRD by more than an order of magnitude compared with the next most associated vari-ant (Supplemental Table 1 and Figure 1A).
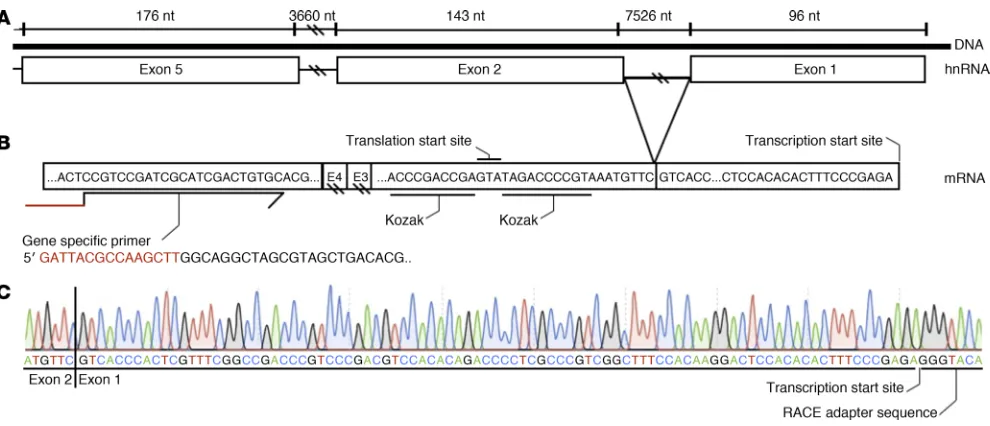
coding, contributing only to the 5′ untranslated sequence mRNA transcripts. As noncoding 5′ exons can play a role in temporal or spatial gene expression (10), the location of the CFRD-associated variants upstream and downstream of exon 1 suggested that they may influence SLC26A9 expression. However, alternative splicing of the 5′ end of SLC26A9 leading to exclusion of exon 1 has been reported by the Human and Vertebrate Analysis and Annotation (HAVANA) project (http://useast.ensembl.org/Homo_sapiens/ Gene/Summary?db=core;g=ENSG00000174502). Furthermore, the transcription start site (TSS) of SLC26A9 has only been mapped in RNA from human lung. Therefore, we sought to deter-mine whether SLC26A9 transcripts in additional tissues relevant to CF contained noncoding exon 1 and if so, the exact location of the TSS using 5′ Rapid Amplification of cDNA Ends (RACE). 5′ RACE products from 3 unrelated human lung samples (5, 16, and 8 transcripts, respectively), 1 human stomach sample (3 tran-scripts), and 1 human pancreas sample (2 transcripts) confirmed that SLC26A9 mRNA transcripts contain exon 1 and that the TSS map in all 3 tissues to chr1:205,912,584 (hg19) (Figure 3). The major TSS is 4 nucleotides 3′ relative to a previously reported TSS (10). The sequencing traces were contiguous across 4 exon/exon junctions, confirming that amplification was from an mRNA tran-script. Four 5′ RACE transcripts from 1 of the 3 lung samples had an alternative TSS beginning at position chr1:205,912,548 (hg19), which is 56 nucleotides upstream of the exon1/exon 2 junction. It is not clear whether this is a minor TSS or the result of incomplete extension of the 5′ RACE. The establishment of the TSS confirmed that the first exon of the SLC26A9 gene is embedded within the variants that form the CFRD risk haplotypes.
Regulatory regions in the 5′ region and first intron of SLC26A9.
The region 5′ of the major TSS contains a TATA (TATAAAC) box 29 bp upstream as well as a CCATT (GCCAATC) box 77 bp upstream. In addition, the region encompassing exon 1 and extending approximately 550 bp upstream was highly conserved across species (Figure 4). These features are attributes of a basal promoter. To search for potential regulatory regions encompass-ing exon 1 of SLC26A9, we used the Open Regulatory Annota-tion (ORegAnno) database track on the UCSC genome browser, which contains curated regulatory annotation derived from exper-imental data (41) (Figure 4). General binding sequences (GBSs) that interact with transcription factors (TFs) GATA3, NFYA, and NFYB were mapped to the immediate 5′ region (Figure 4). While the CFRD-associated variant rs1342063 falls within a TF cluster in this region, it does not affect any consensus TF-binding motif according to the JASPAR core database (42). Also present 5′ of exon 1 are GBSs that interact with FOS, JUNB, JUND, and FOSL2 as well as MAFF, MAFK, TFAP2C, FOXA1, GATA3, and TFAP2A (Figure 4). In intron 1, GBSs that interact with FOXA1, STAT1, SP1, USF2, TFAP2C, and MAX have been mapped. CFRD-associated variant rs7555534 in intron 1 falls within the GBS of TFAP2C and FOXA1, but it does not alter any consensus binding motifs for the TFs according to the JASPAR core database (42). The location of ENCODE regulatory regions 5 kb upstream of exon 1 and within the first intron suggests that CFRD risk haplotypes influence the expression of SLC26A9.
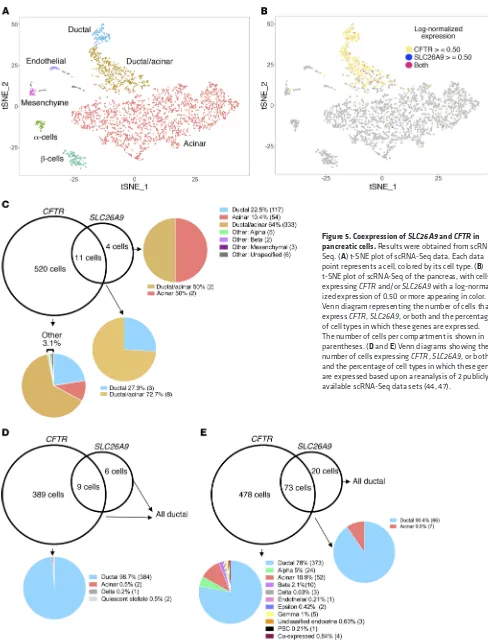
SLC26A9 and CFTR are coexpressed in a discrete population of pancreatic cells with ductal characteristics. To assess which
pancre-mental Figure 1). These analyses indicated that the SLC26A9 vari-ants operate in concert to modify age at onset of diabetes in CF.
SLC26A9 mRNA transcripts from pancreas, lung, and stomach contain noncoding exon 1. Exon 1 of SLC26A9 is predicted to be
non-Figure 1. Association of SLC26A9 variants with age at onset of CFRD in 762 p.Phe508del (F508del) homozygous individuals. Variants within a 47.7 kb region encompassing SLC26A9 (shown to scale at bottom) were tested. (A) Manhattan plot for association with CFRD (points, left y axis) and recombination ratio plotted by genomic location (blue line, right y axis). (B) SKAT-O test for association of sets of common (upper panel) and rare (lower panel) variants with CFRD. All variants within each 5 kb window, moved across the entire region in increments of 1250 bp, were tested for a combined association with CFRD via the SKAT-O test. The x axis denotes position on chromosome 1 (hg19), y axis shows −log10 of the regional P value. Association values were plotted at the center of each 5 kb window. Common and rare variants were assigned based on a MAF cut-off of 1%. Red line indicates significance threshold Bonferroni’s corrected for the number of sliding windows (P = 0.01/36 = 2.7 × 10⁻⁴). No other RefSeq
[image:4.585.34.284.59.508.2]that the coexpressing cells were primarily ductal (Figure 5, D and E). The fraction of ductal cells that expressed CFTR ranged from 35.7% to 96.9% across studies. SLC26A9 expression was detected in a lower fraction of ductal cells, ranging from 1.4% to 17%. This variation likely reflects the different pancreatic tissue sampling approaches in the 3 studies, as illustrated by their differences in cellular composition (Supplemental Table 2). While CFTR was expressed at relatively high levels in a fraction of ductal cells, both
CFTR and SLC26A9 demonstrated variable expression among
acinar and acinar/ductal cells in our sample (Supplemental Fig-ure 2). It is important to mention that the coexpression of CFTR and SLC26A9 is not merely due to the broad presence of CFTR in ductal cells and presence of SLC26A9 in the same cell type. The hypergeometric test showed that the cooccurrence of both tran-scripts in the same cells was highly significant (P values ranges between 1.27 x 10-03 to 3.16 x 10⁻³⁴) (Table 2) given the distribution
of the 2 genes across all pancreatic cell types. Of note, CFTR RNA expression was very low in β cells (2/531 CFTR-expressing cells are β cells) while prominently transcribed in ductal cells (Table 2). atic cell types express SLC26A9 and whether it is coexpressed with
CFTR, we conducted single-cell RNA–Sequencing (scRNA-Seq)
of the pancreas obtained from a pediatric individual with early chronic pancreatitis in the absence of CF. Using the Seurat pipe-line (43), we were able to identify all major pancreatic cell types in addition to a cell type that contained characteristics of ductal and acinar cells (ductal/acinar; Figure 5A). Of the 2999 pancreatic single cells, CFTR was expressed in 531 cells (86.5% ductal and ductal/acinar), SLC26A9 was expressed in 15 cells, and 11 cells expressed both SLC26A9 and CFTR (100% ductal and ductal/ acinar; hypergeometric test for coexpression, P = 2.31 × 10–07)
[image:5.585.46.548.54.403.2](Fig-ure 5, B and C, and Table 1). Reanalysis of scRNA-Seq data from 4 studies containing a total of 27 pancreatic samples obtained from individuals of varying age and disease status (4 adults, ref. 44; 4 healthy adults, 1 T1D adult, 3 T2D adults, 2 healthy children. ref. 45; 4 adults, ref. 46; and 6 healthy and 4 T2D donors of vary-ing BMI and age, ref. 47) revealed that CFTR and SLC26A9 were coexpressed in a small subset of ductal pancreatic cells in each data set (Table 2). Data from 2 studies (44, 47) also confirmed
on genes encoding proteins that have been detected in pan-creatic ductal cells by biochemical and electrophysiological methods (50–52). We also examined the expression of selected genes relevant to SLC26A9 and CFTR (e.g.,WNK family and
FOXI1+). Our analysis revealed that cells expressing CFTR and
SLC26A9 also consistently expressed Aquaporin 1 (AQP1) and SLC4A4 (NBCe1-B) in our scRNA-Seq study and the 4 publicly
available data sets (Supplemental Table 3). In most stud-ies, SCNN1A (ENaC α subunit), SLC4A2 (AE2) and activators (STK39 [SPAK] and WNK1) appeared to be expressed in duc-tal cells that coexpressed SLC26A9 and CFTR. Notably absent (or very minimally expressed) were WNK4 and other SLC26 transporters (A3, A4, and A6). We did not find evidence of a cell population that expressed high levels of CFTR along with FOXI1+ or vATPase genes (ATP6V1C2 and ATP6V0D2).
The expression of abundant CFTR along with FOXI1+ and vATPase characterizes ionocytes reported in the lung (53, 54).
DNA fragments 5′ of SLC26A9 bearing CFRD LR haplotype generate higher levels of reporter gene expression than HR CFRD hap-lotype. To determine whether the region containing the diabetes-
associated variants drives expression at different levels in the pan-creas, 4 DNA fragments from the 5′ region of SLC26A9 (Figure 6A) containing either HR or LR variants were cloned into a firefly luciferase reporter construct (pGL4.10, Promega) in the native ori-entation (SLC26A9 resides on the negative strand). All SLC26A9 constructs were tested in the PANC-1 cell line, a human pancre-atic adenocarcinoma cell line that is of ductal cell origin (55), but also is a surrogate for pancreatic progenitor cells, since they can be induced to differentiate into insulin-producing cells (56). A renilla construct (pRL-TK, Promega) was included to normalize for This finding was consistent with our reanalysis of data from other
studies (10/478 [ref. 47] 0/389 [ref. 44] of CFTR-expressing cells were β cells) (Figure 5, D and E) and with reanalyses reported by other groups (48, 49).
We next determined whether pancreatic cells that express
SLC26A9 also express the TFs that have binding sites
surround-ing exon 1 (Figure 4). FOS, JUNB, and JUND transcripts were broadly expressed and found in the majority of cells expressing
SLC26A9 (Table 1). At the other end of the spectrum, FOXA1, TFAP2C, GATA3, and TFAP2A transcripts were not detected in
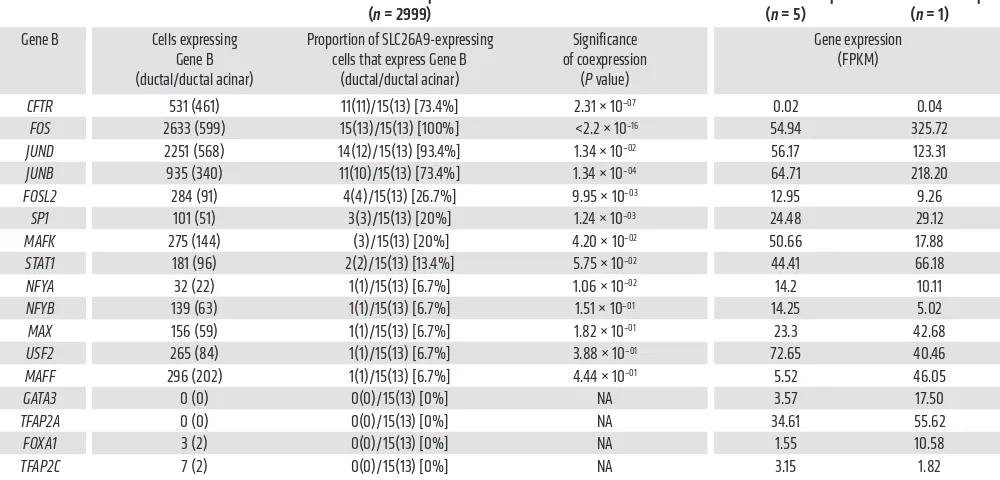
cells expressing SLC26A9 in our pancreatic sample. Of the TFs expressed in fewer cells (32 to 296 out of 2999 cells), FOSL2, SP1, and MAFK were coexpressed in a small but significant fraction of SLC26A9-expressing cells (Table 1). Reanalysis of 4 published pancreatic scRNA-Seq data sets (44–47) revealed similar patterns, with FOS, JUNB, and JUND being broadly expressed and found in the majority of SLC26A9-expressing ductal cells,while FOSL2 and
SP1 were expressed in fewer cells, but significantly coexpressed
with SLC26A9 (Table 2) (44–47). Furthermore, FOXA1, TFAP2C,
GATA3, and TFAP2A TFs were either absent or present in only a
few cells that expressed SLC26A9. One notable difference from our scRNA-Seq data was that MAFF was present in a relatively high fraction of SLC26A9-expressing cells in all 4 published data sets. From these results, we noted that binding sequences of the 4 TFs consistently present in SLC26A9-expressing cells (FOS, JUNB,
JUND, and FOSL2) occurred in a cluster 5′ of exon 1 (Figure 4).
To characterize the pancreatic ductal cells that express
SLC26A9, we evaluated expression of apical and/or basolateral
[image:6.585.43.538.52.265.2]channels and bicarbonate transporters using our scRNA-Seq data and the 4 publicly available data sets. We focused our search
transfection efficiency. Analysis of RNA-Seq data available on the sequence read archive demonstrated that PANC-1 cells express TFs
FOS, JUNB, JUND, and FOSL2 that have putative binding sites in
the 5′ region of SLC26A9 (Table 1). Both SLC26A9 and CFTR were expressed in PANC-1 cells, albeit at low levels relative to the afore-mentioned TFs (Table 1), likely due to inactivation of their promot-ers, as observed in other immortalized cell lines (57).
The 1.172 kb DNA fragment immediately adjacent to exon 1 generated robust luciferase expression consistent with our expecta-tion that this region encompassed the basal promoter of SLC26A9. Although 2 CFRD-associated variants are in this region, no dif-ferences in expression levels were noted when DNA fragments bearing the LR or HR alleles were analyzed (Figure 6B). We next examined the region immediately adjacent and upstream of the 1.172 kb region that contained 3 CFRD-associated variants. Con-structs containing the 1.173 kb region displayed little to no luciferase expression, similar to negative controls (Figure 6B). However, when fused to the 1.172 kb region to form a contiguous 2.3 kb fragment, we noted that 3 out of the 4 LR 2.3 kb clones consistently differed in luciferase expression levels from clones with HR alleles (Figure 6B). Combined analysis of the normalized data from 3 independent transfections with 4 biological clones per haplotype (technical repli-cates: transfection well n = 71 for LR and n = 72 for HR; Supplemen-tal Figure 3) revealed that the fragment containing variants associ-ated with LR of diabetes had a difference in means of 12% higher activity compared with HR (P = 5.15 × 10–09). Addition of 2.5 kb of
sequence from the region immediately adjacent and upstream of the 2.3 kb regions formed a 4.8 kb fragment containing all 6 of the CFRD-associated variants residing 5′ of SLC26A9. Notably, both clones bearing the LR haplotype generated an overall difference in means of 19% higher expression levels compared with clones bear-ing the HR haplotype (P = 6.28 × 10–07) (Figure 6B).
We also tested the 2.3 kb LR and HR constructs in a second cell line, CFPAC-1, a pancreatic ductal adenocarcinoma cell line derived from an individual with CF (58, 59). CFPAC-1 cells express TFs FOS, JUNB, JUND, and FOSL2 and have very low levels of endogenous CFTR and SLC26A9 expression, as noted for PANC-1 cells (Table 1). LR constructs demonstrated significantly higher expression than HR constructs in 2 independent transfections of 4 clones per construct (Figure 6C). Overall, LR exhibited 20% higher expression than HR (P = 2.00 × 10–03, n = 48 for LR, n = 47 for HR)
in CFPAC-1 cells. From these results, we concluded that CFRD- associated variants in the 5′ region act in concert with its basal pro-moter to alter the expression of SLC26A9 in pancreatic cells.
eQTL analysis suggests that LR alleles of CFRD variants are associated with increased expression of SLC26A9. We downloaded
publicly available data from the Genotype-Tissue Expression (GTEx, version 7) portal to determine whether the CFRD risk variants associate with SLC26A9 RNA expression in the pancreas. Results showed that the CFRD-associated variants associated with SLC26A9 RNA expression in the pancreas. Alleles on the LR haplotype were associated with increased expression of SLC26A9 in the pancreas, but it did not correlate with expression in the lung (Supplemental Table 4), as recently reported (31).
Discussion
The goal of this study was to determine whether variants asso-ciated with age at onset of CFRD affected the expression of
SLC26A9. We discovered that the alleles of the CFRD-risk
[image:7.585.48.553.56.281.2]from 3 different tissues (pancreas, lung, and stomach) confirmed that the full-length transcript had been obtained. As the previously reported TSS was also determined using RNA from the lung, the inconsistency between the major TSS we found and the previously reported TSS (4 base pairs longer; ref. 10) was likely due to techni-cal reasons. Placement of the TSS upstream of exon 2 verifies inclu-sion of a noncoding first exon in the majority of SLC26A9 tran-scripts. Noncoding first exons have been generally thought to fulfill regulatory roles in gene expression (e.g., by controlling translation efficiency and mRNA stability). This control may occur through the primary sequence of the 5′ UTR as well as the secondary structure of the RNA. The latter governs the recognition and interaction with a combination of factors important for translation and stability (60, 61). However, we did not discover any variants in the 5′ UTR of SLC26A9 encoded by exon 1 that might be postulated to affect transcript stability, leading us to focus on upstream sequences.
To assess the appropriate cellular context for evaluating the putative regulatory regions and the effect of the CFRD-associated variants, we established the pancreatic cell types that express
SLC26A9. scRNA-Seq revealed that SLC26A9 is expressed in a
minor fraction of ductal cells. Since our study was performed on a single pediatric chronic pancreatitis case, we confirmed and extended our findings using scRNA-Seq data from 4 additional publicly available studies of 31 pancreas tissues from children and adults (44–47). We were not able to evaluate the expression profile of SLC26A9 during development, when exocrine pancreatic dam-majority of the CFRD-risk variants also correlate with CFRD, but
are not sufficiently frequent to allow detection of association in the 762 individuals studied here. There was no evidence that a coding or rare variant accounted for the CFRD association. Map-ping of the major TSS indicated that the noncoding first exon of
SLC26A9 was placed in the middle of the cluster of CFRD-risk
variants in the 5′ region of SLC26A9. These results suggested that the HR and LR CFRD haplotypes affect transcriptional regulation of SLC26A9. Characterization of the TF-binding sites 5′ of exon 1 and profiling of the transcriptome of the ductal pancreatic cells that express SLC26A9 indicated that the TFs FOS and JUN likely direct SLC26A9 expression. DNA fragments derived from the 5′
region of SLC26A9 were transcriptionally active in pancreatic ductal cell line models (PANC-1 and CFPAC-1) that express FOS and JUN TFs. Reporter assays showed that the presence of vari-ants corresponding to the LR haplotype showed 12%–20% higher levels of expression compared with the HR haplotype in both pan-creatic ductal cell lines. The CFPAC-1 cell line demonstrated that absence of CFTR (as seen in CF) did not alter the difference in expression between the LR and HR constructs. Collectively, our findings indicate that an increase in the expression of SLC26A9 in ductal cells of the pancreas delays the age at onset of diabetes in individuals with CF.
[image:9.585.45.545.92.332.2]Locating the 5′ TSS was essential to establishing whether the noncoding exon 1 was included in SLC26A9 RNA transcripts. Map-ping to the same nucleotide in multiple independent transcripts
Table 1. Expression of TFs and CFTR in the pancreas PANC-1 and CFPAC-1 cells.
scRNA-Seq
(n = 2999) PANC-1 RNA-seq (n= 5) CFPAC-1 RNA-Seq (n= 1)
Gene B Cells expressing
Gene B (ductal/ductal acinar)
Proportion of SLC26A9-expressing cells that express Gene B
(ductal/ductal acinar)
Significance of coexpression
(P value)
Gene expression (FPKM)
CFTR 531 (461) 11(11)/15(13) [73.4%] 2.31 × 10–07 0.02 0.04
FOS 2633 (599) 15(13)/15(13) [100%] <2.2 × 10⁻¹⁶ 54.94 325.72
JUND 2251 (568) 14(12)/15(13) [93.4%] 1.34 × 10–02 56.17 123.31
JUNB 935 (340) 11(10)/15(13) [73.4%] 1.34 × 10–04 64.71 218.20
FOSL2 284 (91) 4(4)/15(13) [26.7%] 9.95 × 10–03 12.95 9.26
SP1 101 (51) 3(3)/15(13) [20%] 1.24 × 10–03 24.48 29.12
MAFK 275 (144) (3)/15(13) [20%] 4.20 × 10–02 50.66 17.88
STAT1 181 (96) 2(2)/15(13) [13.4%] 5.75 × 10–02 44.41 66.18
NFYA 32 (22) 1(1)/15(13) [6.7%] 1.06 × 10–02 14.2 10.11
NFYB 139 (63) 1(1)/15(13) [6.7%] 1.51 × 10–01 14.25 5.02
MAX 156 (59) 1(1)/15(13) [6.7%] 1.82 × 10–01 23.3 42.68
USF2 265 (84) 1(1)/15(13) [6.7%] 3.88 × 10–01 72.65 40.46
MAFF 296 (202) 1(1)/15(13) [6.7%] 4.44 × 10–01 5.52 46.05
GATA3 0 (0) 0(0)/15(13) [0%] NA 3.57 17.50
TFAP2A 0 (0) 0(0)/15(13) [0%] NA 34.61 55.62
FOXA1 3 (2) 0(0)/15(13) [0%] NA 1.55 10.58
TFAP2C 7 (2) 0(0)/15(13) [0%] NA 3.15 1.82
Table 2. SL C26A9 and relevant gene expression in pancreatic cells. GSE84 133 ( n = 856 9) GSE8 313 9 ( n = 635) GSE85 24 1 ( n = 30 72) E-MT AB -506 1 ( n = 2209 ) Gene B Cells e xpres sing
Gene B (duct
al) Pr opor tion o f SL C26A9-expres sing c ells that e xpres s Gene B ( duct al) [ % ] Significanc e o f coe xpres sion ( P value ) Cells e xpres sing Gene B Pr opor tion of SL C26A9-expres sing c ells that e xpres s
Gene B [
% ] Significanc e o f coe xpres sion ( P value ) Cells e xpres sing Gene B Pr opor tion of SL C26A9-expres sing c ells that e xpres s
Gene B [
% ] Significanc e o f coe xpres sion ( P value ) Cells e xpres sing
Gene B (duct
al) Pr opor tion of SL C26A9-expres sing c ells that e xpres s
Gene B [
% ] Significanc e o f coe xpres sion ( P value ) CFTR 38 9 ( 38 4) 9 (9 )/ 15 ( 15 ) [6 0%] 1.0
2 × 10
–2 3 348 16 /19 [8 4. 3% ] 1.2
7 × 10
–03 604 28 /34 [82. 4% ]
1.92 × 10
–1 6 47 8 ( 37 3) 73 ( 66 )/ 93 ( 66 ) [7 8. 5%]
3.16 × 10
–3 4 FO S 38 55 ( 591) 13 ( 13)/ 15 ( 15 ) [86.7% ]
2.53 × 10
–03 61 3 19 /19 [ 100% ]
< 2.2 × 10
–1 6 18 48 24/34 [ 70 .6% ]
7.46 × 10
–02 1215 ( 244 ) 61 ( 37 )/ 93 ( 66 ) [6 5.6% ] 1.3
1 × 10
–02 JUND 535 4 ( 768 ) 11 ( 11)/ 15 ( 15 ) [73 .3 %]
2.26 × 10
–02 61 8 19 /19 [ 100% ]
< 2.2 × 10
–1 6 18 51 27 /34 [ 79 .5% ] 4.9
7 × 10
–03 175 2 ( 32 7) 86 ( 60 )/ 93 ( 66 ) 92.5% ]
1.08 × 10
–04 JUNB 5300 ( 844 ) 11 ( 11)/ 15 ( 15 ) [73 .3 %] 4.9
7 × 10
–01 465 10 /19 [5 2.7% ] 9.5
9 × 10
–01 18 48 25 /34 [ 73 .6% ]
3.47 × 10
–02 1660 ( 330 ) 78 ( 56 )/ 93 ( 66 ) [8 3.9% ] 1.4
1 × 10
–02 FOSL2 95 4 ( 27 8) 5 ( 5)/ 15 ( 15 ) [33 .3% ]
2.33 × 10
–04 103 5/ 19 [ 26. 4% ]
7.09 × 10
–02 51 4 19 /34 [55.9% ]
2.90 × 10
–08 37 2 ( 206 ) 57 ( 42)/ 93 ( 66 ) [6 1.3 %]
5.29 × 10
–24 SP1 168 ( 53) 0 ( 0)/ 15 ( 15 ) [0% ] NA 390 16 /19 [8 4. 3% ]
6.96 × 10
–03 138 1 30 /34 [88 .3% ]
1.58 × 10
–08 823 ( 213) 61 ( 45 )/ 93 ( 66 ) [6 5.6% ] 4.0
7 × 10
–09 MAFK 25 7 ( 10 2) 2 ( 2)/ 15 ( 15 ) [13 .3 %]
2.25 × 10
–02 133 6/ 19 [ 31.6% ] 8.0
2 × 10
–02 28 0/34 [0% ] NA 123 ( 41) 11 (9 )/ 93 ( 66 ) [11 .8 %]
4.53 × 10
–03 ST AT 1 62 4 ( 101) 2 ( 2)/ 15 ( 15 ) [13 .3 %]
1.40 × 10
–02 457 15 /19 ( 78 .9% ) 1.7
3 × 10
–01 187 3 32/34 [94 .1% ] 1.0
2 × 10
–06 15 11 ( 326 ) 77 ( 58 )/ 93 ( 66 ) [82. 8% ] 4.
36 × 10
–04 NF YA 51 ( 16 ) 0 ( 0)/ 15 ( 15 ) [0% ] NA 285 8/ 19 [ 42.2% ] 5.0
2 × 10
–0 770 22/34 [ 64 .8% ] 1.7
8 × 10
–07 704 ( 200 ) 56 ( 43)/ 93 ( 66 ) [60 .2% ]
2.35 × 10
–09 NF YB 16 5 ( 17 ) 0 ( 0)/ 15 ( 15 ) [0% ] NA 261 5/ 19 [ 26. 4%]
8.64 × 10
–01 923 20 /34 [58 .9% ] 1.1
7 × 10
–04 863 ( 196 ) 58 ( 44 )/ 93 ( 66 ) [62. 4%]
1.05 × 10
–06 MA X 555 ( 70 ) 1 ( 1)/ 15 ( 15 ) [6.7% ] 9.
82 × 10
–01 24 3 6/ 19 [ 31.6% ] 6.
38 × 10
–01 15 16 23 /34 [ 67 .7% ]
9.63 × 10
–03 13 14 ( 294 ) 77 ( 56 )/ 93 ( 66 ) [82. 8% ]
2.14 × 10
–07 USF2 1339 ( 132) 2 ( 2)/ 15 ( 15 ) [13 .3 %]
5.42 × 10
–01 226 7/ 19 [ 36.9% ]
3.53 × 10
–01 718 9/34 [ 26.5% ] 2.5
7 × 10
–01 130 2 ( 196 ) 45 ( 27 )/ 93 ( 66 ) [4 8. 4%]
9.77 × 10
–01 MAFF 595 ( 264 ) 3 ( 3)/ 15 ( 15 ) [20% ]
9.77 × 10
–06 147 9/ 19 [ 47 .4% ] 4.
37 × 10
–03 602 16 /34 [ 47 .1% ] 6.
14 × 10
–05 471 ( 17 4) 33 ( 30 )/ 93 ( 66 ) [35.5% ]
4.14 × 10
–04 GA TA3 1 (0) 0 ( 0)/ 15 ( 15 ) [0% ] NA 2 0/ 19 [0% ] NA 8 1/34 [ 3%]
3.19 × 10
–03 8 ( 3) 1 ( 1)/ 93 ( 66 ) [1. 1%]
4.16 × 10
–02 TF AP2A 11 ( 10 ) 0 ( 0)/ 15 ( 15 ) [0% ] NA 9 2/ 19 [ 10 .6% ]
1.71 × 10
–03 41 5/34 [ 14 .8% ]
3.95 × 10
–06 67 ( 46 ) 9 ( 7)/ 93 ( 66 ) [9 .7% ] 3.6
5 × 10
–04 FO XA1 10 ( 5) 0 ( 0)/ 15 ( 15 ) [0% ] NA 21 0/ 19 [0% ] NA 94 4/34 [ 11. 8% ] 3.
32 × 10
–03 37 ( 10 ) 4 ( 3)/ 93 ( 66 ) [4. 3% ] 1.7
8 × 10
–02 TF AP2C 4 ( 1) 0 ( 0)/ 15 ( 15 ) 0% ] NA 10 1/ 19 [5. 3% ] 3.
31 × 10
–02 56 4/34 [ 11. 8% ]
3.12 × 10
–04 31 ( 15 ) 9 ( 7)/ 93 ( 66 ) [9 .7% ]
2.30 × 10
–07
R
esults wer
e derived from 4 scRNA
-S
eq data sets inv
olving 3
1 subjects downloaded from the gene e
xpr
ession omnibus r
eposit
or
y (
acc
ession numbers GSE84
133, GSE8
3139
, GSE852
41) and the Arr
ayE xpr ess (EBI) (E -MT AB-506
1). Number of c
ells e
xpr
essing r
espective genes ar
e listed, with the number of ductal c
ells e
xpr
essing that gene listed in par
entheses. Fr
action of c
ells c oe xpr essing SL C26A9 and r espective gene ar
e shown in br
ack
ets. C
ells wer
e determined t
o e
xpr
ess r
espective gene f
or gene c
ount gr
eater than 1. Significanc
e of the c
ooccurr
enc
e of 2 genes w
as determined with a hypergeometric test. NA
indicates that a significanc
e test w
Figure 6. Reporter gene expression driven by DNA fragments derived from the 5′ region of SLC26A9. (A) Diagram depicting the location and length of the regions studied relative to SLC26A9. (B) Luciferase expression levels obtained from PANC-1 cells transfected with various SLC26A9 DNA fragments bearing either LR or HR variants for CFRD. The 1.172 kb region generated robust expression of luciferase consistent with a promoter. Levels do not differ between the LR and HR bearing fragments. The 1.173 kb region generated little to no activity, similar to negative controls. The 2.3 kb region composed of the 1.172 kb and 1.173 kb regions generated a combined expression of luciferase that was 12% higher for LR compared with HR haplotype (P = 5.15 × 10–09). The 4.8 kb region generated a
combined 19% higher expression level compared with HR (P = 6.28 × 10–07). (C) Transfections in CFPAC-1 cells resulted in the same trend being observed. The 2.3
kb region drove a combined expression of luciferase that was 20% higher for LR compared with HR haplotype (P = 2.00 × 10–03). For plots in B and C, results are
Based on crowd-sourced assessments provided in the OReg-Anno database, we suspected that the cluster of TF-binding sites for FOS, JUNB, JUND, and FOSL2 act as enhancers for SLC26A9 expression. This assertion was supported by the observation that the DNA fragment containing these putative binding sites drives expression only when fused to the native SLC26A9 promoter (2.3 kb fragment). Members of the FOS and JUN family are well known as dimerizing via leucine zippers to create the AP-1 TF complex (75). AP-1 activity has been implicated in a variety of normal cellu-lar functions, such as proliferation, differentiation, and apoptosis as well as abnormal processes, in particular, neoplastic transfor-mation (76). Thus, the expression of FOS and JUN in a cancer cell line such as the pancreatic adenocarcinoma (PANC-1) cell line used in our studies is expected. However, we posit that these TFs have a physiologic role in SLC26A9 expression, as RNAs encod-ing these TFs are consistently expressed in the subset of ductal cells that express SLC26A9 (44–46). Furthermore, we observed that the SLC26A9 2.3 kb construct was expressed in the CFPAC-1 cells, a pancreatic adenocarcinoma cell line derived from an indi-vidual with CF (58, 59). FOS TFs have been implicated in diabetes and glucose homeostasis. Computational analysis has suggested that FOS plays a role in the pathogenesis of T2D (77), and FOSL2 in T2D individuals has been shown to be hypermethylated, lead-ing to lower mRNA and protein expression levels (78). Finally, we observed that TFs FOXA1, TFAP2A and 2C, and GATA3, which are known to be associated with type 2 diabetes risk (79), devel-opment, and subsequent maintenance of β cells (80) and insulin secretion (81), were absent in SLC26A9-expressing pancreatic cells in our study and in 2 of the 4 published studies (44, 45). The absence of these TFs likely explains why the 4.8 kb fragment containing the 2.5 kb region (which has binding sites for FOXA1, TFAP2A and 2C, and GATA3) displayed a similar level of reporter expression and maintained the allele-dependent expression observed with the 2.3 kb fragment. Together, these findings sup-port a role for FOS and JUN in the transcriptional regulation of
SLC26A9 in the postnatal pancreas.
Age at onset of diabetes in CF is a complex trait modified by multiple genes that develops over the lifetime of individuals with CF (8). As such, the approximately 20% difference between the expression level of LR and HR haplotypes in PANC-1 and CFPAC-1 cells is consistent with the modest effect size attributable to a gene operating in the context of a complex disorder (35, 82). Indeed, more substantial changes in SLC26A9 expression cause distinct intestinal and pulmonary phenotypes in KO mouse models (17, 20). Although we have not yet been able to determine the pre-cise element or elements that are responsible for the difference observed between LR and HR haplotypes, this information is not essential for moving forward with a strategy to treat CFRD. There is growing evidence that provision of alternative pathways for chloride transport via channels such as TMEM16A (83) or small molecule ion channels (84) can restore anion secretion in CF tis-sues. Likewise, several studies suggest that SLC26A9, a chloride/ bicarbonate transporter, may be able to compensate for the loss of CFTR function in individuals with CF (15, 85, 86). Consequently, our results indicate that strategies that increase the level and/or function of SLC26A9 provide a viable approach to delaying the onset of diabetes in CF.
age first occurs in individuals with CF. This is likely to be relevant, as observations in mice indicate that SLC26A9 expression is consider-ably higher in utero and decreases shortly after birth (22). Notconsider-ably,
CFTR is present in the majority of the pancreatic cells that express SLC26A9 and 100% of the cells expressing both genes are ductal
or ductal/acinar. Evidence of coexpression supports the concept that SLC26A9 and CFTR interact in vivo, as suggested by in vitro and cell-based studies (13, 19, 62). We have further evaluated the expression level of key genes in the WNK pathway whose proteins regulate SLC26A9 activity. Among the 5 scRNA-Seq studies, there was evidence of WNK1 and STK39 (SPAK) being expressed in cells with SLC26A9 while WNK4 was almost absent.
How could variation in SLC26A9 expression in a small sub-set of ductal cells affect risk for diabetes in CF? First, it has been shown that transcript copy number correlates modestly with protein concentration (63). Thus, SLC26A9 protein levels might be considerably higher in ductal cells than the levels implied by counts of the RNA transcript. Second, it is possible that the
SLC26A9-expressing cells play a critical role in ductal ion
trans-port, perhaps by being anatomically clustered in one portion of the pancreatic duct. This situation might be analogous to that of ionocytes in the lung, a rare cell type that expresses high levels of
CFTR (53, 54). We did not, however, consistently observe
expres-sion of FOXI1+ or vATPase genes (ATP6V1C2 and ATP6V0D2) that characterize ionocytes in the SLC26A9/CFTR-coexpressed pancreatic cells (Supplemental Table 3). Third, the cells that express SLC26A9 may have other key roles in the pancreas, such as that reported for centroacinar cells (CACs), a specialized ductal cell type found near acini that express CFTR in fetal and adult pancreas (64, 65) that can replenish β cells in zebrafish and mammals (64, 66, 67).
highly variable genes (default parameters, except dispersion selection method), perform principal component analysis (with n = 1000 highly variable genes), and determine significant principal components. The t-SNE projection was generated with the first 12 principal components. Graph-based clustering with K-nearest neighbor was used to predict cell populations. Cell-specific expression markers identified from previous single-cell papers (46) were then used to define and divide
predicted clusters: acinar (PRSS1, PNLIP), β (INS), α (GCG), δ (SST),
PP (PPY), ductal (KRT19, SPP1, ATP1B, SLC4A4), endothelial (ESAM), and mesenchyme (THY1, COL1A1).
Reanalysis of published scRNA-Seq of the pancreas. scRNA-Seq of the pancreas conducted by the studies referenced in Table 2 were reana-lyzed. Data were downloaded from the NCBI’s Gene Expression Omni-bus database (GEO GSE84133, GSE83139, GSE85241) and EMBL-EBI’s ArrayExpress (E-MTAB-5061) and analyzed in R. Significance of coexpression was determined with a hypergeometric test, using the phyper function (phyper [number of cells coexpressing SLC26A9 and gene B, number of cells expressing SLC26A9, number of cells that don’t express SLC26A9, number of cells expressing CFTR]). Expression of a gene was defined by having a gene count of more than 1 for data down-loaded from the GEO repository and a log-normalized gene count of more than 0.5 for our data.
Reanalysis of publicly available RNA-Seq data of PANC-1 and CFPAC-1 cells. RNA-Seq data available in the NCBI’s Sequence Read Archive were used (SRA BioProject SRR5171012, SRR5171013, SRR1172002, SRR3615309, SRR5952226; CFPAC-1: SRR1736491). Raw reads were aligned to the reference genome (hg19) using the Bowtie2 algorithm (91), and splice junctions were identified via Tophat2 (version 2.0.13) (92) from the Tuxedo software suite. CuffQuant and Cuffdiff (Cufflinks, version 2.2.1) (93) were then used to assemble transcripts, estimate their abundances, and test for differential expression among samples.
Mammalian cell culture, transfection, and dual luciferase-renilla reporter assay. PANC-1 cells were maintained in DMEM (Invitrogen) supplemented with 10% v/v FBS and 1% penicillin-steptomycin (PS). CFPAC-1 cells were maintained in IMDM (Thermo Fisher Scientific), also supplemented with 10% v/v FBS and 1% PS. When PANC-1s/ CFPAC-1s were approaching 70%–80% confluency, they were trans-fected with LR or HR reporter plasmids (Supplemental Figure 2) with Lipofectamine 2000 (Invitrogen) according to the manufacturer’s instructions and then placed in antibiotic-free medium/FBS for 48 hours. As transfection and expression efficiency can vary due to the structure of the plasmids (e.g. coiled, supercoiled), we used up to 4 independently derived plasmid clones for each SLC26A9 DNA frag-ment tested. A spectrophotometer was used to quantify DNA con-centration. The number of plasmids used was calculated based on the concentration of the plasmid adjusted for size (molecular molar mass); thus, all transfections contained equal numbers of plasmid copies per technical replicate/well in each independent transfection
(1.7 × 10⁻¹³ mol or approximately 1.0 × 10¹¹ copies). To address
biologi-cal variation, transfections were performed in 6 wells for at least 2 to 3 independent transfections per construct. As a control for the normal-ization of transfection efficiency, the same amount of the renilla
lucif-erase encoding plasmid pRL-TK (3.4 × 10⁻¹⁵ mol or approximately 2.0
× 109 copies) was added to all transfection wells (94, 95). The neutral
constitutive expression of Renilla luciferase was used as an internal control value to which expression of the experimental firefly lucifer-ase reporter gene was normalized. Whole-cell lysates were harvested
Methods
Diagnosis of CFRD. The CFRD phenotype was defined using data extracted from medical charts or the CFF Patient Registry. Minimum criteria included clinical diagnosis of CFRD and at least 1 year insulin use (9). Supporting lab data were used when available, including glu-cose tolerance and hemoglobin A1c (the HbA1c is not used to rule out diabetes, but can be used to rule it in, as per CFRD guidelines). Fast-ing glucose was found to have low specificity for CFRD after review of chart data and was not used in the definition of CFRD.
Resequencing cohort and capture. A total of 762 p.Phe508del homo-zygotes recruited as a part of the Johns Hopkins Twin and Sibling Study and University of North Carolina’s Genetic Modifiers Study (GMS) were analyzed. Cohort selection, sample consent, and DNA preparations were previously described (87). A total of 47.7 kb encompassing SLC26A9 and
extending 9.9kb 5′ and 7.4 kb 3′ of the gene were deep sequenced
(cap-ture design, library prep, sequencing, variant call and annotation, and data cleaning, as reported by Vecchio-Pagán et al., ref. 87).
LD, haplotype block analysis, and association testing. Each variant was associated with the martingale residual phenotype for CFRD using a linear regression in the PLINK software package, version 1.07 (88). Data were initially cleaned for individual and variant missingness and IBD structure to remove related samples. Individual variant associa-tion with CFRD was conducted using the --assoc command on PLINK. The log-transformed P values were plotted as a locus zoom plot using LocusZoom (89), shown in Figure 1A. For haplotype-based associa-tion testing, the analysis was conducted in PLINK using the --chap and --each-vs-others commands. Only haplotypes with frequencies of more than 2% containing variants with frequencies of less than 15% were derived. LD blocks and haplotypes were confirmed and visualized using Haploview (Figure 2 and Supplemental Figure 1).
Common and rare variant burden testing. To check for association between sets of variants and CFRD, a 5 kb sliding window was moved across the entire 47.7 kb capture region in 1250 bp increments, and com-mon and rare variants (MAF cut-off: 1% in our population) falling within these regions were grouped for region-based burden testing using the SKAT-O algorithm (90). In the 47.7 kb captured region encompassing the SLC26A9 locus and surrounding genes, a total of 36 windows were present. The SKAT-O algorithm was implemented in R, using the SSD commands, which allow for loading of a PLINK formatted data set, and the optimal.adj method, representing the optimized method.
Determination of TSS of SLC26A9. 5′ RACE was performed using
the Switching Mechanism At RNA Termini (SMARTer) RACE cDNA Amplification Kit (Clontech). RNA isolated from primary tissue (pan-creas, lung, and stomach) obtained from the Johns Hopkins Pathology
Department was used to synthesize the first-strand cDNA and 5′
-RACE-Ready cDNA with the SeqAmp DNA Polymerase in accordance with the
manufacturer’s instructions. The gene-specific primer (5′
-GATTACG-CCAAGCTTGGCAGGCTAGCGTAGCTGACACG-3′) sitting in exon 5
of SLC26A9 was used for RACE PCR, and the products containing the 15 bp overlap (GATTACGCCAAGCTT) were cloned into the linearized pRACE vector with In-Fusion HD Cloning (Takara). Plasmids were sent for Sanger sequencing with M13F and M13R primers.
scRNA-Seq of pancreatic cells. Preparation of single cells and pro-cessing of RNA-Seq reads are available in Supplemental Methods.
Acknowledgments
The authors thank Michael Knowles and Rhonda Pace for pro-viding samples for the resequencing study and Jun Shen for her technical support during the early phase of the project. We thank all of the HAVANA team that contributed to the manual annotation. Additionally, we thank the GTEx Project, which was supported by the Common Fund of the Office of the Director of the NIH, and by the National Cancer Institute, the National Human Genome Research Institute, the National Heart, Lung, and Blood Institute, the National Institute on Drug Abuse, the National Institute of Mental Health, and the National Institute of Neurological Disorders and Stroke. The data used for the analy-ses described in this manuscript were obtained from gtexportal. org on 03/08/19. This work was supported in part by the United States Cystic Fibrosis Foundation (CFF) (CUTTIN13A2, CUT-TIN17G0) and by the NIH (DK44003) (to GRC) and the CFF (BLACKM16G0, BLACKM16A0) and Gilead Sciences (to SMB). ATNL was supported in part by training grant T32GM07814. LAG is supported by the NSF (IOS-1656592), the Maryland Stem Cell Research Fund (2016-MSCRFI-2805), the Chan- Zuckerberg Initiative DAF (2018-183445), and the Johns Hopkins University Catalyst and Synergy Awards. This research was partly supported by NIH grants U01 DK108306, DK098560 (to DCW), and DK063922 (to CAS).
Address correspondence to: Garry R. Cutting, Johns Hopkins University School of Medicine, Institute of Genetic Medicine, 733 North Broadway, BRB Suite 551/Room 559, Baltimore, Maryland, 21205, USA. Phone: 410.955.1773; Email: gcutting@jhmi.edu. after 15-minute incubation with 1× passive lysis buffer (Promega).
All samples were centrifuged at maximum speed for 15 minutes at
4°C and plated onto a 96-well plate in triplicate with 20 μL lysate per
well, then analyzed using the Dual-Luciferase Reporter Assay Sys-tem (Promega) on a BioTek plate reader (BioTek Instruments, Inc.).
The luminometer was set to inject 50 μL of Luciferase Assay
Buf-fer II (LARII) and 50 μL Stop & Glo Reagent sequentially into each
sample for independent measurement of fLUC and rLUC activities. Each injection was followed by a slow shake for 3 seconds, followed by an integration period allotted by a 2-second delay. Luminescence for both fLUC and rLUC, and the relative ratio of fLUC/rLUC activity was recorded in an Excel file.
Study approval. Samples were obtained under approved research protocols from the Johns Hopkins Pathology Department (IRB00157289, date of acknowledgement is 8/16/2018; date of Expira-tion is 8/16/2021) and the University of Pittsburgh (IRB PRO16030614 for demographic information and PRO13020493 for genetic evalua-tion of pancreatic surgical waste).
Author contributions
ATNL performed data analysis, designed and performed exper-iments, contributed to data interpretation, and wrote the manu-script. MAA performed data analysis and assisted in writing the manuscript. BVP performed data analysis. AFA assisted in plasmid construction. LAG assisted in data interpretation. CAS and DLO performed experiments. DCW contributed to experimental design. SMB contributed to the overall design of the project, data analysis, and manuscript writing. GRC directed the overall research, exper-imental design, and data interpretation and wrote the manuscript.
1. Davies JC, Alton EW, Bush A. Cystic fibrosis.
BMJ. 2007;335(7632):1255–1259.
2. Cystic Fibrosis Foundation. Cystic Fibrosis Foun-dation Patient Registry Annual Data Report 2017. https://www.cff.org/Research/Researcher- Resources/Patient-Registry/. Published August 1, 2018. Accessed October 28, 2019.
3. Moran A, et al. Clinical care guidelines for cystic fibrosis-related diabetes: a position statement of the American Diabetes Association and a clinical practice guideline of the Cystic Fibrosis Foundation, endorsed by the Pediatric Endocrine Society. Diabetes Care. 2010;33(12):2697–2708. 4. Lewis C, et al. Diabetes-related mortality in adults
with cystic fibrosis. Role of genotype and sex. Am J
Respir Crit Care Med. 2015;191(2):194–200.
5. Milla CE, Warwick WJ, Moran A. Trends in pul-monary function in patients with cystic fibrosis correlate with the degree of glucose intoler-ance at baseline. Am J Respir Crit Care Med. 2000;162(3 Pt 1):891–895.
6. Gottlieb PA, et al. No relation between cystic fibrosis-related diabetes and type 1 diabetes autoimmunity. Diabetes Care. 2012;35(8):e57. 7. Couce M, O’Brien TD, Moran A, Roche PC,
Butler PC. Diabetes mellitus in cystic fibrosis is characterized by islet amyloidosis. J Clin
Endocri-nol Metab. 1996;81(3):1267–1272.
8. Blackman SM, et al. Genetic modifiers of cystic fibrosis-related diabetes. Diabetes. 2013;62(10):3627–3635.
9. Blackman SM, et al. Genetic modifiers play a substantial role in diabetes complicating cystic fibrosis. J Clin Endocrinol Metab. 2009;94(4):1302–1309.
10. Lohi H, et al. Functional characterization of three novel tissue-specific anion exchang-ers SLC26A7, -A8, and -A9. J Biol Chem. 2002;277(16):14246–14254.
11. Dorwart MR, Shcheynikov N, Wang Y, Stippec S, Muallem S. SLC26A9 is a Cl(-) channel regulated by the WNK kinases. J Physiol (Lond). 2007;584(Pt 1):333–345.
12. Loriol C, et al. Characterization of SLC26A9, facilitation of Cl(-) transport by bicarbonate.
Cell Physiol Biochem. 2008;22(1-4):15–30.
13. Chang MH, et al. Slc26a9 is inhibited by the R-region of the cystic fibrosis transmembrane conductance regulator via the STAS domain.
J Biol Chem. 2009;284(41):28306–28318.
14. Salomon JJ, Spahn S, Wang X, Füllekrug J, Bertrand CA, Mall MA. Generation and functional character-ization of epithelial cells with stable expression of SLC26A9 Cl- channels. Am J Physiol Lung Cell Mol
Physiol. 2016;310(7):L593–L602.
15. Walter JD, Sawicka M, Dutzler R. Cryo-EM structures and functional characterization of murine Slc26a9 reveal mechanism of uncoupled chloride transport. Elife. 2019;8:e46986. 16. Xu J, et al. Deletion of the chloride
trans-porter Slc26a9 causes loss of tubulovesicles in parietal cells and impairs acid secretion
in the stomach. Proc Natl Acad Sci U S A. 2008;105(46):17955–17960.
17. Liu X, et al. Loss of Slc26a9 anion transporter alters intestinal electrolyte and HCO3(-) trans-port and reduces survival in CFTR-deficient mice. Pflugers Arch. 2015;467(6):1261–1275. 18. Amlal H, Xu J, Barone S, Zahedi K, Soleimani M.
The chloride channel/transporter Slc26a9 regu-lates the systemic arterial pressure and renal chlo-ride excretion. J Mol Med. 2013;91(5):561–572. 19. Bertrand CA, Zhang R, Pilewski JM, Frizzell RA.
SLC26A9 is a constitutively active, CFTR-reg-ulated anion conductance in human bronchial epithelia. J Gen Physiol. 2009;133(4):421–438. 20. Anagnostopoulou P, et al. SLC26A9-mediated
chloride secretion prevents mucus obstruction in airway inflammation. J Clin Invest. 2012;122(10):3629–3634.
21. Bakouh N, et al. Characterization of SLC26A9 in patients with CF-like lung disease. Hum Mutat. 2013;34(10):1404–1414.
22. Strug LJ, et al. Cystic fibrosis gene modifier SLC26A9 modulates airway response to CFTR-directed therapeutics. Hum Mol Genet. 2016;25(20):4590–4600.
24. GTEx Consortium. The Genotype-Tissue Expression (GTEx) project. Nat Genet. 2013;45(6):580–585.
25. Xu J, et al. SLC26A9 is expressed in gastric surface epithelial cells, mediates Cl-/HCO3- exchange, and is inhibited by NH4+. Am J Physiol,
Cell Physiol. 2005;289(2):C493–C505.
26. Lee HJ, et al. Thick airway surface liquid volume and weak mucin expression in pendrin- deficient human airway epithelia. Physiol Rep. 2015;3(8):e12480.
27. El Khouri E, Touré A. Functional interaction of the cystic fibrosis transmembrane conductance regulator with members of the SLC26 family of anion transporters (SLC26A8 and SLC26A9): physiological and pathophysiological relevance.
Int J Biochem Cell Biol. 2014;52:58–67.
28. Ousingsawat J, Schreiber R, Kunzelmann K. Differential contribution of SLC26A9 to Cl(-) con-ductance in polarized and non-polarized epithelial cells. J Cell Physiol. 2012;227(6):2323–2329. 29. Miller MR, et al. Variants in Solute Carrier
SLC26A9 Modify Prenatal Exocrine Pan-creatic Damage in Cystic Fibrosis. J Pediatr. 2015;166(5):1152–1157.e6.
30. Soave D, et al. Evidence for a causal relationship between early exocrine pancreatic disease and cystic fibrosis-related diabetes: a Mendelian ran-domization study. Diabetes. 2014;63(6):2114–2119. 31. Gong J, et al. Genetic association and
transcrip-tome integration identify contributing genes and tissues at cystic fibrosis modifier loci. PLoS Genet. 2019;15(2):e1008007.
32. Sun L, et al. Multiple apical plasma membrane constituents are associated with susceptibility to meconium ileus in individuals with cystic fibro-sis. Nat Genet. 2012;44(5):562–569.
33. Blackman SM, et al. Relative contribution of genetic and nongenetic modifiers to intestinal obstruction in cystic fibrosis. Gastroenterology. 2006;131(4):1030–1039.
34. Kemaladewi DU, et al. A mutation-inde-pendent approach for muscular dystrophy via upregulation of a modifier gene. Nature. 2019;572(7767):125–130.
35. O’Neal WK, Knowles MR. Cystic Fibrosis Dis-ease Modifiers: Complex Genetics Defines the Phenotypic Diversity in a Monogenic Disease.
Annu Rev Genomics Hum Genet. 2018;19:201–222.
36. Bellin MD, et al. Insulin secretion improves in cystic fibrosis following ivacaftor correction of CFTR: a small pilot study. Pediatr Diabetes. 2013;14(6):417–421.
37. Tsabari R, et al. CFTR potentiator therapy ameliorates impaired insulin secretion in CF patients with a gating mutation. J Cyst Fibros. 2016;15(3):e25–e27.
38. Thomassen JC, Mueller MI, Alejandre Alcazar MA, Rietschel E, van Koningsbruggen-Rietschel S. Effect of Lumacaftor/Ivacaftor on glucose metabolism and insulin secretion in Phe508del homozygous cystic fibrosis patients. J Cyst Fibros. 2018;17(2):271–275.
39. Li A, et al. Continuous glucose monitoring in youth with cystic fibrosis treated with lumacaftor- ivacaftor. J Cyst Fibros. 2019;18(1):144–149. 40. Kelly A, et al. Islet hormone and incretin
secre-tion in cystic fibrosis after four months of
ivacaftor therapy. Am J Respir Crit Care Med. 2019;199(3):342–351.
41. Lesurf R, et al. ORegAnno 3.0: a community- driven resource for curated regulatory annota-tion. Nucleic Acids Res. 2016;44(D1):D126–D132. 42. Mathelier A, et al. JASPAR 2014: an extensively expanded and updated open-access database of transcription factor binding profiles. Nucleic Acids
Res. 2014;42(Database issue):D142–D147.
43. Butler A, Hoffman P, Smibert P, Papalexi E, Satija R. Integrating single-cell transcriptomic data across different conditions, technologies, and species. Nat Biotechnol. 2018;36(5):411–420. 44. Baron M, et al. A single-cell transcriptomic map
of the human and mouse pancreas reveals inter- and intra-cell population structure. Cell Syst. 2016;3(4):346–360.e4.
45. Wang YJ, et al. Single-cell transcriptomics of the human endocrine pancreas. Diabetes. 2016;65(10):3028–3038.
46. Muraro MJ, et al. A single-cell transcrip-tome atlas of the human pancreas. Cell Syst. 2016;3(4):385–394.e3.
47. Segerstolpe Å, et al. Single-cell transcriptome profiling of human pancreatic islets in health and type 2 diabetes. Cell Metab. 2016;24(4):593–607. 48. Norris AW, et al. Survival in a bad neighborhood: pancreatic islets in cystic fibrosis. J Endocrinol. 2019;241(1):R35–R50.
49. Hart NJ, et al. Cystic fibrosis-related diabetes is caused by islet loss and inflammation. JCI Insight. 2018;3(8):98240.
50. Sinđić A, Sussman CR, Romero MF. Primers on molecular pathways: bicarbonate transport by the pancreas. Pancreatology. 2010;10(6):660–663. 51. Alka K, Casey JR. Bicarbonate transport in health
and disease. IUBMB Life. 2014;66(9):596–615. 52. Park HW, Lee MG. Transepithelial bicarbonate secretion: lessons from the pancreas. Cold Spring
Harb Perspect Med. 2012;2(10):a009571.
53. Montoro DT, et al. A revised airway epithelial hierarchy includes CFTR-expressing ionocytes.
Nature. 2018;560(7718):319–324.
54. Plasschaert LW, et al. A single-cell atlas of the airway epithelium reveals the CFTR-rich pulmo-nary ionocyte. Nature. 2018;560(7718):377–381. 55. Lieber M, Mazzetta J, Nelson-Rees W, Kaplan M,
Todaro G. Establishment of a continuous tumor-cell line (panc-1) from a human carcinoma of the exocrine pancreas. Int J Cancer. 1975;15(5):741–747. 56. Wu Y, Li J, Saleem S, Yee SP, Hardikar AA,
Wang R. c-Kit and stem cell factor regulate PANC-1 cell differentiation into insulin- and glucagon-producing cells. Lab Invest. 2010;90(9):1373–1384.
57. Gottschalk LB, et al. Creation and characteri-zation of an airway epithelial cell line for stable expression of CFTR variants. J Cyst Fibros. 2016;15(3):285–294.
58. McIntosh JC, Schoumacher RA, Tiller RE. Pancreatic adenocarcinoma in a patient with cystic fibrosis. Am J Med. 1988;85(4):592. 59. Schoumacher RA, et al. A cystic fibrosis
pancre-atic adenocarcinoma cell line. Proc Natl Acad Sci
USA. 1990;87(10):4012–4016.
60. Bockmühl Y, Murgatroyd CA, Kuczynska A, Adcock IM, Almeida OF, Spengler D. Differ-ential regulation and function of
5’-untrans-lated GR-exon 1 transcripts. Mol Endocrinol. 2011;25(7):1100–1110.
61. Babendure JR, Babendure JL, Ding JH, Tsien RY. Control of mammalian translation by mRNA structure near caps. RNA. 2006;12(5):851–861. 62. Bertrand CA, et al. The CFTR trafficking muta-tion F508del inhibits the constitutive activity of SLC26A9. Am J Physiol Lung Cell Mol Physiol. 2017;312(6):L912–L925.
63. Ghazalpour A, et al. Comparative analysis of proteome and transcriptome variation in mouse.
PLoS Genet. 2011;7(6):e1001393.
64. Delaspre F, et al. Centroacinar cells are progeni-tors that contribute to endocrine pancreas regen-eration. Diabetes. 2015;64(10):3499–3509. 65. Harris A. The duct cell in cystic fibrosis. Ann N Y
Acad Sci. 1999;880:17–30.
66. Beer RL, Parsons MJ, Rovira M. Centroacinar cells: At the center of pancreas regeneration.
Dev Biol. 2016;413(1):8–15.
67. Ghaye AP, et al. Progenitor potential of nkx6.1-expressing cells throughout zebrafish life and during beta cell regeneration. BMC Biol. 2015;13:70.
68. Boom A, et al. Expression and localization of cystic fibrosis transmembrane conductance reg-ulator in the rat endocrine pancreas. Endocrine. 2007;32(2):197–205.
69. Huang WQ, et al. Glucose-sensitive CFTR sup-presses glucagon secretion by potentiating KATP channels in pancreatic islet α cells. Endocrinology. 2017;158(10):3188–3199.
70. Barry PJ, Banerjee A, Horsley A, Brennan AL. 182 Impact of ivacaftor on glycaemic health in patients carrying the G551D mutation. Journal of
Cystic Fibrosis. 2015;14(suppl 1):S104. https://doi.
org/10.1016/S1569-1993(15)30359-3. 71. Kirwan L, et al. Longitudinal trends in real-world
outcomes after initiation of ivacaftor. a cohort study from the Cystic Fibrosis Registry of Ire-land. Ann Am Thorac Soc. 2019;16(2):209–216. 72. Hardt PD, et al. Pancreatic exocrine function in
patients with type 1 and type 2 diabetes mellitus.
Acta Diabetol. 2000;37(3):105–110.
73. Nunes AC, Pontes JM, Rosa A, Gomes L, Carval-heiro M, Freitas D. Screening for pancreatic exo-crine insufficiency in patients with diabetes melli-tus. Am J Gastroenterol. 2003;98(12):2672–2675. 74. Raeder H, et al. Mutations in the CEL VNTR
cause a syndrome of diabetes and pancreatic exo-crine dysfunction. Nat Genet. 2006;38(1):54–62. 75. Vesely PW, Staber PB, Hoefler G, Kenner L.
Translational regulation mechanisms of AP-1 proteins. Mutat Res. 2009;682(1):7–12. 76. Karin M, Liu Zg, Zandi E. AP-1 function and
regu-lation. Curr Opin Cell Biol. 1997;9(2):240–246. 77. Gupta MK, Vadde R. Identification and
charac-terization of differentially expressed genes in type 2 diabetes using in silico approach. Comput
Biol Chem. 2019;79:24–35.
78. Li J, et al. The expression level of mRNA, protein, and DNA methylation status of FOSL2 of Uyghur in XinJiang in type 2 diabetes. J Diabetes Res. 2016;2016:5957404.
in the Bangladeshi population. PLoS ONE. 2018;13(7):e0198507.
80. Gao N, et al. Foxa1 and Foxa2 maintain the met-abolic and secretory features of the mature beta-cell. Mol Endocrinol. 2010;24(8):1594–1604. 81. Vatamaniuk MZ, Gupta RK, Lantz KA, Doliba
NM, Matschinsky FM, Kaestner KH. Foxa1- deficient mice exhibit impaired insulin secretion due to uncoupled oxidative phosphorylation.
Diabetes. 2006;55(10):2730–2736.
82. Manolio TA, et al. Finding the missing heritability of complex diseases. Nature. 2009;461(7265):747–753.
83. Sondo E, Caci E, Galietta LJ. The TMEM16A chloride channel as an alternative therapeutic target in cystic fibrosis. Int J Biochem Cell Biol. 2014;52:73–76.
84. Muraglia KA, et al. Small-molecule ion channels increase host defences in cystic fibrosis airway epithelia. Nature. 2019;567(7748):405–408. 85. Balázs A, Mall MA. Role of the SLC26A9 chloride
channel as disease modifier and potential thera-peutic target in cystic fibrosis. Front Pharmacol. 2018;9:1112.
86. Mall MA, Galietta LJ. Targeting ion channels in cystic fibrosis. J Cyst Fibros. 2015;14(5):561–570. 87. Vecchio-Pagán B, et al. Deep resequencing of
CFTR in 762 F508del homozygotes reveals
clusters of non-coding variants associated with cystic fibrosis disease traits. Hum Genome Var. 2016;3:16038.
88. Purcell S, et al. PLINK: a tool set for whole- genome association and population-based linkage analyses. Am J Hum Genet. 2007;81(3):559–575. 89. Pruim RJ, et al. LocusZoom: regional visualiza-tion of genome-wide associavisualiza-tion scan results.
Bioinformatics. 2010;26(18):2336–2337.
90. Lee S, Wu MC, Lin X. Optimal tests for rare variant effects in sequencing association studies.
Biostatistics. 2012;13(4):762–775.
91. Langmead B, Salzberg SL. Fast gapped-read alignment with Bowtie 2. Nat Methods.
2012;9(4):357–359.
92. Trapnell C, Pachter L, Salzberg SL. TopHat: discovering splice junctions with RNA-Seq.
Bioinformatics. 2009;25(9):1105–1111.
93. Trapnell C, Hendrickson DG, Sauvageau M, Goff L, Rinn JL, Pachter L. Differential analysis of gene regulation at transcript resolution with RNA-Seq. Nat Biotechnol. 2013;31(1):46–53. 94. Behre G, Smith LT, Tenen DG. Use of a
pro-moterless Renilla luciferase vector as an internal control plasmid for transient co-transfection assays of Ras-mediated transcription activation.
BioTechniques. 1999;26(1):24–26,28.