Manuscript version: Author’s Accepted Manuscript
The version presented in WRAP is the author’s accepted manuscript and may differ from the published version or Version of Record.
Persistent WRAP URL:
http://wrap.warwick.ac.uk/114287
How to cite:
Please refer to published version for the most recent bibliographic citation information. If a published version is known of, the repository item page linked to above, will contain details on accessing it.
Copyright and reuse:
The Warwick Research Archive Portal (WRAP) makes this work by researchers of the University of Warwick available open access under the following conditions.
Copyright © and all moral rights to the version of the paper presented here belong to the individual author(s) and/or other copyright owners. To the extent reasonable and
practicable the material made available in WRAP has been checked for eligibility before being made available.
Copies of full items can be used for personal research or study, educational, or not-for-profit purposes without prior permission or charge. Provided that the authors, title and full
bibliographic details are credited, a hyperlink and/or URL is given for the original metadata page and the content is not changed in any way.
Publisher’s statement:
Please refer to the repository item page, publisher’s statement section, for further information.
How common is imaging for low back pain in primary and emergency
care? Systematic review and meta-analysis of over 4 million imaging
requests across 21 years.
Authors’ names
Aron Downie, Mark J Hancock, Hazel Jenkins, Rachelle Buchbinder, Ian Harris, Martin Underwood, Stacy Goergen, Chris G Maher
Aron Downie, corresponding author
PhD (Candidate)
1. Institute for Musculoskeletal Health, Sydney School of Public Health, Faculty of Medicine and Health, The University of Sydney. PO Box M179, Missenden Road NSW 2050, Australia. 2. Faculty of Science and Engineering, Macquarie University, Australia.
Mark J Hancock
Associate Professor, Faculty of Medicine and Health Sciences, Macquarie University, Australia. [email protected]
Hazel Jenkins
Lecturer, Faculty of Science and Engineering, Macquarie University, Australia. [email protected]
Rachelle Buchbinder
Professor, Department of Epidemiology and Preventive Medicine, School of Public Health & Preventive Medicine, Monash University and Monash Department of Clinical Epidemiology Cabrini Institute, Australia.
Ian Harris
Professor, South Western Sydney Clinical School, University of NSW, Australia. [email protected]
Martin Underwood
Professor, Warwick Clinical Trials Unit, The University of Warwick, United Kingdom. [email protected]
Stacy Goergen
Adjunct Clinical Professor, School of Clinical Sciences, Monash University, Australia. [email protected]
Chris G Maher
Professor, Institute for Musculoskeletal Health, Sydney School of Public Health, Faculty of Medicine and Health, The University of Sydney, Australia
Abstract word count: 304
ABSTRACT
Objectives: To(i) estimate the proportion of patients seeking care for low back pain (LBP) who are imaged, and (ii) explore trends in the proportion of patients who received diagnostic imaging over time. We also examined the effect of study-level factors on estimates of imaging proportion.
Data sources: Electronic searches of MEDLINE, EMBASE, and CINAHL databases from January 1995 to December 2017.
Eligibility criteria for selecting studies: Observational designs and controlled trials that reported imaging for patients presenting to primary care or emergency care for LBP. We assessed study quality and calculated pooled proportions by care setting and imaging type, with strength of evidence assessed using the GRADE system.
Results: 45 studies were included. They represented 19,451,749 consultations for low back pain that had resulted in 4,343,919 imaging requests/events over 21 years. Primary care: moderate quality evidence that simple imaging proportion was 16.3% (95%CI 12.6 to 21.1) and complex imaging was 9.2% (95%CI 6.2 to 13.5). For any imaging the pooled proportion was 24.8% (95%CI 19.3 to 31.1). Emergency care: moderate quality evidence that simple imaging proportion was 26.1% (95%CI 18.2 to 35.8) and high quality evidence that complex imaging proportion was 8.2% (95%CI 4.4 to 15.6). For any imaging the pooled proportion was 35.6 % (95%CI 29.8 to 41.8). Complex imaging increased from 7.4% (95%CI 5.7 to 9.6) for imaging requested in 1995, to 11.4% (95%CI 9.6 to 13.5) in 2015 (relative increase of 53.5%). Between-study variability in imaging proportions was only partially explained by study-level characteristics; there were insufficient data to comment on some pre-specified study-level factors.
Summary/conclusion: One in 4 patients who presented to primary care with low back pain
Introduction
Low back pain (LBP) is a major contributor to disease burden worldwide;1 with higher prevalence in athletes than in the general population.2 The majority of LBP has no known patho-anatomical cause; presentations due to a specific disease process (eg, infection, malignancy) are uncommon in primary care.3 Diagnostic imaging is only recommended for low back pain without radicular pain when there is suspicion of a specific disease process (eg, malignancy, fracture, infection, or spondyloarthropathies) that would be managed differently to non-specific LBP.4-6
Overuse of imaging for LBP has been reported for many decades with studies reporting that 20% of patients presenting with LBP received imaging in the UK,7 8 and 25% in Australia9 and USA.10 However, the veracity of these estimates is unclear as there has not been a systematic review of studies evaluating the frequency of imaging in patients presenting for care with LBP.
In this systematic review our aims were to (i) estimate the proportion of patients seeking care for LBP who are imaged currently; (ii) explore trends in the proportion of patients receiving diagnostic imaging over time. We also examined the effect of study-level factors on estimates of the imaging proportion. We hypothesised that the imaging proportion should have decreased over time as a result of clinical practice and therapeutic guidelines to limit imaging and more recently through campaigns such as Choosing Wisely (launched in 2012) warning about overuse of imaging for LBP.11-15
Methods
The study protocol was pre-specified, and the review conducted in accordance with PRISMA and MOOSE guidelines.16 17 The study protocol was registered with PROSPERO
Searches
We searched MEDLINE, EMBASE and CINAHL for articles published between 1st January 1995 and 9th December 2017 in any language. The rationale for searching from 1995 was that the first evidence-based LBP guideline to provide advice for use of imaging was released in 1994.18 Search terms relating to primary or emergency care, imaging type, and LBP were used (Appendix 1: MEDLINE search string). We supplemented electronic searches with hand searches of reference lists from eligible studies and contacted experts in the field of imaging and management of LBP. Two authors (AD and HJ) independently performed title and abstract screening with full-text articles assessed for study eligibility. Any disagreements were resolved by consensus.
Study selection
Eligible study designs were controlled trials, and observational designs (cohort, case-control, cross-sectional, and interrupted time series). Studies needed to report on imaging requested or performed for patients presenting to primary or emergency care for LBP. We defined primary care as first contact care with a provider who could refer for imaging, including medical practitioners (eg, general practitioners), and allied health practitioners (eg, physiotherapists chiropractors, osteopaths). We defined emergency care as first contact care in the hospital emergency department setting. Studies were ineligible if not written in English and translation to English was not feasible, if all participants were imaged, or if greater than 25% of the participant sampling frame was prior to 1995.18
Data extraction and risk of bias assessments
consensus, or a third rater, if required. Data from each study were extracted using a pre-piloted form. Where available, we extracted data on: year of publication, study design, country, clinical setting, imaging modality, study sampling frame, imaging observation window (period of time between presenting to the clinician and the last time point at which data on imaging request/event was collected), participant characteristics, imaging proportion, and study sample size. Authors were contacted to request additional data where required. We extracted imaging proportion based on the entire study sample for observational studies. For controlled trials testing strategies to reduce imaging we extracted data from the control arm only.
Risk of bias was assessed using the tool developed by Hoy et al. for assessing risk of bias of prevalence studies (2012).19 The tool comprises 10 items scored for risk of bias (low risk, high risk). Modification was made to two of the original 10 items to reflect the aims of this study.
Representative population (item 1) was specified as a population seeking primary or
emergency care for LBP, and prevalence period (item 9) was specified as the imaging observation window. We generated an overall summary risk of bias score (low, moderate, high risk) based on consideration of the 10 items.19 Any disagreements were resolved by consensus or a third rater.
Data synthesis
was continuous, a single average imaging proportion was calculated. For discontinuous sampling frames (eg, 2002–03; 2011–12) average imaging proportions representing each period were calculated.
Data analysis
Current imaging proportion
To estimate the current imaging proportion we calculated pooled proportions, grouped by clinical setting (primary or emergency), then by imaging type (simple, complex, or any) using random-effects meta-analysis. The relative study weights assigned under a random-effects model are minimally influenced by extremes in study populations.20 21 Outlier studies (identified by visual inspection of the forest plot) were described and excluded from pooled analyses. Some clinical heterogeneity was expected due to variation in study population and clinical features.22 Statistical heterogeneity was assessed, however, meta-analysis was not deemed inappropriate simply due to high I2 values, as long as the individual study estimates fell in a reasonable range.23 24 Sensitivity analyses of pooled imaging proportions were performed based on summary risk of bias (high vs low or moderate risk). Each pooled proportion was graded for quality of evidence.
evidence was measured as part of the summary risk of bias. Any disagreement was resolved by consensus or a third rater.
Trends in frequency of diagnostic imaging
We explored trends in imaging over time for simple and complex imaging, using mixed-effects meta-regression with important pre-specified study-level factors considered as covariates.27 28 We considered factors for regression if reported by greater than 85% of studies.27 We performed a univariate analysis for each factor. We built two multivariate models (simple imaging, complex imaging) with study year selected and other factors added. Final selection of study-level factors was based on clinical rationale (not data driven), testing for collinearity (VIF <4)29 and ensuring the model was not overfit based on the number of available studies. We identified, then considered excluding from regression, extreme outlier studies based on a plot of standardised shrunken residuals as recommended by Harbord and Higgins (2008).30 Statistical analyses used STATA-IC v15 (StataCorp, USA) –metareg,30 and Comprehensive Meta Analysis v3.3 (Biostat, USA).
Results
The electronic database search and citation tracking identified 5,011 potential studies of interest. After screening of titles and abstracts, we retrieved full text copies of 191 articles. Forty-five studies were included in the review (42 unique data sources). Key reasons for exclusion included: imaging proportion inestimable, inappropriate study design, and >25% of the participant sampling frame prior to 1995 (Figure 1).
Characteristics of included studies
participants,49 with government-supported studies the commonest. The majority of studies were from North America (Canada [2 studies], United States [29 studies]), followed by Oceania (Australia [5], New Zealand [1]), Europe (Germany [1], Italy [1], Poland [1], Spain [3]), and UK (England [2]). Two studies studied exclusively elderly participants.10 60 The majority of studies were retrospective reviews of clinical records or insurer data. Most commonly reported modalities were radiography, CT and MRI. A small proportion of patients presenting with LBP received diagnostic ultrasound: Britt et al. (2014)34 (0.4%, 2002-05; 0.6%, 2009-12) and Allen (2014)31 (0.6%, 2001-09). However, neither study provided details about what structures were scanned. Ultrasound is not appropriate for identifying the usual or common serious causes of low back pain including fracture and cancer, but may be considered in patients with suspicion of abdominal aortic aneurysm71 or renal colic.72 73Radionuclide bone scan was also reported by Britt et al. (2014)34 (0.3%, 2002-05, 0.2%, 2009-12). Thirty-six of the 45 studies (80%) had an imaging observation window within 3 months. The imaging observation window ranged from same day (eg, imaging data from the emergency setting),62 out to 1 year (eg, review of private health insurer data).43 Study characteristics are provided in
Table 1.
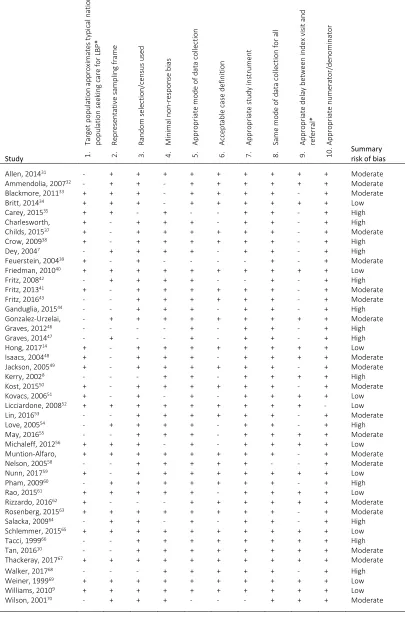
The majority of studies scored moderate or high for summary risk of bias (N=34, 76%).The most frequent reasons for high risk of bias were non-representative sample (eg, by excluding the elderly), broad case definition, or imaging observation window greater than 4 weeks (Table 2).
(i) Current imaging proportion (2010 or later)
Current imaging in primary care
The pooled estimate of current proportion for simple imaging in primary care (N=7; n=1,574,236) was 16.3% (95%CI 12.6 to 21.1), rated as GRADE: moderate quality evidence. We considered Carey et al. (2015)35 (estimate: 56.9%, 95%CI 49.9 to 63.7; Appendix 2), an outlier so did not pool (the high estimate was potentially influenced by participant self-report).
For complex imaging (N=8; n=2,323,559), the pooled proportion was 9.2% (95%CI 6.2 to
13.5), GRADE: moderate quality evidence. We excluded Carey et al. (2015)35 from pooling as above (estimate: 80.1%, 95%CI 74.2 to 84.9). For any imaging (N=8; n=1,675,720), the pooled proportion was 24.8% (95%CI 19.3 to 31.1), GRADE: moderate quality evidence (Figure 2). Summary risk of bias (high vs low or moderate risk) did not significantly influence pooled proportions in primary care (P=0.21, 0.59, between group mixed-effects analyses for simple and complex imaging respectively) (Appendix 3).
Current imaging in emergency care
The pooled estimate of current proportion for simple imaging in emergency care (N=4; n=16,552) was 26.1% (95%CI 18.2 to 35.8), GRADE: moderate quality evidence. For complex
imaging (N=4; n=16,552), the pooled proportion was 8.2% (95%CI 4.4 to 15.6), GRADE: high
quality evidence. For any imaging (N=4; n=16,552) the pooled proportion was 35.6% (95%CI 29.8 to 41.8), GRADE: high quality evidence. (Figure 2).
(ii) Trends in frequency of diagnostic imaging over time
After removing duplicate data-sets 42 studies were available for meta-regression.46 56 63 See
Simple imaging
We included 36 studies in the adjusted simple imaging model (Figure 3, panel a). Carey et al. (2015)35 and Tacci et al. (1999)66 were extreme outliers, so were excluded from the model (shrunken residual=3.4 and 3.1, respectively). We found no significant change in the proportion of simple imaging over 20 years from 21.2% (95%CI 16.2 to 27.2) for imaging requested in 1995, to 21.3% (95%CI 16.4 to 27.2) for imaging requested in 2015. Similarly, clinical setting and imaging observation window were not associated with frequency of simple imaging in the adjusted model.
Complex imaging
We included 27 studies in the adjusted complex imaging model (Figure 3, panel b). Carey et al. (2015)35 was an extreme outlier, so was excluded from the model (shrunken residual=7.4). We found an absolute predicted increase in imaging proportion (P=0.03) from 7.4% (95%CI 5.7 to 9.6) for imaging requested in 1995, to 11.4% (95%CI 9.6 to 13.5) for imaging
requested in 2015, equivalent to a relative increase in complex imaging of 53.5%. Clinical setting was associated with frequency of complex imaging (P=0.001) with an imaging proportion of 17.8% (95%CI 13.5 to 23.0) for imaging requested in primary care, and 10.9% (95%CI 9.9 to 12.1) for imaging requested in emergency care. Length of observation window was also associated with frequency of complex imaging (P=0.001) with an imaging
proportion of 8.4% (95%CI 7.3 to 9.6) for imaging requested within 4 weeks of the initial visit, and 11.7% (95%CI 10.2 to 13.3) when imaging was measured across the whole study observation window. These three factors accounted for most of the variance in frequency of complex imaging (adjusted R2=75.3%).
Discussion
There is moderate quality evidence from eight studies that during the ‘current’ phase approximately one quarter of patients who presented to primary care were referred for imaging, and high-quality evidence from four studies that approximately one third of patients who presented to emergency care were imaged. Based upon 27 studies (n=8,742,444) we found a 53% relative increase in complex imaging from 1995 to 2015. When all studies were considered, more complex imaging was requested in primary care compared to emergency care. We found no change in frequency of simple imaging over the same period.
Strengths and limitations of review
The strengths of this systematic review include use of a pre-specified protocol, inclusion of studies published in languages other than English and consideration of all studies published after the introduction of the first clinical imaging guideline.18 We located studies from primary and emergency care as representative of settings where patients may seek care for LBP,59 and provide summary data in a graphical format which enables clinicians to interpret unbiased imaging estimates, assessed for quality using the GRADE system.
with no significant difference found between requests and events for complex imaging (Appendix 4). We were unable to extract sufficient data on some pre-specified study-level factors (eg, older age, duration of episode, presence of radicular syndrome) that may have influenced imaging rates. It remains unclear how these factors are associated with imaging proportions.
In relation to other studies
We believe this is the first systematic review of how commonly imaging was performed for
patients who seek care for LBP. As such, we are unable to compare our results with previous
reviews. Our study is a clear advance over non-systematic/narrative estimates from individual studies. For example, one study74 used the proportion of elderly patients who underwent imaging for acute LBP60 to estimate the potential cost saving across the adult US population in a campaign that targeted unnecessary imaging.
Imaging for LBP in the absence of indications of underlying pathology does not improve clinical outcomes,75 but we found that radiography ordering did not diminish over 20 years. Further, we found complex imaging (which includes CT imaging) had increased over the same period. These findings align with a recent study by Morrisroe et al. (2018)76 who reported a relative increase of 74% in Medicare-funded CT scans in Australia for LBP (195,000 in 2004 vs 340,000 in 2015), whilst billing for radiography remained static over the same period. Similarly, Deyo et al. (2009)77 described a relative increase of 307% in Medicare Part B claims for lumbar spine MRI in the 12 years from 1994.
need for more research in this area to develop new strategies to reduce unnecessary imaging. This investment in research can be justified by the ‘costs’ of unnecessary imaging. Unnecessary
imaging wastes scarce health resources and in the case of radiographs, CT and nuclear medicine, increases the risk of iatrogenic disease (cancers) because of cumulative ionising radiation.79 80 Another cost is that the risk of overdiagnosis increases with imaging (especially with complex imaging).12 This can promote poorer health outcomes through misguided patient or clinician concern,81 82 medicalisation of pain,83 or through unfounded confidence that incidental findings on imaging are the cause of LBP.82 84 85 The implication is that high levels of non-indicated imaging may contribute to the disease burden of LBP,1 iatrogenic disease, and perpetuate low value care.86-88
Unanswered questions and future research
The drivers of excessive imaging are multifactorial and incorporate many aspects of the health system including sluggish imaging guideline reform,89 reliance on individual red flags that offer little or no diagnostic value when a patient is triaged toward further investigations including imaging,90 91 regional variation (eg, different interpretations of legislation),44 cultural practices (eg, patient/practitioner beliefs),92 or financial interest (eg, clinicians with financial interest in MRI scanners).93 The majority of studies in our review either did not explore drivers of excessive imaging, or focused on a single issue such as health insurer variation36 or effect of clinical decision support.33 The complete picture of what drives excessive imaging when patients present with LBP remains unanswered.
the ED found a reduction in the volume of imaging after implementation.94 Involvement across multiple levels of healthcare (eg, clinicians, policy makers, payers, technology developers) has been recommended to help facilitate the adoption of clinical imaging decision support systems.95 Artificial intelligence algorithms may also assist clinicians with appropriate decisions about imaging,96 but have yet to be tested in the initial management of LBP. Similarly, natural language processing algorithms when applied to large volumes of imaging request/report data, may assist researchers to build improved clinical decision models for management of LBP.97 98 Further research to evaluate strategies aimed at reducing imaging as a contributor to overdiagnosis must be prioritised.12
Conclusion
Summary box
What is already known
The vast majority of low back pain has no patho-anatomical cause; patients should not undergo routine diagnostic imaging.
Overuse of imaging for low back pain has been reported for decades.
What are the new findings
We have moderate quality evidence that about one quarter of patients who presented to primary care for low back pain were imaged. We have high-quality evidence that about one third of similar patients who presented to emergency care were imaged.
Contributors: Conception and design: AD, MJH, CGM, HJ. Analysis and interpretation of the data: AD, MJH, HJ, CGM, MU, RB. Drafting of the article: AD, MJH, HJ, CGM. All authors critically revised the article for important intellectual content and approved the final article. Statistical expertise: AD, MJH, CGM. Administrative, technical, or logistic support: CGM, MJH. Extraction and assembly of data: AD, HJ, MJH, CGM. The corresponding author (AD) attests that all listed authors meet authorship criteria and that no others meeting the criteria have been omitted. AD is guarantor.
Funding: This research received no specific grant from any funding agency in the public, commercial, or not-for-profit sectors.
Competing interests: All authors have completed the ICMJE uniform disclosure form at
www.icmje.org/coi_disclosure.pdf and declare: no support from any organisation for the
submitted work; no financial relationships with any organisations that might have an interest in the submitted work in the previous three years; no other relationships or activities that could appear to have influenced the submitted work. For support outside the submitted work MU declares: funding by UK National Institute for Health Research and Arthritis Research UK, SERCO Ltd, personal fees from UK National Institute for Health and Care Excellence (NICE), personal fees from UK National Institute for Health Research (NIHR), and other from Clinvivo Ltd.
Ethical approval: Not required.
List of Tables
Table1. Characteristics of included studies
Shaded cells = Combined imaging reported
Abbreviations: ‘dash’ = Not reportable; APAC = All-Payer All-Claims; B/S = Bone scan; BCBSM = Blue Cross Blue Shield of Michigan; BCBSTX = Blue Cross Blue Shield of Texas; BEACH = Bettering the Evaluation and Care of Health; Ch = Chiropractic; CT = computed tomography; D-RISC = Disability Risk Identification Study Cohort; ED = Emergency department/emergency care/emergency clinician; E = Imaging event; GP= General practice/general practitioner/primary care physician/family practice; MEPS = Medical
Expenditure Panel Survey; MHS = Military Health System; mod = moderate MRI = magnetic resonance imaging; N. America = North America; NHAMCS = National Hospital Ambulatory Medical Care Survey; NAMCS = National Ambulatory Medical Care Survey; NZ ACC = New Zealand Accident Compensation Corporation; OHD = Outpatient hospital department; Ost = Osteopathy; PT = Physical therapy; R = Imaging request; UK = United Kingdom; UUHP= University of Utah Health Plans; U/S = Ultrasound; W/C = Workers’ compensation; XR = X-ray (radiography).
Table 2. Risk of bias assessment
*Modification was made to two of the original 10 items:19 The definition of the target population (item 1)
was modified to include only patients seeking care for LBP. We did not downgrade for geographic location or single health insurer. The length of the shortest prevalence period (item 9) was modified to the delay between index visit and request/imaging event (low risk ≤4weeks).
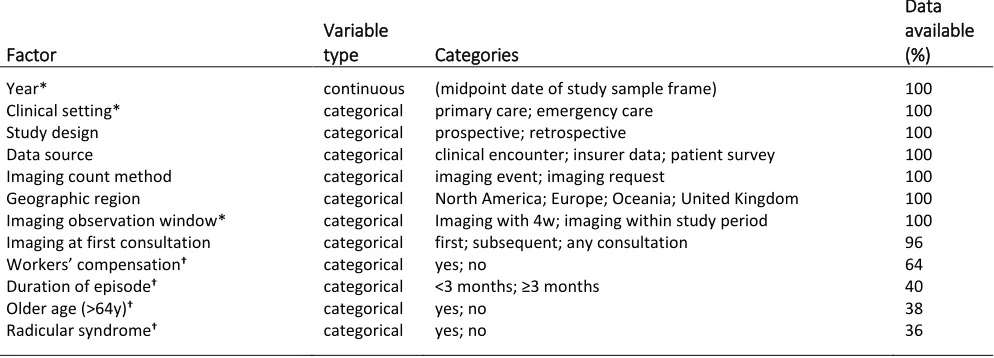
Table 3. Pre-specified study-level factors
*Included in the adjusted model †Study-level factors present in <85% of studies were ineligible for
meta-regression modelling.
List of Figures
Figure 1. PRISMA flow
Figure 2. Current imaging proportion in primary and emergency care ordered by summary risk of bias (high to low)
Pooled imaging proportions were calculated using random-effects meta-analysis. The ‘Any imaging’ sub-group contains only studies that reported both simple and complex imaging types. Carey et al. (2015)35 was
considered an outlier so was not pooled. Pooled estimates were assessed for quality using GRADE criteria, downgraded for: *greater than 50% of studies were scored moderate or high risk for summary risk of bias (ROB); †point estimate range was greater than 25%.
Figure 3. Influence of study-level factors on imaging proportion
Panels (a) and (b) represent trends in frequency of simple and complex diagnostic imaging since the introduction of clinical imaging guidelines. All models were calculated in the logit space, adjusted for clinical setting and imaging observation window. Circles represent the imaging proportion for each study sized according to inverse of the within-study variance, but do not reflect the study weighting in the statistical model. Each fitted line was calculated using mixed effects meta-regression back transformed from the logit scale. *Adjusted mean proportion and their 95%CI estimates were statistically adjusted for the presence of factors in the mixed-effects model including year, clinical setting and imaging observation window held constant at their means. †Significant influence (p <0.05) for each factor in the adjusted
Supplemental material
(separate file)
Appendix 1. MEDLINE search string
Appendix 2. Imaging proportion for all studies grouped by care setting and image type listed by descending date order of mid-point in data collection
Appendix 3. Sensitivity analyses for current imaging proportions based on summary risk of bias
*No study scored high for summary risk of bias in the Emergency care setting †Total between group
difference (mixed effects analysis)
Appendix 4. Association of study-level factors on imaging proportion for all studies (univariate analysis)
*Extreme outlier studies were excluded from each regression analysis based on a plot of standardised shrunken residuals †Proportion of imaging for each factor in the univariate model).
Checklists
(separate file)
Table1. Characteristics of included studies Citation Sampling
frame
Study design Data source Geographic region Clinical setting(s) Clinical presentation Study n
Imaging count (Request/Event) with imaging proportions per modality
(%) Age range Mean age (SD) % female Summary risk of bias score XR CT MRI U/S B/S
Allen, 201431 2001-09 Retrospective time series W/C database N. America GP, PT, Ch LBP±radicular 10406 E: 35.3 2.7 11.5 0.6 - - 49.4 23.8 mod
Ammendolia, 200732 2004 Prospective cohort study Medical records* N. America Ch LBP 448 R: 12.3 - - - - >18 39.2 (13.6) 43.0 mod
Blackmore, 201133 2003-05 Retrospective review Health insurer N. America GP, ED LBP 4605 E: - - 12.0 - - - - - mod
Britt, 201434 2002-05 Prospective cohort study BEACH study Oceania GP LBP 11146 R: 10.5 4.7 0.2 0.4 0.3 All - 51.7 low
Britt, 201434 2009-12 Prospective cohort study BEACH study Oceania GP LBP 10584 R: 9.1 6.1 0.8 0.6 0.2 All - 55.3 low
Carey, 201535 2010 Patient survey Patient interview Oceania GP LBP 211 E: 56.9 45.0 35.1 - - >18 - 61.0 high
Charlesworth, 201636 2013 Retrospective review Oregon APAC claims N. America GP LBP 101530 E: 17.0 - 18-64 - - high
Childs, 201537 2007-13 Retrospective review MHS Reporting Tool N. America GP LBP 753450 E: - - 11.7 - - 18-60 36.9 (12.5) 46.8 mod
Crow, 200938 2002-05 Retrospective review Medical records N. America OHD LBP 2030 E: 66.5 - 2.6 - - 10-90 43.0 64.5 high
Dey, 20047 1999 RCT (control arm) Medical records UK GP LBP 1138 R: 13.7 - - - - 18-64 41.3 (12.5) 54.3 high
Feuerstein, 200439 1997 Patient survey MEPS 1997 survey N. America GP LBP 1082 E: 21.0 - - - - 18-64 - - mod
Friedman, 201040 2002-06 Retrospective review NHAMCS database N. America ED LBP±radicular 4377 E: 30.5 - - - - ≥14 40.0 51.2 low
Fritz, 200842 2003-05 Retrospective review IHC Rehab. Database N. America PT LBP 471 E: 9.8 1.4 13.8 - - 18-60 41.2 (11.0) 53.9 high
Fritz, 201341 2004-08 Retrospective review IHC Rehab. Database N. America PT LBP 4368 E: 23.0 - - - - >18 39.9 (12.3) 50.1 mod
Fritz, 201643 2012-13 Retrospective review IHC Rehab. Database N. America GP, Ch, PT,
Physiatry
LBP 747 E: 32.6 - - - - 18-60 38.2 (10.7) 61.2 mod
Ganduglia, 201544 2008 Retrospective review BCBSTX database N. America OHD LBP 645423 E: - - 14.5 - - 18-64 - - high
Ganduglia, 201544 2011 Retrospective review BCBSTX database N. America OHD LBP 749391 E: - - 14.6 - - 18-64 - - high
Gonzalez-Urzelai, 200345 1998-99 Prospective cohort study Medical records Europe GP LBP±radicular 105 E: 18 - - - - 18-65 45.0 (12.9) 59.1 mod
Graves, 201246 2002-04 Prospective cohort study D-RISC W/C database N. America GP, ED, PT, Ch, Ost
LBP±radicular 1226 E: - - 18.6 - - >18 - 29.0 high
Graves, 201447 2002-04 Prospective cohort study D-RISC W/C database N. America GP, ED, PT, Ch, Ost
LBP±radicular 1770 E: 30.4 5.4 19.0 - - >18 - 32.0 high
Hong, 201714 2010-14 Retrospective review Optum Insight N. America GP, Ch LBP 1547870 E: 21.5 6.8 - - 18-64 - 54.8 low
Isaacs, 200448 1998-00 Retrospective review NHAMCS N. America ED LBP 3074500 E: 17.8 4.3 0.7 - - 18-70 - 58.7 mod
Jackson, 200549 1995-97 Retrospective review NAMCS N. America GP LBP 10255661 E: 19.3 - - - - 20-55 39.3 50.0 mod
Kerry, 20028 1996-98 Prospective cohort study Medical records UK GP LBP 427 R: 22.3 - - - - 18-64 41.1 (11.8) 54.1 high
Kost, 201550 2011 Before and after study
(before arm extracted)
Kovacs, 200651 2003-04 Prospective cohort study Medical records Europe GP LBP 648 R: 15.6 2.2 2.5 - - ≥18 46.5 (15.5) 52.2 low
Licciardone, 200852 2003 Retrospective review NAMCS N. America GP LBP 253 E: 22.5 9.5 All - - low
Lin, 201653 2011 Before and after study Medical records Oceania GP LBP 77 R: 34 - - - - - mod
Love, 200554 1998 Retrospective review NZ ACC (W/C) Oceania GP LBP 129079 E: 12.1 - - - - - - - high
May, 201655 2013-14 Prospective cohort study Clinical encounter N. America GP LBP 55 R: - - 27 - - 48 48 .0 0.0 mod
Michaleff, 201256 2000-10 Prospective cohort study BEACH study Oceania GP LBP 5675 R: 19.2 4.2 All - - low
Muntion-Alfaro, 200657 2003 Retrospective review Medical records Europe GP LBP 538 R: 23.4 - - - - All 48.3 53.2 mod
Nelson, 200558 1997-01 Retrospective review Health insurer N. America GP, Ch LBP 1709685 E: 31.8 9.0 - - All 34.0 (21.0) 52.0 mod
Nunn, 201759 2009-15 Retrospective review Medical records N. America ED LBP 325 E: 27.4 5.2 - - ≥16 43.0 (20.0) 55.1 low
Pham, 200960 2000-06 Retrospective review Medicare database N. America GP LBP 35039 E: 24.0 3.9 - - ≥65 - 69.3 high
Rao, 201561 2013 Retrospective review Medical records N. America ED, OHD LBP 100 E: 7 5 12 - - 5-96 48.0 50.0 low
Rizzardo, 201662 2013 Retrospective review Medical records Europe ED LBP±radicular 1289 E: 41.0 2.6 1.4 - - All 63.5 49.0 mod
Rosenberg, 201563 2010-13 Retrospective review Medical records N. America GP, ED LBP 206080 E: 53.4 19-50 - - mod
Salacka, 200964 2006-08 Retrospective review Medical records Europe GP LBP 648 E: 19.3 - - - - 19-60 - 58.3 high
Schlemmer, 201565 2011-12 Retrospective review BCBSM database N. America ED LBP 14838 E: 26.3 4.4 3.5 - - 18-64 - 52.8 low
Tacci, 199966 1995 Retrospective review W/C database N. America GP LBP 98 E: 56 - - - - 16-61 34.0 (11.0) 27.5 high
Tan, 201610 2007-11 Retrospective review Medicare database N. America GP LBP 145320 E: 27.2 27.2 - - >65 - - mod
Thackeray, 201767 2012-13 Retrospective review UUHP database N. America GP LBP 454 E: 16.5 4.6 - - 17-60 40.4 (12.0) 70.7 mod
Walker, 201768 2011 Retrospective review Health insurer Europe GP LBP 14358 E: 17.8 2.9 - - 18-50 36.3 49.5 high
Weiner, 199969 1995 Retrospective review Medical records N. America ED LBP 214 E: 18.7 - - - - ≥16 - - low
Williams, 20109 2001-04 Prospective cohort study BEACH study Oceania GP LBP 1830 R: 20.2 3.7 0.2 0.6 0.7 All 54.3 - low
Williams, 20109 2005-08 Prospective cohort study BEACH study Oceania GP LBP 1706 R: 19.6 6.2 0.1 1.1 0.1 All 56.0 - low
Wilson, 200170 1994-95 Survey Patient interview N. America GP LBP 522 E: 26 24 8 - - - 64 (14) 54.0 mod
Shaded cells = Combined imaging reported
Table 2. Risk of bias assessment
Study 1.
Ta rg et po p ul atio n ap proxi ma te s ty pi ca l n atio na l po pu la tio n see ki ng c are for L BP * 2. R eprese nta tiv e sa m pl ing fr ame 3. R an do m s ele ctio n/c en su s u sed 4. M in ima l n o n -re sp on se bi as 5. A pp ro pri ate mo
de of d
at a c o lle ctio n 6. A cc ept abl e ca se def in it io n 7. A pp ro pri ate stu dy in str umen t 8. Sa me mo
de of d
ata c o lle ctio n f or a ll 9. A pp ro pri ate del ay bet ween i nd ex vis it a nd re fer ra l* 10. A pp ro pri ate nu mer ator/ den omi na tor Summary risk of bias
Allen, 201431 - + + + + + + + + + Moderate
Ammendolia, 200732 - + + - + + + + + + Moderate
Blackmore, 201133 + + + - + + + + - + Moderate
Britt, 201434 + + + - + + + + + + Low
Carey, 201535 + + - + - - + + - + High
Charlesworth, 201636
+ - + + + - + + - + High
Childs, 201537 + - + + + + + + - + Moderate
Crow, 200938 + - + + + + + + - + High
Dey, 20047 - + + + + - + + - + High
Feuerstein, 200439 + - + - - - - + - + Moderate
Friedman, 201040 + + + + + + + + + + Low
Fritz, 200842 - + + + + - - + - + High
Fritz, 201341 + - + + + + + + - + Moderate
Fritz, 201643 - - + + + + + + - + Moderate
Ganduglia, 201544 - - + + + - + + - + High
Gonzalez-Urzelai, 200345
- + + + + + + + + + Moderate
Graves, 201246 - - - - + - + + - + High
Graves, 201447 - + - - + - + + - + High
Hong, 201714 + - + + + + + + + + Low
Isaacs, 200448 + - + + + - + + + + Moderate
Jackson, 200549 + - + + + + + + - + Moderate
Kerry, 20028 - - - + + - + + + + High
Kost, 201550 + - + + + + + + - + Moderate
Kovacs, 200651 + - + - + - + + + + Low
Licciardone, 200852 + + + + + + + + + - Low
Lin, 201653 - - + + + + + + - + Moderate
Love, 200554 - + + + + - + + - + High
May, 201655 - - + + + - + + + + Moderate
Michaleff, 201256 + + + - + - + + + + Low
Muntion-Alfaro, 200657
+ + + + + + + + - + Moderate
Nelson, 200558 - - + + + + + - - + Moderate
Nunn, 201759 + - + + + + + + + + Low
Pham, 200960 - + + + + + + + - + High
Rao, 201561 + + + + + - + + + + Low
Rizzardo, 201662 + - - - + + + + + + Moderate
Rosenberg, 201563 + + + + + + + + - + Moderate
Salacka, 200964 - + + - + - + + - + High
Schlemmer, 201565 + + + + + + + + + + Low
Tacci, 199966 - - + + + + + + + + High
Tan, 201610 - - + + + + + + + + Moderate
Thackeray, 201767 + + + + + + + + + + Moderate
Walker, 201768 - - - + + + + + - + High
Weiner, 199969 + + + + + + + + + + Low
Williams, 20109 + + + + + + + + + + Low
Wilson, 200170 - + + + - - - + + + Moderate
*Modification was made to two of the original 10 items:19 The definition of the target population (item 1) was modified to include only patients seeking care for LBP. We did not downgrade for geographic location or single health insurer. The length of the shortest prevalence period (item 9) was modified to the delay between index visit and referral/imaging event (low risk ≤4weeks)
Table 3. Pre-specified study-level factors
Factor
Variable
type Categories
Data available (%)
Year* continuous (midpoint date of study sample frame) 100
Clinical setting* categorical primary care; emergency care 100
Study design categorical prospective; retrospective 100
Data source categorical clinical encounter; insurer data; patient survey 100
Imaging count method categorical imaging event; imaging request 100
Geographic region categorical North America; Europe; Oceania; United Kingdom 100
Imaging observation window* categorical Imaging with 4w; imaging within study period 100
Imaging at first consultation categorical first; subsequent; any consultation 96
Workers’ compensation† categorical yes; no 64
Duration of episode† categorical <3 months; ≥3 months 40
Older age (>64y)† categorical yes; no 38
Radicular syndrome† categorical yes; no 36
References
1. Hoy D, Bain C, Williams G, March L, Brooks P, Blyth F, et al. A systematic review of the global prevalence of low back pain. Arthritis Rheum 2012;64:2028-37.
2. Trompeter K, Fett D, Platen P. Prevalence of Back Pain in Sports: A Systematic Review of the Literature. Sports Med 2017;47:1183-207.
3. Henschke N, Maher CG, Refshauge KM, Herbert RD, Cumming RG, Bleasel J, et al. Prevalence of and screening for serious spinal pathology in patients presenting to primary care settings with acute low back pain. Arthritis Rheum 2009;60:3072-80.
4. NICE. National Institute for Health and Care Excellence. Non-specific low back pain and sciatica: management. NICE guideline NG59. 2016.
5. Foster NE, Anema JR, Cherkin D, Chou R, Cohen SP, Gross DP, et al. Prevention and treatment of low back pain: evidence, challenges, and promising directions. The Lancet 2018. 6. Chou R, Qaseem A, Owens DK, Shekelle P. Diagnostic imaging for low back pain: Advice
for high-value health care from the American college of physicians. Ann Intern Med
2011;154:181-9.
7. Dey P, Simpson CW, Collins SI, Hodgson G, Dowrick CF, Simison AJ, et al. Implementation of RCGP guidelines for acute low back pain: a cluster randomised controlled trial. Br J Gen Pract 2004;54:33-7.
8. Kerry S, Hilton S, Dundas D, Rink E, Oakeshott P. Radiography for low back pain: a randomised controlled trial and observational study in primary care. Br J Gen Pract
2002;52:469-74.
9. Williams CM, Maher CG, Hancock MJ, McAuley JH, McLachlan AJ, Britt H, et al. Low back pain and best practice care: A survey of general practice physicians. Arch Intern Med
2010;170:271-7.
10. Tan A, Zhou J, Kuo YF, Goodwin JS. Variation among Primary Care Physicians in the Use of Imaging for Older Patients with Acute Low Back Pain. J Gen Intern Med 2016;31:156-63. 11. Colla CH, Morden NE, Sequist TD, Mainor AJ, Li Z, Rosenthal MB. Payer Type and
Low-Value Care: Comparing Choosing Wisely Services across Commercial and Medicare Populations. Health Serv Res 2017.
12. Pathirana T, Clark J, Moynihan R. Mapping the drivers of overdiagnosis to potential solutions. BMJ 2017;358:j3879.
13. Gidwani R, Sinnott P, Avoundjian T, Lo J, Asch SM, Barnett PG. Inappropriate ordering of lumbar spine magnetic resonance imaging: are providers Choosing Wisely? Am J Manag Care 2016;22:e68-76.
14. Hong AS, Ross-Degnan D, Zhang F, Frank Wharam J. Small decline in low-value back imaging associated with the 'choosing wisely' campaign, 2012-14. Health Aff (Millwood)
2017;36:671-9.
15. NSW Agency for Clinical Innovation. Management of people with acute low back pain: model of care. Chatswood, NSW Health. 2016.
16. Liberati A, Altman DG, Tetzlaff J, Mulrow C, Gotzsche PC, Ioannidis JP, et al. The PRISMA statement for reporting systematic reviews and meta-analyses of studies that evaluate
healthcare interventions: explanation and elaboration. BMJ 2009;339:b2700. 17. Stroup DF, Berlin JA, Morton SC, et al. Meta-analysis of observational studies in
epidemiology: A proposal for reporting. JAMA 2000;283:2008-12.
18. Bigos S, Bowyer O, Braen G. Acute low back pain problems in adults. Clinical practice guideline. Washington, D.C.: Agency for Health Care Policy and Research, Public Health Service, U.S. Department of Health and Human Services; 1994.
19. Hoy D, Brooks P, Woolf A, Blyth F, March L, Bain C, et al. Assessing risk of bias in prevalence studies: modification of an existing tool and evidence of interrater agreement. J Clin Epidemiol 2012;65:934-9.
20. Hunter JE, Schmidt FL. Fixed Effects vs. Random Effects Meta-Analysis Models: Implications for Cumulative Research Knowledge. Int J Sel Assess 2000;8:275-92.
21. Borenstein M, Hedges LV, Higgins JP, Rothstein HR. Introduction to Meta-Analysis, Ch13. John Wiley & Sons, Ltd; 2009.
22. West SL, Gartlehner G, Mansfield AJ, Poole C, Tant E, Lenfestey N, et al. AHRQ Methods for Effective Health Care. Comparative Effectiveness Review Methods: Clinical
23. Rucker G, Schwarzer G, Carpenter JR, Schumacher M. Undue reliance on I(2) in assessing heterogeneity may mislead. BMC Med Res Methodol 2008;8:79.
24. Higgins JP. Commentary: Heterogeneity in meta-analysis should be expected and appropriately quantified. Int J Epidemiol 2008;37:1158-60.
25. Guyatt GH, Oxman AD, Vist GE, Kunz R, Falck-Ytter Y, Alonso-Coello P, et al. GRADE: an emerging consensus on rating quality of evidence and strength of recommendations. BMJ
2008;336:924-6.
26. Iorio A, Spencer FA, Falavigna M, Alba C, Lang E, Burnand B, et al. Use of GRADE for assessment of evidence about prognosis: rating confidence in estimates of event rates in broad categories of patients. BMJ 2015;350:h870.
27. Thompson SG, Higgins JP. How should meta-regression analyses be undertaken and interpreted? Stat Med 2002;21:1559-73.
28. Williams R. Using the margins command to estimate and interpret adjusted predictions and marginal effects. The STATA Journal 2012;12:308-31.
29. Higgins JP, Thompson SG. Controlling the risk of spurious findings from meta-regression.
Stat Med 2004;23:1663-82.
30. Harbord RM, Higgins JP. Meta-regression in Stata. The STATA Journal 2008;8:493-519. 31. Allen H, Wright M, Craig T, Mardekian J, Cheung R, Sanchez R, et al. Tracking Low Back
Problems in a Major Self-Insured Workforce. J Occup Environ Med 2014;56:604-20. 32. Ammendolia C, Cote P, Hogg-Johnson S, Bombardier C. Do chiropractors adhere to
guidelines for back radiographs? A study of chiropractic teaching clinics in Canada. Spine (Phila Pa 1976) 2007;32:2509-14.
33. Blackmore CC, Mecklenburg RS, Kaplan GS. Effectiveness of clinical decision support in controlling inappropriate imaging. J Am Coll Radiol 2011;8:19-25.
34. Britt H, GC M, Valenti L, Henderson J, Gordon J, Pollack A, et al. Evaluation of imaging ordering by general practitioners in Australia, 2002–03 to 2011–12. Sydney: Sydney University Press; 2014.
35. Carey M, Turon H, Goergen S, Sanson-Fisher R, Yoong SL, Jones K. Patients' experiences of the management of lower back pain in general practice: use of diagnostic imaging, medication and provision of self-management advice. Aust J Prim Health 2015;21:342-6.
36. Charlesworth CJ, Meath THA, Schwartz AL, McConnell KJ. Comparison of low-value care in medicaid vs commercially insured populations. JAMA Intern Med 2016;176:998-1004. 37. Childs JD, Fritz JM, Wu SS, Flynn TW, Wainner RS, Robertson EK, et al. Implications of
early and guideline adherent physical therapy for low back pain on utilization and costs. BMC Health Serv Res 2015;15:150.
38. Crow WT, Willis DR. Estimating cost of care for patients with acute low back pain: a retrospective review of patient records. J Am Osteopath Assoc 2009;109:229-33.
39. Feuerstein M, Marcus SC, Huang GD. National trends in nonoperative care for nonspecific back pain. Spine J 2004;4:56-63.
40. Friedman BW, Chilstrom M, Bijur PE, Gallagher EJ, Friedman BW, Chilstrom M, et al. Diagnostic testing and treatment of low back pain in United States emergency departments: a national perspective. Spine (Phila Pa 1976) 2010;35:E1406-11.
41. Fritz JM, Brennan GP, Hunter SJ, Magel JS. Initial management decisions after a new consultation for low back pain: Implications of the usage of physical therapy for subsequent health care costs and utilization. Arch Phys Med Rehabil 2013;94:808-16.
42. Fritz JM, Cleland JA, Speckman M, Brennan GP, Hunter SJ. Physical therapy for acute low back pain: Associations with subsequent healthcare costs. Spine (Phila Pa 1976)
2008;33:1800-5.
43. Fritz JM, Kim J, Dorius J. Importance of the type of provider seen to begin health care for a new episode low back pain: Associations with future utilization and costs. J Eval Clin Pract
2016;22:247-52.
44. Ganduglia CM, Zezza M, Smith JD, John SD, Franzini L. Effect of Public Reporting on MR Imaging Use for Low Back Pain. Radiology 2015;276:175-83.
45. Gonzalez-Urzelai V, Palacio-Elua L, Lopez-de-Munain J. Routine primary care management of acute low back pain: adherence to clinical guidelines. Eur Spine J 2003;12:589-94.
47. Graves JM, Fulton-Kehoe D, Jarvik JG, Franklin GM. Health care utilization and costs associated with adherence to clinical practice guidelines for early magnetic resonance imaging among workers with acute occupational low back pain. Health Serv Res
2014;49:645-65.
48. Isaacs DM, Marinac J, Sun C. Radiograph use in low back pain: A United States Emergency Department database analysis. J Emerg Med 2004;26:37-45.
49. Jackson JL, Browning R, Jackson JL, Browning R. Impact of national low back pain guidelines on clinical practice. South Med J 2005;98:139-43.
50. Kost A, Genao I, Lee JW, Smith SR. Clinical decisions made in primary care clinics before and after choosing wisely. J Am Board Fam Med 2015;28:471-4.
51. Kovacs FM, Fernandez C, Cordero A, Muriel A, Gonzalez-Lujan L, Gil Del Real MT. Non-specific low back pain in primary care in the Spanish National Health Service: A prospective study on clinical outcomes and determinants of management. BMC Health Serv Res 2006;6 (no pagination).
52. Licciardone JC. The epidemiology and medical management of low back pain during ambulatory medical care visits in the United States. Osteopath Med Prim Care 2008;2:11. 53. Lin IB, Coffin J, O'Sullivan PB. Using theory to improve low back pain care in Australian
Aboriginal primary care: a mixed method single cohort pilot study. BMC Fam Pract
2016;17:44.
54. Love T, Crampton P, Salmond C, Dowell AC. Patterns of medical practice variation: Variability in referral for back pain by New Zealand general practitioners. N Z Med J
2005;118.
55. May L, Franks P, Jerant A, Fenton J. Watchful Waiting Strategy May Reduce Low-Value Diagnostic Testing. J Am Board Fam Med 2016;29:710-7.
56. Michaleff ZA, Harrison C, Britt H, Lin CWC, Maher CG. Ten-year survey reveals differences in GP management of neck and back pain. Eur Spine J 2012;21:1283-9.
57. Muntion-Alfaro MT, Benitez-Camps M, Bordas-Julve JM, De Gispert-Uriach B, Zamora-Sanchez V, Galindo-Parres C. Back pain: Do we follow the recommendations of the guidelines?. [Spanish]. Aten Primaria 2006;37:215-20.
58. Nelson CF, Metz RD, LaBrot T. Effects of a managed chiropractic benefit on the use of specific diagnostic and therapeutic procedures in the treatment of low back and neck pain. J Manipulative Physiol Ther 2005;28:564-9.
59. Nunn ML, Hayden JA, Magee K. Current management practices for patients presenting with low back pain to a large emergency department in Canada. BMC Musculoskelet Disord
2017;18 (1) (no pagination).
60. Pham HH, Landon BE, Reschovsky JD, Wu B, Schrag D. Rapidity and modality of imaging for acute low back pain in elderly patients. Arch Intern Med 2009;169:972-81.
61. Rao S, Rao S, Harvey HB, Avery L, Saini S, Prabhakar AM. Low back pain in the emergency department-are the ACR Appropriateness Criteria being followed? J Am Coll Radiol
2015;12:364-9.
62. Rizzardo A, Miceli L, Bednarova R, Guadagnin GM, Sbrojavacca R, Rocca GD. Low-back pain at the emergency department: Still not being managed? Ther Clin Risk Manag
2016;12:183-7.
63. Rosenberg A, Agiro A, Gottlieb M, Barron J, Brady P, Liu Y, et al. Early Trends Among Seven Recommendations From the Choosing Wisely Campaign. JAMA Intern Med
2015;175:1913-20.
64. Salacka A, Hornowska I, Pozniak J, Kotkowiak L, Michon P. Acute back pain syndrome in family doctor's practice. [Polish]. Family Medicine and Primary Care Review 2009;11:479-80.
65. Schlemmer E, Mitchiner JC, Brown M, Wasilevich E. Imaging during low back pain ED visits: A claims-based descriptive analysis. Am J Emerg Med 2015;11.
66. Tacci JA, Webster BS, Hashemi L, Christiani DC. Clinical practices in the management of new-onset, uncomplicated, low back workers' compensation disability claims. J Occup Environ Med 1999;41:397-404.
68. Walker J, Mertens UK, Schmidt CO, Chenot JF. Effect on healthcare utilization and costs of spinal manual therapy for acute low back pain in routine care: A propensity score matched cohort study. PLoS One 2017;12 (5) (no pagination).
69. Weiner AL, MacKenzie RS. Utilization of lumbosacral spine radiographs for the evaluation of low back pain in the emergency department. J Emerg Med 1999;17:229-33.
70. Wilson IB, Dukes K, Greenfield S, Kaplan S, Hillman B. Patients' role in the use of radiology testing for common office practice complaints. Arch Intern Med 2001;161:256-63.
71. Azhar B, Patel SR, Holt PJ, Hinchliffe RJ, Thompson MM, Karthikesalingam A.
Misdiagnosis of ruptured abdominal aortic aneurysm: systematic review and meta-analysis. J Endovasc Ther 2014;21:568-75.
72. Leveridge M, D'Arcy FT, O'Kane D, Ischia JJ, Webb DR, Bolton DM, et al. Renal colic: current protocols for emergency presentations. Eur J Emerg Med 2016;23:2-7.
73. Blecher G, Meek R, Egerton-Warburton D, McCahy P. Introduction of a new imaging guideline for suspected renal colic in the ED reduces CT urography utilisation. Emerg Med J
2017;34:749-54.
74. Srinivas SV, Deyo RA, Berger ZD. Application of "less is more" to low back pain. Arch Intern Med 2012;172:1016-20.
75. Chou R, Fu R, Carrino JA, Deyo RA. Imaging strategies for low-back pain: systematic review and meta-analysis. The Lancet 2009;373:463-72.
76. Morrisroe K, Nakayama A, Soon J, Arnold M, Barnsley L, Barrett C, et al. EVOLVE: The Australian Rheumatology Association's 'top five' list of investigations and interventions doctors and patients should question. Intern Med J 2018;48:135-43.
77. Deyo RA, Mirza SK, Turner JA, Martin BI. Overtreating chronic back pain: time to back off?
J Am Board Fam Med 2009;22:62-8.
78. Jenkins HJ, Hancock MJ, French SD, Maher CG, Engel RM, Magnussen JS. Effectiveness of interventions designed to reduce the use of imaging for low-back pain: a systematic review.
JAMA 2015;187:401-8.
79. Wall BF, Kendall GM, Edwards AA, Bouffler S, Muirhead CR, Meara JR. What are the risks from medical X-rays and other low dose radiation? Br J Radiol 2006;79:285-94.
80. Berrington de González A, Mahesh M, Kim K, et al. Projected cancer risks from computed tomographic scans performed in the united states in 2007. Arch Intern Med 2009;169:2071-7. 81. Saini V, Garcia-Armesto S, Klemperer D, Paris V, Elshaug AG, Brownlee S, et al. Drivers of
poor medical care. The Lancet 2017;390:178-90.
82. Darlow B, Forster BB, O'Sullivan K, O'Sullivan P. It is time to stop causing harm with inappropriate imaging for low back pain. Br J Sports Med 2017;51:414-5.
83. Webster BS, Bauer AZ, Choi Y, Cifuentes M, Pransky GS. Iatrogenic consequences of early magnetic resonance imaging in acute, work-related, disabling low back pain. Spine (Phila Pa 1976) 2013;38:1939-46.
84. Flynn TW, Smith B, Chou R. Appropriate use of diagnostic imaging in low back pain: a reminder that unnecessary imaging may do as much harm as good. J Orthop Sports Phys Ther
2011;41:838-46.
85. Jarvik JG, Hollingworth W, Martin B, et al. Rapid magnetic resonance imaging vs radiographs for patients with low back pain: A randomized controlled trial. JAMA
2003;289:2810-8.
86. Brownlee S, Chalkidou K, Doust J, Elshaug AG, Glasziou P, Heath I, et al. Evidence for overuse of medical services around the world. The Lancet 2017;390:156-68.
87. Buchbinder R, van Tulder M, Öberg B, Costa LM, Woolf A, Schoene M, et al. Low back pain: a call for action. The Lancet 2018.
88. Maher C, Underwood M, Buchbinder R. Non-specific low back pain. The Lancet
2017;389:736-47.
89. Government of Western Australia Department of Health: Diagnostic Imaging Pathways - Low Back Pain.2018 (Accessed December 2018). Available from:
http://www.imagingpathways.health.wa.gov.au/index.php/imaging-pathways/musculoskeletal-trauma/musculoskeletal/low-back-pain#pathway.
91. Grunau GL, Darlow B, Flynn T, O'Sullivan K, O'Sullivan PB, Forster BB. Red flags or red herrings? Redefining the role of red flags in low back pain to reduce overimaging. Br J Sports Med 2018;52:488-9.
92. Jenkins HJ, Hancock MJ, Maher CG, French SD, Magnussen JS. Understanding patient beliefs regarding the use of imaging in the management of low back pain. Eur J Pain
2016;20:573-80.
93. Mitchell JM. Utilization Trends for Advanced Imaging Procedures: Evidence From Individuals With Private Insurance Coverage in California. Med Care 2008;46:460-6. 94. Min A, Chan VWY, Aristizabal R, Peramaki ER, Agulnik DB, Strydom N, et al. Clinical
Decision Support Decreases Volume of Imaging for Low Back Pain in an Urban Emergency Department. J Am Coll Radiol 2017;14:889-99.
95. Khorasani R, Hentel K, Darer J, Langlotz C, Ip IK, Manaker S, et al. Ten commandments for effective clinical decision support for imaging: enabling evidence-based practice to improve quality and reduce waste. AJR Am J Roentgenol 2014;203:945-51.
96. Massat MB. Artificial intelligence in radiology: Hype or hope? Appl Radiol 2018;March. 97. Pons E, Braun LM, Hunink MG, Kors JA. Natural Language Processing in Radiology: A
Systematic Review. Radiology 2016;279:329-43.