Magnetic Properties of Cu
1-x
Zn
x
Fe
2
O
4
Ferrites with the
Variation of Zinc Concentration
Shahida Akhter1*, Deba Prasad Paul1, Md. Abdul Hakim2, Shireen Akhter2, Sheikh Manjura Hoque2, Hari Narayan Das2
1Department of Physics, University of Chittagong, Chittagong, Bangladesh 2Materials Science Division, Atomic Energy Centre, Dhaka, Bangladesh
Email: *shahida212@yahoo.com
Received December 30,2011; revised January 16, 2012; accepted February 6, 2012
ABSTRACT
Cu-Zn ferrite with general formula of Cu1-xZnxFe2O4 with a range from x = 0.0 to 0.7 (in steps of 0.1) was prepared by
using standard ceramic techniques. The confirmation of single-phase formation was carried out by employing X-ray diffraction technique. Some of the magnetic properties were measured, such as Curie temperature, the complex perme-ability and low field hysteresis loop. It was found that Curie temperature Tc decreases from 464˚C to 20˚C. The real part
of initial permeability, μ′ increase with increasing Zn contents up to x = 0.5 after that it decreases with higher Zn con-tent. Low field hysteresis measurement was carried out at room temperature and this measurement with the increase of Zn2+ ions yields the increase of saturation magnetic induction (B
v) and magnetic remanance (Br) up to x = 0.4 thereafter
it decreases. The decrease in corecivity (Hc) and hysteresis loss is observed for all samples. In view of this, the possible
changes in magnetic properties with the increase in Zn concentration are undertaken.
Keywords: XRD; Curie Temperature; Initial Permeability; Hysteresis Loop; Coercivity
1. Introduction
Ferrites have been the subject of extensive study because of their wide range of application from microwave to radio frequency and of their importance in understanding the theories of magnetism. Various substitutions have been incorporated to achieve desired electrical and mag- netic properties. Useful frequency range of ferrite is li- mited by the onset of resonance phenomenon for which either the permeability begins to fall at a critical fre- quency or the losses rise sharply. Hence the knowledge of the frequency dependence of the initial permeability and loss is necessary. Cu-ferrite and Cu-containing fer-rites form an interesting group of ferfer-rites because of their typical electrical and magnetic properties and change in crystal structure on thermal treatment [1]. Zn-substituted Cu-ferrites have been commercially used for many years as high-frequency devices such as radio frequency coil, transformer cores, rod antenna etc. [2]. Some physical, magnetic and transport properties of Zn substituted in ferrite has been extensively studied by different resear- chers [3-6]. As this parameter plays an important role in technology, therefore we aim to study the effect of Zn2+
ion substitution on the magnetic properties such as Curie temperature, complex permeability spectra and low field hysteresis loop in Cu-Zn ferrite in this communication.
2. Experimental
The Cu-Zn ferrite with composition Cu1-xZnxFe2O4 (where
x = 0.0, 0.1, 0.2, 0.3, 0.4, 0.5, 0.6, 0.7) were prepared by the standard ceramic technique. The mixture of powder oxides CuO, ZnO and Fe2O4 were dried and mixed
ac-cording to their molecular weight. Intimate mixing of the materials was carried out using mortar and pestle and then ball milled for 6 hours and the slurry was dried and pressed into disc shaped sample. The disc shaped sam-ples were pre-sintered at 850˚C for 4 hours. Final sinter-ing of the sample was carried at 950˚C for 4 hours. The structure of the sample was confirmed by the X-ray fraction method using PHILIPS X’Pert Pro X-ray dif-fractometer. Curie temperature measurement was per-formed by using WAYNE KERR impedance analyzer with a laboratory built oven and a thermocouple based thermometer. Complex permeability spectra of the toroid shaped samples was measured with 6500 B impedance analyzer at frequency range up to 15 MHz. Low field hysteresis loops were observed by B-H loop tracer at constant frequency f = 1000 Hz at room temperature.
3. Results and Discussion
3.1. XRD Analysis
The structural study is essential for optimizing the pro-
perties needed for various applications. A typical XRD pattern indicating (hkl) values of each peaks correspond- ing to the sample x = 0.1 of Cu1-xZnxFe2O4 is shown in
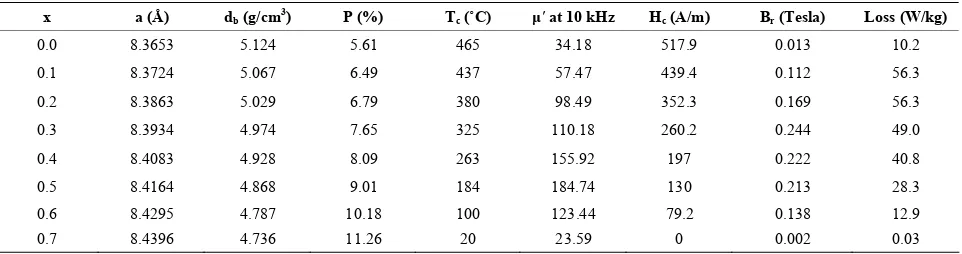
Figure 1. The XRD pattern of the sample, showing well- defined reflection without any ambignity, exhibits the formation of single phase cubic spinel structure. Using XRD data, the lattice constant was determined by the Nelson-Riley extrapolation method [7]. The variation of the lattice constant “a” as a function of Zn content is shown in Table 1 which is found to increase linearly with increasing Zn content obeying Vegard’s law [8]. This increase in the lattice constant can be attributed to the ionic size difference as substituted by large ionic size Zn2+ (0.82 Å) with that of Cu2+ ions (0.73 Å) [9]. A
similar linear variation has been observed in Zn-Mg [10], Li-Cd [11] and Cd-Zn [12]. Our experimental value of
lattice constant of the Cu-ferrite is 8.365 Å which is near to the literature value of 8.380 Å [13].
3.2. Curie Temperature Measurement
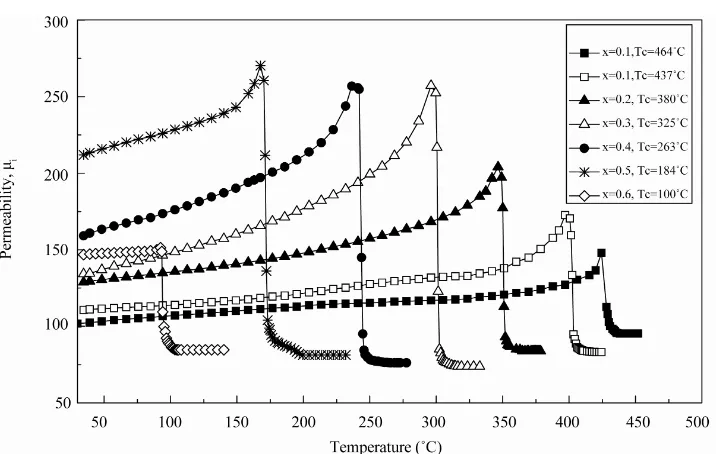
High initial permeability is often a technological require- ment of a ferrite at relatively low frequencies. The ther- mal variation of initial permeability, μi is shown in
Fig-ure 2 to find out the Curie temperature (Tc) for Cu-Zn
ferrite samples in shape of toroid. In general, it was found that the initial permeability increases with increase in temperature, while it falls abruptly close to the Curie point. The sharpness of the permeability drop at the Cu- rie point can be a measure of the homogeneity according to Globus et al. [14]. The present ferrites show good
homogeneity as shown in Figure 2 where an abrupt drop
20 30 40 50 60 70
0 100 200 300 400 500
Co
unts/
se
c
2degrees)
x=0.1
440 511
422 400
222 311
220
Figure 1. Typical XRD pattern of Cu1-xZnxFe2O4 for x = 0.1.
in permeability occurs near the Curie point.
The variation of μi with temperature can be expressed
as follows by Globus equation
2 s i
1 M D
μ
K
where K1
is anisotropy constant, Ms is saturation magnetization and
D is the average grain diameter. The K1 and Ms usually
decrease with increase of temperature which disturbs the alignment of magnetic moments. But decrease in K1 with
temperature is faster than that of Ms. When K1 reaches
zero, μi attains its maximum value according to the Glo-
bus equation and then drops off a minimum near the Cu- rie point. It is clearly seen that the curves show maxi- mum μi just below Tc and sharp decrease in μi is fol
lowed as the temperature is increased beyond Tc. Similar
phenomena were observed in Li-Cu [15], Cu-Zn [16] and Mg-Cu-Zn [17]. Curie temperature, Tc of the sample with
x = 0.7 has been determined from the temperature de- pendence of magnetization with an applied field 50 Oe using SQUID magnetometer since it is paramagnetic at room temperature (30˚C). Tc of this sample has been
taken as sharp fall of magnetization and was found 20˚C. This type of magnetic behaviour with high content of non-magnetic such as Zn and Cd is generally observed in Ni, Li and Mg based ferrites [18,19].
The Curie temperature of a ferrite is a temperature at which the material becomes paramagnetic. Curie tempe- ratures, Tc of the studied ferrite system has been deter-
mined from the i-T curves where Hopkinson type of
effect at the Tc has been observed with the menifestation
of sharp fall of permeability. From Table 1, a deceasing trend is observed with increasing Zn content. The linear decrease of Tc with increasing Zn content may be
ex-plained by modification of the A-B exchange interaction strength due to the change of the cation distribution be-tween A and B sites when non-magnetic Zn is substituted for Cu. Our experimental value of Tc for the Cu-ferrite is
470˚C which is in good agreement with the literature value of 455˚C [20].
3.3. Complex Permeability Spectra
Figures 3(a) and (b) show real (μ′) and imaginary (μ′′)
parts of the complex permeability in the range 1 kHz to 15 MHz, μ = μ′ – jμ′′ of different composition sintered at 950˚C for 4 hr. Figure 3(a) shows for real part of initial permeability flat profile from 1 kHz to 15 MHz for the Zn content of x = 0.0 - 0.3. For the compositions x = 0.4 to 0.7, μ′ is constant up to 9 MHz beyond which it falls slightly. The decrease of permeability implies onset of ferromagnetic resonance [21]. The fairly constant μ′ va- lues over a large frequency range show the compositional stability and quality of the ferrites prepared by solid state reaction. This is a desirable characterization for various applications such as broadband pulse transformers and wide band read-write heads for video recording.
In general, it is observed that the initial permeability remains almost constant up to certain lower range of fre- quency after which the initial permeability increases to a maximum value and then decreases slightly to a very low value. This phenomenon, known as dispersion of initial permeability, is attributed to either domain wall displace- ments or domain rotation or both of these contributions [22].It is known that the permeability of polycrystalline ferrite can be described as the superposition of domain wall motion and spin rotation components. At the low frequency range of 10 kHz - 1 MHz, domain wall motion plays a predominant role in the magnetizing process and loss mechanism. The high permeability values at low frequencies show the dominant role played by domain wall motion. Increasing the frequency, the wall motion is damped and becomes out of phase with the excitation field. The similar phenomenon is found in Ni-Zn ferrites [23] and Li-Zn [24].
[image:3.595.59.540.610.737.2]Figure 3(b) represents the imaginary part of initial permeability, μ′′(loss component) of the samples. It is observed that μ′′ increases with increasing frequency and takes a broad maximum at a certain frequency. This fea- ture is well known as the natural resonance. At the natu- ral resonance, the imaginary permeability has a maxi- mum value, shifted toward high frequency. The natural frequency of precession leads to the onset of resonance at lower frequency [25]. This leads to the onset of loss at lower frequency. The magnetic loss factor increases as
Table 1. Experimental results of Cu1-xZnxFe2O4 ferrites.
x a (Å) db (g/cm3) P (%) Tc (˚C) μ′ at 10 kHz Hc (A/m) Br (Tesla) Loss (W/kg)
0.0 8.3653 5.124 5.61 465 34.18 517.9 0.013 10.2 0.1 8.3724 5.067 6.49 437 57.47 439.4 0.112 56.3 0.2 8.3863 5.029 6.79 380 98.49 352.3 0.169 56.3
0.3 8.3934 4.974 7.65 325 110.18 260.2 0.244 49.0 0.4 8.4083 4.928 8.09 263 155.92 197 0.222 40.8 0.5 8.4164 4.868 9.01 184 184.74 130 0.213 28.3 0.6 8.4295 4.787 10.18 100 123.44 79.2 0.138 12.9
Figure 3. Variation of (a) real (b) imaginary part of the initial permeability.
the square of the frequency. Highest value of loss com- ponent of the complex permeability observes for x = 0.5 in the range of frequency under investigation.
3.4. Low Field Hysteresis Loop
The low field hysteresis loops of Cu-Zn ferrite at room temperature were measured at constant frequency of f = 1000 Hz by B-H loop tracer and presented in Figure 4. From the hysteresis curve, each loop clearly shows low coercivity, indicating that all the samples belong to the family of soft ferrites. The coercivity of magnetic mate-rial is the opposing magnetic field strength required to reduce remanent flux density, Br to zero. The retentivity
or remanent flux density, Br value of magnetic material is
the degree of residual magnetization when the saturation magnetic field (H) is reduced to zero. Figure 4 shows the decrease of corecivity (Hc) and hysteresis losses with Zn
content. Saturation magnetic induction (Bv) and magnetic
remanance (Br) increases up to x = 0.4 thereafter if de-
creases.
From Figure 5 it is evident that Hc is found a decreas-
ing trend while μ′ is increasing. Hc has the highest value
for x = 0.0 i.e. pure Cu-ferrite while lowest value of μ′.
This behaviour can be explained by Brown’s relation [26]: Hc = 2k1/μoMs, where k1 is anisotropy constant.
Again k1 is related with initial permeability (μ′) accord-
ing to Globus [14] equation: μ′ = MsD/k1. With the in-
crease of Zn content, the probability of Fe2+ formation
decreases which is the responsible of the decrease of anisotropy and hence increase of μ′ in ferrites. Thus the decrease of Hc and increase of μ′ for Zn content indicates
that k1 is dominant factor. Similar decrease of Hc was ob-
served by Noorhana Yahya et al. in Mg-Zn ferrites [27]
[image:4.595.311.532.317.467.2]and by S. A. Mazen in Li-Cu ferrites [28].
Figure 4. Low field B-H loop of Cu-Zn ferrites.
0.0 0.1 0.2 0.3 0.4 0.5 0.6 0.7 0.8 0
100 200 300 400 500 600
20 40 60 80 100 120 140 160 180 200
Zn content, x
C
or
ecivity,H
c
(A/
m
) Permeabil
ity
,
Figure 5. Variation of coercivity, Hc and permeability, μ′
with composition, x.
4. Conclusion
[image:4.595.318.525.468.623.2]temperature and no other peak superimposed upon a ge- neral rise, as the Curie temperature is approached. This behaviour is similar to the behaviour of a single domain. The sharp decrease of μi at T = Tc indicates that the sam-
ples have high homogeneity according to Globus. The Curie temperatures show decreasing trend with the Zn substitution. Initial permeability shows good low fre- quency stability for the samples with x = 0.0 - 0.3 but the compositions with higher values of x 0.3 obviously show relaxation resonance. Low field hysteresis loop shows a decreasing trend in corecivity and hysteresis loss with Zn contents due to increased magnetic softness.
5. Acknowledgements
The author (Shahida Akhter) is grateful to the “Banga- bandhu Fellowship on Science, Information and Tech- nology” fund of the People’s Republic of Bangladesh for granting her a Ph.D. fellowship for carrying out this work. She is also thankful to Bangladesh Atomic Energy Cen- tre for extending experimental facilities to carry out this work.
REFERENCES
[1] S. A. Patil, S. M. Otari, V. C. Mahajan, M. G. Patil, A. B. Patil, M. K. Soudagar, B. L. Patil and S. R. Sawant, “Structural, IR and Magnetisation Studies on La3+
Sub-stituted Copper Ferrite,” Solid State Communication, Vol. 78, No. 1, 1991, pp. 39-42.
doi:10.1016/0038-1098(91)90805-6
[2] E. E. Riches, “A Review of Materials and Applications,” Mills and Boon, London, 1972.
[3] S. C. Byeon, K. S. Gong, J. G. Park and W. N. Kang, “Origin of the Increase in Resistivity of Manganese-Zinc Ferrite Polycrystals with Oxygen Partial Pressure,” Jour-nal of Applied Physics, Vol. 81, No. 12, 1997, pp. 7835- 7941. doi:10.1063/1.365393
[4] M. Brofonik, A. Znidarsic and I. Zajc, “Highly Resistive Grain Boundaries in Doped Mn Zn Ferrites for High Fre-quency Power Supplies,” Journal of Applied Physics, Vol. 82, No. 1, 1997, p. 333.
[5] D. Ravinder, “Electrical Transport Properties of Cad-mium Substituted Copper Ferrites,” Materials Letters, Vol. 43, No. 3, 2000, pp. 129-138.
doi:10.1016/S0167-577X(99)00245-1
[6] K. Vijaya Kumar and D. Ravinder, “Electrical Conduc-tivity of Ni-Zn-Gd Ferrites,” Materials Letters, Vol. 52, No. 3, 2002, pp. 166-168.
doi:10.1016/S0167-577X(01)00385-8
[7] J. B. Nelson and D. P. Riley, “An Experimental Investi-gation of Extrapolation Methods in the Derivation of Ac-curate Unit-Cell Dimensions of Crystals,” Proceeding of Physical Society, Vol. 57, No. 3, 1945, p. 160.
doi:10.1088/0959-5309/57/3/302
[8] L. Vegard, “Zeitschrift Fur Physik a Hadrons and Nu-clei,” Physics and Astronomy, Vol. 5, 1921, p. 17.
[9] J. Smit and H. P. Wijn, “Ferrites,” Wiley, New York, 1959, p. 143.
[10] B. P. Ladgaonkar, P. N. Vasambekar and A. S. Vain-gankar, “Effect of Zn2+ and Nd3+ Substitution on
Mag-netisation and AC Susceptibility of Mg Ferrite,” Journal of Magnetism and Magnetic Materials, Vol. 210, No. 1-3, 2000, pp. 289-294. doi:10.1016/S0304-8853(99)00468-0 [11] S. S. Bellad, S. C. Watawe and B. K. Chougule, “Micro-
Structure and Permeability Studies of Mixed Li-Cd Fer-rites,” Journal of Magnetism and Magnetic Materials, Vol. 195, No. 1, 1999, pp. 57-64.
doi:10.1016/S0304-8853(98)01073-7
[12] F. C. Romejin, “Physical and Crystallographic Properties of Some Spinel,” Philips Research Reports, Vol. 8, 1953, pp. 304-342.
[13] I. P. Parkin, G. E. Eluin, A. V. Komarov, Q. T. Bui and Q. A. Pankhurst, “Self-Propagating High Temperature Syn-thesis of Hexagonal Ferrites MFe12O19 (M = Sr, Ba),”
Advanced Materials, Vol. 9, No. 8, 1997, pp. 643-645. doi:10.1002/adma.19970090811
[14] A. Globus, H. Pascard and V. J. Cagon, “Volume Effect in Photofield Emission from Metals,” Journal de Phy-sique Archives, Vol. 38, 1977, pp. 163-167.
doi:10.1051/jphys:01977003802016300
[15] S. Manjura Hoque, M. Samir Ullah, F. A. Khan, M. A. Hakim and D. K. Saha, “Structural and Magnetic Proper-ties of Li-Cu Mixed Spinel Ferrites,” Physica B: Con-densed Matter, Vol. 406, No. 9, 2011, pp. 1799-1804. doi:10.1016/j.physb.2011.02.031
[16] A. A. Sattar and M. A. Samy, “Effect of Sm Substitution on the Magnetic and Electrical Properties of Cu-Zn Fer-rite,” Journal of Materials Science, Vol. 37, No. 20, 2002, pp. 4499-4502. doi:10.1023/A:1020614300002
[17] M. Manjurul Haque, M. Huq and M. A. Hakim, “Influ-ence of CuO and Sintering Temperature on the Micro-structure and Magnetic Properties of Mg-Cu-Zn Ferrites,” Journal of Magnetism and Magnetic Materials, Vol. 320, No. 21, 2008, pp. 2792-2799.
doi:10.1016/j.jmmm.2008.06.017
[18] S. S. Bellad, S. C. Watawe, A. M. Shaikh and B. K. Chougule, “Cadmium Substituted High Permeability Lith-ium Ferrite,” Bulletin Materials Science, Vol. 23, No. 2, 2000, pp. 83-85. doi:10.1007/BF02706546
[19] S. Akhter and M. A. Hakim, “Magnetic Properties of Cad-mium Substituted Lithium Ferrites,” Materials Chemistry and Physics, Vol.120, No. 2-3, 2010, pp. 399-403. doi:10.1016/j.matchemphys.2009.11.023
[20] J. Smit and H. P. Wijn, “Ferrites,” Wiley, New York, 1959, p. 157.
[21] N. Bloembergen, “Magnetic Resonance in Ferrites,” Pro-ceedings of the Institute of Electronic and Radio Engi-neers, Vol. 44, 1956, p. 1259.
1959, p. 268.
[24] T. Nakamura, T. Miyamoto and Y. Yamada, “Complex Permeability Spectra of Polycrystalline Li-Zn Ferrite and Application to EM-Wave Absorber,” Journal of Magnet-ism and Magnetic Materials, Vol. 256, No. 1-3, 2003, pp. 340-347. doi:10.1016/S0304-8853(02)00698-4
[25] F. G. Brckman, P. H. Dowling and W. G. Steneck, “Di-mensional Effects Resulting from a High Dielectric Con-stant Found in a Ferromagnetic Ferrite,” Physics Review, Vol. 77, No. 1, 1950, pp. 85-93.
doi:10.1103/PhysRev.77.85
[26] J. M. D. Cocy, “Rare-Earth Permanent Magnetism,” John
Wiley and Sons, New York, 1996.
[27] N. Yahja, A. Salwani, A. A. Aziz, et al., “Synthesis and Charaterization of Magnesium Zinc Ferrites as Electro-magnetic Source,” American Journal of Engineering and Applied Sciences, Vol. 1, No. 1, 2008, pp. 53-56. doi:10.3844/ajeassp.2008.53.56
[28] S. A. Mazen and H. A. Dawoud, “Structure and Magnetic Properties of Li-Cu Ferrite,” Physica Status Solid (a), Vol. 172, No. 2, 1999, pp. 275-289.