ISSN Online: 2156-8278 ISSN Print: 2156-8251
DOI: 10.4236/ajac.2018.96024 Jun. 7, 2018 311 American Journal of Analytical Chemistry
Comparison of the Vibrational Spectra of
Copper Polysilicate, CuSiO
3
, with Those of the
Prototypic Copper Polygermanate, CuGeO
3
Marco Meibohm, Hans Hermann Otto
*Materials Science and Crystallography, Technical University of Clausthal, Clausthal-Zellerfeld, Lower Saxony, Germany
Abstract
Orthorhombic copper polysilicate, CuSiO3, is isotypic to the spin-Peierls
compound CuGeO3 and represents a further example of a quasi-one-dimensional
spin = 1/2 antiferromagnetic Heisenberg chain system. This is a representa-tion of the first Raman and IR/FIR spectra for CuSiO3, measured at room
temperature on polycrystalline samples. A comparison of the optical phonons, predicted by a factor group analysis, with those observed for the CuGeO3
prototype, is presented. A mode assignment for the silicate is given. Surface effects due to a very small crystallite size may cause additional broad bands observed in the Raman spectrum of CuSiO3. From the analysis of the Davydov
doublet an intralayer-to-interlayer bond strength of about 40 is derived for the silicate, which is about 20% lower than for the isotypic germanate, allowing for different magnetic responses at low temperature.
Keywords
IR/FIR Spectra, Raman Spectra, Factor Group Analysis, Davydov Analysis, Copper Polysilicate, CuSiO3, Copper Polygermanate, CuGeO3,
Low-Dimensional Compounds, Spin-Peierls Transition
1. Introduction
Low-dimensional quantum spin systems are of considerable theoretical and ex-perimental interest. Some years ago a spin dimerization transition (spin-Peierls transition), which is one of the quantum phenomena in a S = 1/2 antiferromag-netic Heisenberg linear chain, was observed in inorganic compounds and exten-sively studied in quasi-one-dimensional (1D) copper polygermanate, CuGeO3 [1] [2] respectively α’ − NaV2O5 [3].
How to cite this paper: Meibohm, M. and Otto, H.H. (2018) Comparison of the Vi-brational Spectra of Copper Polysilicate,
CuSiO3, with Those of the Prototypic
Cop-per Polygermanate, CuGeO3. American
Journal of Analytical Chemistry, 9, 311-321.
https://doi.org/10.4236/ajac.2018.96024
Received: March 5, 2018 Accepted: June 4, 2018 Published: June 7, 2018
Copyright © 2018 by authors and Scientific Research Publishing Inc. This work is licensed under the Creative Commons Attribution International License (CC BY 4.0).
DOI: 10.4236/ajac.2018.96024 312 American Journal of Analytical Chemistry The crystal structure of copper polygermanate consists of two types of chains which running down the shortest translation period: einer single chains of GeO4
tetrahedra are connected by chains of edge-sharing CuO4+2 “octahedra” [4] [5],
which are in reality due to the Jahn-Teller effect strongly elongated and distorted tetragonal dipyramids. Because of this the magnetic chains actually are formed by ladders of CuO2 squares.
Until now CuGeO3 was the prototypic compound showing such tetrahedral
single chains with a repeat sequence of only one GeO4 unit. The substitution of
Si4+ for Ge4+ in copper polygermanate according to CuGe
1−xSixO3 was only
possi-ble in the limited concentration range x ≤ 0.5 for polycrystals by hydrothermal synthesis [6], and the existence of pure CuSiO3 was considered non-existent [7] [8]. However, we succeeded in the preparation of polycrystalline CuSiO3,
isotyp-ic to CuGeO3, by thermal decomposition of the mineral dioptase, Cu6Si6O18·6H2O,
and investigated its crystal and magnetic structure [9] [10] [11] [12]. Strong bonds in the ac-plane form zigzag layers in the crystal structure (Figure 1), but the layer-like character is less pronounced for the silicate than for the germanate, because its interlayer distance is reduced about 3.6% and the intralayer chain distance enlarged about 3.5% in comparison to the germanate. Lattice parame-ters and CuO2 chain separations of both compounds are compared in Table 1
and individual bond lengths summarized in Table 2 to complete the data used for the further analysis [10] [13].
Here we report on a first investigation of the room temperature vibrational spectra of a polycrystalline CuSiO3 sample and compare these measurements
with that for CuGeO3 using previously reported data as well as our own. While
the synthesis of CuGeO3 can easily be performed as a polycrystalline powder by
sintering of equimolar amounts of CuO and GeO2 at 800˚C [11], or as single
crystals by the floating zone method [14], the synthesis of pure CuSiO3 remains a
[image:2.595.270.473.513.693.2]worthwhile task. This paper is an extended (and corrected) version of a contri-bution that has been pre-published some years ago [15].
DOI: 10.4236/ajac.2018.96024 313 American Journal of Analytical Chemistry Table 1. Lattice parameters, unit-cell volume and separations of CuO2 chains for isotypic
CuSiO3[10] [11] [12] and CuGeO3 [13], respectively. Space group Pmma (No. 51,
stan-dard setting).
Compound a (Å) b (Å) c (Å) V (Å3)
CuSiO3 8.7735 (11) 2.8334 (4) 4.6357 (6) 115.24 (5)
CuGeO3 8.4749 (3) 2.9431 (1) 4.8023 (2) 119.78 (2)
CuO2 chain separations in the unit cell
a/2 (Å) intralayer c (Å) interlayer
CuSiO3 4.3868 (5) 4.6357 (6)
CuGeO3 4.2375 (2) 4.8023 (2)
Table 2. Bond lengths for CuSiO3 and CuGeO3.
Compound Atoms Bond length (Å) Reference
CuSiO3
Cu − O (1) 2.926 (7) x 2
[10]
Cu − O (2) 1.941 (4) x 4
Si − O (1) 1.640 (7) x 2
Si − O (2) 1.582 (7) x 2
CuGeO3
Cu − O (1) 2.7549 (8) x 2
[13]
Cu − O (2) 1.9326 (7) x 4
Ge − O (1) 1.7730 (8) x 2
Ge − O (2) 1.7322 (10) x 2
2. Experimental
The Raman and IR spectra of CuSiO3 and CuGeO3 were measured on
polycrys-talline samples. The copper polysilicate specimen has been obtained by thermal decomposition of the mineral dioptase, Cu6Si6O18·6H2O, as a multi-phase educt
containing about 76 wt-% CuSiO3, 14 wt-% CuO (tenorite) and 10 wt-%
amorphous SiO2 [10]. Single-phase powder of CuGeO3 has been synthesized by
sintering of pellets of a thoroughly homogenized CuO and GeO2 mixture at 1200
K and a repeated grinding and sintering procedure.
The Raman spectrum of CuSiO3 was recorded with a DILORLabRAM
spec-trometer, using a Nd-YAG-laser with frequency doubler (λ = 532 nm) as an
ex-citing source, and the spectrum of CuGeO3 with a Raman FRA 106 modul
at-tached to a BRUKERIFS 66v interferometer, using once again a Nd-YAG-laser, but with λ = 1064 nm. Infrared spectra of both compounds were obtained with the above mentioned interferometer using CsI pellets of the powdered samples.
The IR and Raman spectra of the minor phases in the phase mixture (CuO as tenorite and amorphous SiO2) were also recorded with the same experimental
equipment in order to estimate the possible distortion of the CuSiO3 spectra and
are given by Meibohm (1999) [11]. Only few strong bands were observed (IR: 470 and 1108 cm−1 for amorphous SiO
[image:3.595.210.539.266.419.2]DOI: 10.4236/ajac.2018.96024 314 American Journal of Analytical Chemistry for amorphous SiO2 and 300 cm−1 for CuO) that would be in a position to
in-troduce a marginal distortion of the main phase spectra. Only the background of the Raman spectrum near 300 cm−1 as well as the left (high frequency) shoulder
of the IR band near 500 cm−1 may be influenced by the presence of the minor
phases.
3. Crystallographic Data
Relevant crystallographic data such as lattice parameters, bond lengths and chain separations are summarised in Table 1 and Table 2 for both CuSiO3 and
Cu-GeO3. The Figures 1-3 illustrate crystal structural details in the standard setting
[image:4.595.291.454.248.422.2](space group Pmma).
Figure 2. Polyhedral representation of the CuSiO3 crystal structure. The unit cell was
outlined in margenta color, silicate tetrahedral chains in yellow color, copper oxide octa-hedral chains in blue color, respectively.
Figure 3. Projection of the crystal structure of CuSiO3 along the b-axis in the
[image:4.595.255.491.486.665.2]DOI: 10.4236/ajac.2018.96024 315 American Journal of Analytical Chemistry
4. Factor Group Analysis
For the factor group analysis (f.g.a.) the unit-cell, containing two non-translationally equivalent CuSiO3 units and thus n = 10 atoms, were adapted to the standard
setting of the Pmma space group in order to apply the tables given by Rousseau
[16] and Adams [17] and to compare with the data already reported for CuGeO3 [18]-[23]. From the total number of vibrations (NT = 3n = 30) the 3 acoustic and
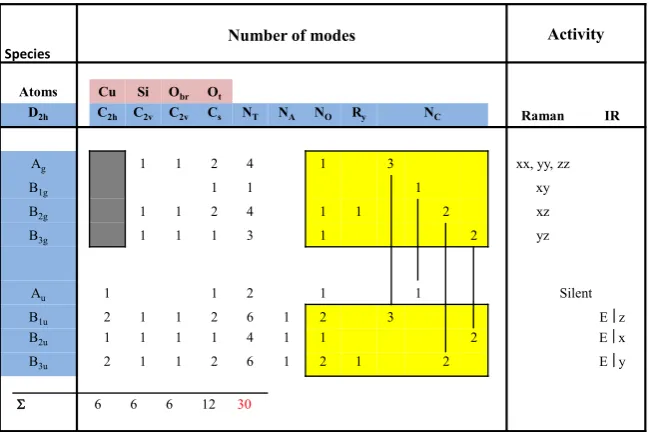
2 silent modes were subtracted, leaving 25 remaining optic modes, 12 of which are Raman-active and 13 IR-active modes. The results are summarized in Figure 4 displaying the active modes in frames. The following are features of the analy-sis that will make the mode assignment easier: a) the copper atoms do not con-tribute to the Raman spectrum; b) coupling between the two non-translationally equivalent silicate chains of C2v site symmetry in the unit-cell with D2h symmetry
leads to Davydov pairs [24]; the chain modes split into crystal modes of type Ag
− B1u, B2g − B3u and B3g − B2u, respectively [19]. The obtained doublets involving
both Raman- and IR-active modes are indicated in Figure 4 by vertical lines.
5. Results and Discussion
The room temperature Raman and infrared spectra of both CuSiO3 and CuGeO3
are shown in Figure 5 and Figure 6, and the extracted vibrational frequencies are summarized in Table 3 along with their intensities and the mode assign-ments. At a rough estimate the spectra of the silicate shift on average by a factor of F = Fm*·Fbl = 1.23 to higher frequencies in comparison to that of the
[image:5.595.212.537.452.668.2]germa-nate. In this way the mode assignment for the germanate, confirmed by a normal coordinate analysis [13], can be applied to the silicate spectra. In particular is
Figure 4. Factor group analysis for orthorhombic CuSiO3 (space group D2h−Pmma, No.
51). Mode numbers: NT total number, NA acoustic branch, NO optic branch, Ry chain
li-brations, NC coupled vibrations of two chains, Ot = terminal oxygen atom, Obr = bridging
oxygen atom.
Species Number of modes Activity
Atoms Cu Si Obr Ot
D2h C2h C2v C2v Cs NT NA NO Ry NC Raman IR
Ag 1 1 2 4 1 3 xx, yy, zz
B1g 1 1 1 xy
B2g 1 1 2 4 1 1 2 xz
B3g 1 1 1 3 1 2 yz
Au 1 1 2 1 1 Silent
B1u 2 1 1 2 6 1 2 3 Ez
B2u 1 1 1 1 4 1 1 2 Ex
B3u 2 1 1 2 6 1 2 1 2 Ey
DOI: 10.4236/ajac.2018.96024 316 American Journal of Analytical Chemistry Table 3. Vibrational frequencies (cm−1) and mode assignment for CuSiO
3 and CuGeO3.
CuGeO3 Mode Assignment CuSiO3
Raman IR Raman IR Raman IR
880 w B2g 1019 w
858 s - 857 s Ag - B1u 998 m - 1092 m
776 vs B3u 959 s
712 w - 718 vs B3g - B2u 854 vw - 859 vs
592 vs - 619 m Ag - B1u 719 m - 737 s
634 m ? 590 m, b ?
528 vs B2u 576 vs
478 m, sh B1u 558 m
430 vw - 380 s B2g - B3u 480 vw - 465 m, b
[411] vw B3g -
[388] vw B1g -
330 w - 347 m Ag - B1u 429 w - 465 m, b
289 s B3u 395 w
353 vw?
222 m - 215 s B2g - B3u 349 w - 317 m
184 vs Ag 300 vs
166 m B2u 227 m
132 w B1u 160 w
113 m B2g 255 m
110 m B3g 233 m
[48] vw B3u *)
vs = very strong, s = strong, m = medium, w = weak, vw = very weak, sh = shoulder, b = broad, Ot =
ter-minal oxygen atom, Obr = bridging oxygen atom, vw? = very weak peak on the shoulder of a medium peak,
− Davydov pairs, *) outside of measurement range. Frequencies in square brackets were not observed in the
powder spectra, but have been reported for single crystal spectra.
Figure 5. Raman (a) and IR/FIR (b) spectra of CuSiO3 at room temperature. b
a
0 200 400
600 800 1000 1200
Int
ens
ity
T
ra
ns
m
itt
[image:6.595.261.486.553.706.2]DOI: 10.4236/ajac.2018.96024 317 American Journal of Analytical Chemistry Figure 6. Raman (a) and IR/FIR (b) spectra of CuGeO3 at room temperature.
Fm* = (m*germanate/m* silicate)1/2 = 1.13 , where m* is the reduced mass, and Fbl =
<d>germanate/<d> silicate = 1.08; the mean bond lengths (bl) were applied as a
meas-ure of the stiffness of the compounds with <d> = 1.747 Å for the germanate and <d> = 1.611 Å for the silicate (Table 2).
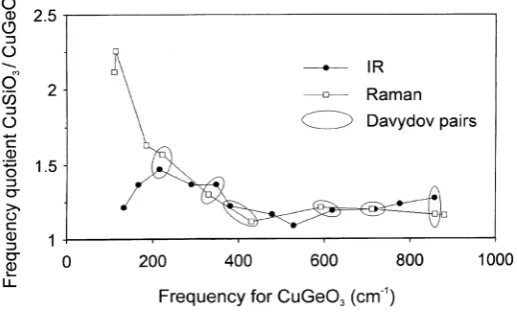
The frequency quotient of silicate to germanate modes versus the germanate frequency affords some information about the source of the vibrations and is displayed in Figure 7. In this drawing three regions of different slope can be made out, beginning with a low frequency region below 250 cm−1 (350 cm−1 for
the silicate) originating from Cu and Ge/Si atom vibrations, then a region be-tween 250 cm−1 and 550 cm−1 (350 to 600 cm−1) with Cu–O and Ge/Si–O
vibra-tions, and finally the region above 550 cm−1 showing modes with a dominant
contribution of oxygen vibrations. For the minimum values of the curve it is al-lowed to neglect Fm* thus obtaining a value, which actually reflects the force
con-stant ratio. In Figure 7 distinction is also made between Raman and IR data in order to demonstrate the difference of their low frequency modes. Because the copper atom does not contribute to the Raman spectrum (Table 3), the large Ge to Si mass ratio is decisive for the large frequency ratio, while for the IR spec-trum the contribution of Cu to the reduced mass level out the frequency differ-ence between germanate and silicate.
The number of modes found in the spectra are in agreement with the space group symmetry and f.g.a. taking into account the following points. Three very weak bands in the vibrational spectra of CuGeO3, given in Table 3 in squares,
which have been observed in polarized single crystal spectra [19], are absent in the spectra of powder samples of both CuGeO3 and CuSiO3 due to very low
in-tensity. For the silicate, the peak with the lowest Raman frequency obviously lies outside of the measurement range. A very broad band at 465 cm−1 in the
IR-spectrum of CuSiO3 is interpreted as a double peak. Two very broad bands in
the Raman spectrum of CuSiO3, showing no counterpart in the CuGeO3
spec-trum, may be caused by surface effects due to the very small crystallite size, which is concluded from the broad X-ray diffraction peaks observed [10]. Final-ly, a very weak side band at 353 cm−1 observed in the IR spectrum of CuSiO
3 0
200 400
600 800
1000 1200
Int
ens
ity
T
ra
ns
m
itt
ance
b
DOI: 10.4236/ajac.2018.96024 318 American Journal of Analytical Chemistry Figure 7. Frequency ratio of silicate to germanate modes versus the germanate frequency. Raman data are depicted as empty squares, IR data as filled circles, respectively. Davydov pairs are indicated by elliptical frames.
may belong to interference fringes caused by the parallelism of the faces of the pressed CsI disk [22].
Once the correct mode assignment has been found, it is sufficient to apply to the silicate the results of the normal coordinate analysis for the germanate, al-ready given by Popović et al.[19], in order to find out what the origin of an in-dividual vibration is.
With regard to the crystal symmetry, the spectroscopic data as well as X-ray diffraction results are supported by a further experiment. According to NQR measurements of Cu in CuSiO3 there exists, even down to 4.2 K, only one Cu site [25].
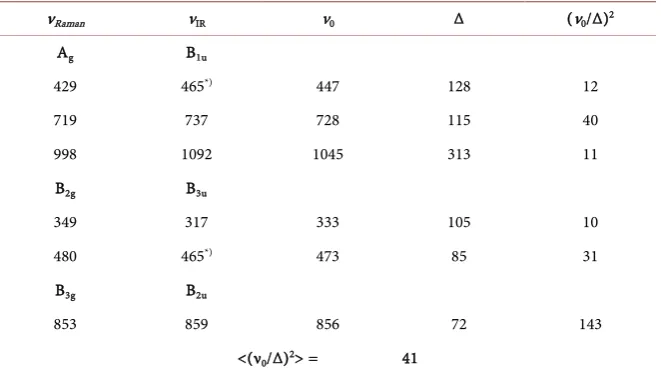
Following Popović et al. [19], we can analyse the chain mode doublets (Davy-dov pairs) for CuSiO3, like that for CuGeO3, as the result of the vibration of a
pair of weakly coupled identical oscillators by the relation ν± = (ν02 ± ∆2)1/2,
where ν0 is the frequency of the isolated oscillators and ∆2 is proportional to the
coupling force constant. Then (ν0/∆)2 gives a measure of the ratio of
intralay-er-to-interlayer bond strength. Table 4 summarizes the phonon doublet analysis (ν+ = νRaman, ν− = νIR), which yields the mean value of (ν0/∆)2 for the silicate about
20 % lower than for the germanate [18], in accordance with the changed chain separations that have been derived from the crystal structure analysis (Table 1).
The more 3D-like character of the silicate may be responsible for the different spin-phonon coupling in comparison to the germanate leading at low tempera-ture to a long-range antiferromagnetic Néel state order instead of a spin-Peierls
order.
6. Conclusions
The vibrational spectra of orthorhombic CuSiO3 from powder samples are
DOI: 10.4236/ajac.2018.96024 319 American Journal of Analytical Chemistry Table 4. Analysis of Raman and infrared active phonon doublets for CuSiO3. Frequencies ν and Δ are given in cm−1.
νRaman νIR ν0 Δ (ν0/Δ)2
Ag B1u
429 465*) 447 128 12
719 737 728 115 40
998 1092 1045 313 11
B2g B3u
349 317 333 105 10
480 465*) 473 85 31
B3g B2u
853 859 856 72 143
<(ν0/Δ)2> = 41
*) This broad band is interpreted as a double peak.
pairs suggested that the intralayer-to-interlayer bond strengths for the silicate are about 20% lower than for the germanate, reflecting the different magnetic behaviour of the silicate and the germanate.
Single crystals of CuSiO3 are required to improve the obtained vibration
spec-tra and extend the measurement to low temperatures and to perform a mea-ningful lattice dynamical calculation. However, the generation of thin CuSiO3
layers may be a promising task [26].
The negligible mismatch between certain lattice parameters of tenorite (CuO) and CuSiO3 suggests the possibility of a metastable formation of CuSiO3 by the
way of a topotactically induced reaction on the tenorite surface. It is proposed to use a tenorite substrate or at least a tenorite buffer layer for an epitaxial growth of well crystallized copper polysilicate. Like straw crystals of TiO2 (rutile) [27] or
CuGeO3 nanorods [28], also CuSiO3 may show photocatalytic activity for the
degradation of wastewater or toxic NOx exhaust gases under sun light exposure.
Therefore, dd-excitations and the energy gap of CuSiO3 were empirically
esti-mated quite recently, due to the lack of pure crystalline material or even single crystals to experimentally measure the spectra [29] [30].
Acknowledgements
The authors would like to thank the late Prof. Dr. W. Brockner, Institute of In-organic and Analytical Chemistry at the TU Clausthal, for the opportunity to measure the spectra.
References
[1] Hase, M., Terasaki, I. and Uchinokura, K. (1993) Observation of the Spin-Peierls transition in Linear Cu2+ (Spin-1/2) Chains in an Inorganic Compound CuGeO
3. Physical Review Letters, 70, 3651-3654.
DOI: 10.4236/ajac.2018.96024 320 American Journal of Analytical Chemistry
[2] Boucher, J.P. and Regnault, L.P. (1966) The Inorganic Spin-Peierls Compound Cu-GeO3. Journal de PhysiqueI, 6, 1939-1966. https://doi.org/10.1051/jp1:1996198
[3] Isobe, M. and Ueda, Y. (1996) Magnetic Susceptibility of Quasi-One-Dimensional
α’ − NaV2O5 − Possible Spin-Peierls Compound with High Critical Temperature of
34K. Journal of the Physical Society of Japan, 65, 1178-1181.
https://doi.org/10.1143/JPSJ.65.1178
[4] Ginetti, Y. (1954) Structure cristalline du métagermanate de cuivre. Bulletin So-ciétés Chimiques Belges, 63, 209-216. https://doi.org/10.1002/bscb.19540630501
[5] Völlenkle, H., Wittmann, A. and Nowotny, H. (1967) Zur Kristallstruktur von Cu-GeO3. Monatshefte für Chemie, 98, 1352-1357. https://doi.org/10.1007/BF00909002
[6] Breuer, K.H. (1984) Kristallchemie von Kupfer(II)-Silikaten und -Germanaten. Dissertation Universität Heidelberg.
[7] Liebau, F. (1956) Bemerkungen zur Systematik der Kristallstrukturen von Silikaten mit hochkondensierten Anionen. Zeitschrift für Physikalische Chemie, 206, 73-90.
https://doi.org/10.1515/zpch-1956-0107
[8] Dent Glasser, L.S. (1979) Non-Existent Siliocates. Zeitschrift für Kristallographie, 149, 291-305.
[9] Otto, H.H., Brandt, H.J. and Meibohm, M. (1996) Über die Existenz des Kupferpo-lysilicats Cu{uB11∞1}[1SiO3]. Beihefte zu European Journal of Mineralogy, 8, 206.
[10] Otto, H.H. and Meibohm, M. (1999) Crystal Structure of Copper Polysilicate, Cu[SiO3]. Zeitschrift für Kristallographie, 214, 558-565.
https://doi.org/10.1524/zkri.1999.214.9.558
[11] Meibohm, M. (1999) Zur Kristallchemie und Kristallphysik von neuen Silikaten und Germanaten des Kupfers mit ketten- und ringförmigen Anionen. Doctoral Thesis, TU Clausthal.
[12] Wolfram, H., Otto, H.H., Cwik, M., Braden, M., André, G., Bourée, G.F., Baenitz, M. and Steglich, F. (2004) Neutron Diffraction Study of the Nuclear and Magnetic Structure of the Quasi-One-Dimensional Compound CuSiO3 around TN = 8 K. Physical ReviewB, 69, 144115-144127. https://doi.org/10.1103/PhysRevB.69.144115
[13] Braden, M., Wilkendorf, G., Lorenzana, J., Ain, M., McIntyre, G.J., Behruzi, M., Heger, G., Dhalenne, G. and Revcolevschi, A. (1996) Structural Analysis of CuGeO3:
Relation between Nuclear Structure and Magnetic Interaction. Physical Review B, 54, 1105-1116. https://doi.org/10.1103/PhysRevB.54.1105
[14] Tanaka, I., Shibuya, Y. and Kojima, H. (1996) Crystal Growth of Pure and Zn-Doped CuGeO3 by the Floating Zone (FZ) Method. Journal of Crystal Growth,
169, 469-473. https://doi.org/10.1016/S0022-0248(96)00447-2
[15] Meibohm, M., Otto, H.H. and Brockner, W. (2009) Vibrational Spectra of Copper Polysilicate, CuSiO3. arXiv e-Print (arXiv:0903.3901).
[16] Rousseau, D.L., Bauman, R.P. and Porto, S.P.S. (1981) Normal Mode Determination in Crystals. Journal of Raman Spectroscopy, 10, 253-290.
https://doi.org/10.1002/jrs.1250100152
[17] Adams, D.M. and Newton, D.C. (1970) Tables for Factor Group and Point Group Analysis. Beckman R.I.I.C., Croydon.
[18] Adams, D.M. and Fletcher, P.A. (1988) Vibrational Spectroscopy at High Pressure: Part 53. Alkali Metavanadates and Copper Metagermanate. Spectrochimica Acta A, 44, 233-240.
[19] Popović, Z.V., Dević, S.D., Popov, V.N., Dhalenne, G. and Revcolevschi, A. (1995) Phonons in CuGeO3 Studied Using Polarized Far-Infrared and Raman-Scattering
DOI: 10.4236/ajac.2018.96024 321 American Journal of Analytical Chemistry https://doi.org/10.1103/PhysRevB.52.4185
[20] Dević, S.D., Konstantinović, M.J., Popović, Z.V., Dhalenne, G. and Revcolevschi, A. (1994) Vibrational Properties of Copper Metagermanate (CuGeO3). Journal of the Physics of Condensed Matter, 6, L745.
[21] Dević, S.D., Popović, Z.V., Popov, V.N., Dhalenne, G. and Revcolevschi, A. (1997) Temperature Dependence of Raman Active Modes in CuGeO3. Solid State Commu-nications, 102, 599-604.https://doi.org/10.1016/S0038-1098(97)00027-6
[22] Kuroe, H., Sekine, T., Hase, M., Sasago, Y., Uchinokura, K., Kojima, H., Tanaka, I. and Shibuya, Y. (1994) Raman-Scattering Study of CuGeO3 in the Spin-Peierls
Phase. Physical Review B, 50, 16468-16474.
https://doi.org/10.1103/PhysRevB.50.16468
[23] Udagawa, M., Aoki, H., Ogita, N., Fujita, O., Sohma, A., Ogihara, A. and Akimitsu, J. (1994) Raman Scattering of CuGeO3. Journal of the Physical Society of Japan, 63,
4060-4064.https://doi.org/10.1143/JPSJ.63.4060
[24] Davydov, A.S. (1962) Theorie of Molecular Excitations. MacGraw-Hill Book Comp., New York, San Francisco, Toronto, London.
[25] Baenitz, M., Geibel, C., Dischner, M., Sparn, G., Steglich, F., Otto, H.H., Meibohm, M. and Gipius, A.A. (2000) CuSiO3: A Quasi-One-Dimensional S = 1/2
Antiferro-magnetic Chain System. Physical Review B, 62, 12201-12205.
https://doi.org/10.1103/PhysRevB.62.12201
[26] Otto, H.H. (2016) A Different Approach to High-Tc Superconductivity: Indication
of Filamentary-Chaotic Conductance and Possible Routes to Superconductivity above Room Temperature. World Journal of Condensed Matter Physics,6, 244-260.
https://doi.org/10.4236/wjcmp.2016.63023
[27] Li, G., Boerio-Goates, J. and Woodfield, B.F. (2004) Evidence of Linear Lattice Ex-pansion and Covalency Enhancement in Rutile TiO2 Nanocrystals. Applied Physics Letters, 85, 2059.https://doi.org/10.1063/1.1790596
[28] Borhade, A.V., Gaikwad, V.B., Baste, Y.R. and Tope, D.R. (2013) Synthesis and Characterization of CuGeO3 Photocatalyst Using Green Chemistry and Its
Applica-tion for the DegradaApplica-tion of Direct Black Dye. Carbon—Science and Technology, 5, 192-196.
[29] Otto, H.H. (2018) CuSiO3: Empirical Estimation of dd-Excitations and the Energy
Gap.
[30] Otto, H.H. (2017) Crystal Growth of Cu6(Ge,Si)6O18·6H2O and Assignment of
![Figure 1. Crystal structure projection of CuSiO3 along [010]. Zigzag layers along a in the ac plane are depicted by the red line](https://thumb-us.123doks.com/thumbv2/123dok_us/9286905.423608/2.595.270.473.513.693/figure-crystal-structure-projection-cusio-zigzag-layers-depicted.webp)
![Table 1. Lattice parameters, unit-cell volume and separations of CuO2 chains for isotypic CuSiO3 [10] [11] [12] and CuGeO3 [13], respectively](https://thumb-us.123doks.com/thumbv2/123dok_us/9286905.423608/3.595.210.539.266.419/table-lattice-parameters-volume-separations-chains-isotypic-respectively.webp)
![Figure 3. Projection of the crystal structure of CuSiOrespectively. The strongly anisotropic displacement of the oxygen atom O(2) is noticea-3 along the b-axis in the displace-ment ellipsoid representation [12]](https://thumb-us.123doks.com/thumbv2/123dok_us/9286905.423608/4.595.291.454.248.422/projection-structure-cusiorespectively-anisotropic-displacement-displace-ellipsoid-representation.webp)