http://www.scirp.org/journal/msa ISSN Online: 2153-1188
ISSN Print: 2153-117X
DOI: 10.4236/msa.2018.95035 May 24, 2018 502 Materials Sciences and Applications
Mechanical, Thermal and Crystallization
Properties of Polypropylene (PP) Reinforced
Composites with High Density Polyethylene
(HDPE) as Matrix
Harekrushna Sutar
1,2*, Prakash Chandra Sahoo
2, Prateekshya Suman Sahu
2, Surajabala Sahoo
2,
Rabiranjan Murmu
2, Sumit Swain
2, Subash Chandra Mishra
11Department of Metallurgical and Materials Engineering, National Institute of Technology, Rourkela, India 2Department of Chemical Engineering, Indira Gandhi Institute of Technology, Sarang, India
Abstract
Our work aims to evaluate a complete outlook of virgin high density polye-thylene (HDPE) and polypropylene (PP) polyblends. Virgin PP of 20, 30 and 50 weight% is compounded with virgin HDPE. The properties like tensile strength, flexural strength, Izod impact strength are examined. Scanning electron microscopy (SEM) and polarised light microscopy (PLM) are used to observe the surface and crystal morphology. X-ray diffraction (XRD), Fourier transform infrared spectroscopy (FTIR) tests verify the non compa-tibility of both polymers. Differential scanning calorimetry (DSC) and ther-mogravimetric analysis (TGA) techniques are used to study the thermal beha-viour of composites. The results manifest co-occurring spherulites for polyb-lends; indicating the composite to be a physical blend of continuous and dis-persed phases, but on the other hand PP improves the tensile and flexural properties of HDPE.
Keywords
High Density Poly Ethylene (HDPE), Polypropylene (PP), Polyblends, Mechanical, Thermal, Crystallization Properties
1. Introduction
Polymer composite is material of research in modern days. Thermoplastic poly-mers are of great interest due to their technical and commercial importance [1]. In general two or more polymers are melt blended to form a product as polyb-How to cite this paper: Sutar, H., Sahoo,
P.C., Sahu, P.S., Sahoo, S., Murmu, R., Swain, S. and Mishra, S.C. (2018) Mechan-ical, Thermal and Crystallization Properties of Polypropylene (PP) Reinforced Compo-sites with High Density Polyethylene (HDPE) as Matrix. Materials Sciences and Applica-tions, 9, 502-515.
https://doi.org/10.4236/msa.2018.95035
Received: January 11, 2018 Accepted: May 21, 2018 Published: May 24, 2018
Copyright © 2018 by authors and Scientific Research Publishing Inc. This work is licensed under the Creative Commons Attribution International License (CC BY 4.0).
http://creativecommons.org/licenses/by/4.0/
DOI: 10.4236/msa.2018.95035 503 Materials Sciences and Applications lends [2] [3] [4] [5]. The component percentages are the primary factor influen-cing their physical properties [6]. The manufacturing technique and operating conditions are second governing factor.
Among the thermoplastic polymers, PP possesses good mechanical strength. In addition it has high chemical resistance, low cost and easy to manufacture. PP has wide application in automobile spare parts and as well as container [7]. HDPE is known for its large strength to density ratio due to its little branching. HDPE unlike PP cannot withstand normally required autoclaving conditions [8]-[13].
Jia-Horny Lin et al. has reinforced HDPE to PP matrix and verified the non- compatibility of both polymers, but improves the impact strength of PP [14]. Souza et al found the effect of processing temperature and content of HDPE on interfacial tension of the PP/HDPE polyblend [15]. Past studies show the com-patibility of PP/HDPE polyblends depends on factors like processing tempera-ture, polymer structure and blending ratios [15] [16] [17]. Polymers with similar physical properties form polyblends with greater mechanical strength [18] [19] [20]. The mechanical properties of the PP/HDPE polyblend decreases with in-crease in dissimilarity of melt flow index (MFI) [21], so we have investigated a complete prospects of PP reinforced HDPE polyblends with similar MFI manu-factured by the help of twin screw extruder and injection moulding machines. In addition to mechanical properties; thermal behaviour of the composites are cha-racterised by using DSC, TGA tests. Crystal morphologies are captured using PLM, SEM and X-RD techniques. Compatibility of both the thermoplastics are re-examined by study of molecular structure using FTIR.
2. Experimental
2.1. Collection of Polymers
PP (M110 Grade, homopolymer) produced by the spheripol technology and HDPE (M5818 Grade, injection moulded type) produced by Mitsui Slurry CX technology are purchased from Haldia petrochemical limited, haldia, India. Dif-ferent physical properties of the polymers are reported in Table 1.
2.2. Preparation of Composites
Polymers in the form of pellets are collected. The pellets are dried in a hot air oven at 60˚C for 8 hrs to remove moisture content followed by mixing of 20, 30, and 50 wt% of PP to HDPE. Then they are converted into polymer blend pellets using a twin screw extruder (ZV20, Specific Engineering and Auto Mates, Va-dodara, India) at feeder speed of 51 rpm and main rotor at 54 rpm. The screws are of 21 mm diameter and co-rotating type, containing three thermal barrels at 190˚C, 200˚C and 210˚C respectively. The melt and die temperatures are 224˚C and 200˚C.
H. Sutar
[image:3.595.211.539.90.144.2]DOI: 10.4236/msa.2018.95035 504 Materials Sciences and Applications
Table 1. Physical properties of polymers.
Polymer type Melt flow index (g/10 min) Density (g/cc)
HDPE 19 (2.16 kg, 190˚C) 0.956
PP 11 (2.16 kg, 230˚C) 0.900
machines limited, Kolkata, India) with screw diameter of 35 mm at 177 rpm. The temperature of the nozzle is 200˚C and that of the three barrels are 190˚C, 200˚C and 210˚C respectively. Snapshot of the prepared tensile and flexural test samples are shown in Figure 1.
2.3. Mechanical Properties
Both tensile and flexural strengths of HDPE/PP polyblends are tested using an universal testing machine (UTM3382, Instron, UK) as per ASTM D638-02a and ASTM D790 standards respectively. Tensile specimens are prepared according to ASTM D638-02a type-I; with gage length 50 mm. Tests are conducted at cross head speed of 50 mm/min. Flexural sample of size 127 mm × 12.7 mm × 3.2 mm are tested at speed of 1.365 mm/min with support span spacing of 51.2 mm (span = 16 times of thickness) at an extension up to 5%. The speed of the test and flexural strengths are calculated according to Equations (1) and (2) respec-tively.
2
Speed 6
ZL d
= (1)
max 2
3 2
F PL
bd
σ
= (2)where, Z is Rate of straining at 0.01 mm/mm/min, L is span length (mm) and d is sample thickness (mm), σFmax is flexural strength (MPa), P is load (N), L is span length (mm) and b is sample width (mm).
Impact tests are conducted using a Izod and Charpy impactometer (IT 504 Plastic impact , Tinius Olsen ,USA ) with a V-notch cutter as per ASTM D256-A standard , possessing a pendulum energy of 13.70 J. Impact test specimens are prepared by cutting the flexural samples to a size of 63.5 mm × 12.7 mm × 3.2 mm with a V-notch of 45˚ and 0.25 mm depth.
2.4. Microscopy Test
DOI: 10.4236/msa.2018.95035 505 Materials Sciences and Applications
Figure 1. Snapshot of prepared, (a) tensile and (b) flexural test specimens.
form a thin film. The sample is cooled at 5˚C/min (using cold stage) and spheru-lite morphologies are captured at 130˚C and 125˚C at magnification × 10.
2.5. XRD and FTIR
In order to analyse any new phase formations after blending the polymers and to understand the chemical structure of the polyblends; the XRD (Philips, PW1720, USA) and FTIR (Perkin-Emler Spectrum 100, USA) techniques are utilised. X-ray scanning is done within a diffraction angle (2θ) range of 10 - 90˚ with Cu Kα radiation at 40 KV and 30 mA. The rate of scanning is 10˚/min and at λ = 0.154 nm. The IR Spectroscopy is observed between the waveband of 450 to 4000 cm−1.
2.6. DSC and TGA Analyses
The polyblends thermal behaviour is analysed using a DSC (Perkin-Elmer DSC 7, MA, USA) and TGA (Perkin-Elmer TGA, MA, USA) analysers. The DSC tests are performed under nitrogen flow rate of 50 ml/min. Polymer samples of around 10 mg are scanned at a heating rate of 10˚C/min from ambient temper-ature to 200˚C. The samples undergo three thermal cycles. Heating, cooling and reheating under the same condition to follow an identical thermal history for all polymer blends.
The degree of crystallinity (XC) of the polyblends is evaluated by Equation (3)
( )
% ø 0 100f C
f H X
H
∆
= ×
∆ (3)
where, ∆Hf = Melting enthalpy of HDPE or PP in the blend, ∆H0f =
En-thalpy corresponding to melting of 100% crystalline HDPE or PP and Ø = weight fraction of HDPE or PP in the blend. In TGA test, polymer samples with masses of approximately 10 mg are heated from atmospheric temperature to 600˚C, at heating rate of 10˚C/min and nitrogen flow rate of 50 ml/min, to ob-serve their degradation behaviour. Data corresponding to 0
f H
∆ are referred
from Roger L. Blaine [22].
3. Results and Discussion
3.1. Tensile, Flexural and Impact Strengths
H. Sutar
DOI: 10.4236/msa.2018.95035 506 Materials Sciences and Applications
MPa) of tensile strength is resulted from PP where as the HDPE matrix bears a tensile strength of ≈22 MPa. Reinforcement of PP to HDPE improves the tensile strength due to formation of brittle polyblends as observable in Figure 2(b). The magnitude of tensile modulus at break point is reported in Figure 2(c). The po-lyblends of 50 HDPE/50PP shows the maximum (≈146 MPa) value of tensile modulus.
The experimental outcomes for flexural tests are reported in Figure 3. Flexur-al strength improves (See Figure 3(a)) and a value of ≈23 MPa is observed for all the composite blends. Figure 3(b) reveals the PP added polyblends bear more extension properties when compare to HDPE. Data pertaining to the flexural modulus are reported in Figure 3(c); indicating the PP content increases the flexural modulus; as PP to be a separate phase in the polyblend and HDPE as continuous matrix.
The impact strength of polymers are expressed in three different ways and reported in Figure 4. The results corresponding to impact strength in Joule (J) is reported in Figure 4(a); indicating a maximum value for HDPE where as attri-buting a minimum value to 50/50 polyblend. Energy absorbed during impact per unit thickness of sample is manifested in Figure 4(b). The impact energy ab-sorbed per unit cross sectional area, perpendicular to load; also shows a similar trend as visible in Figure 4(c). Reinforcement of PP particles to HDPE matrices contracts the stress concentration and the plastic deformation property is lost; there by weakening the impact property.
3.2. Phase Analysis
The chemical and crystal structure of HDPE/PP polyblends are analysed by XRD and FTIR. Figure 5 and Figure 6 reports the XRD and FTIR results. For PP all the peaks lies between 2θ of 15 to 30˚, which are α form of PP. The peaks are corresponding to crystalline lattices [23]. Two diffraction peaks for HDPE are observed between 20 to 30˚ diffraction angles, comprising of orthorhombic crystals [24] [25]. Reinforcing PP to HDPE does not produce any new peaks, only shortening of peaks for HDPE/PP polyblends are seen. So combination of PP with HDPE is only a physical mixing with no alternation of chemical struc-ture. Table 2 shows the frequency ranges of different functional groups of PP and HDPE polymers, with assigned vibration type. The FTIR spectra reveals, the peaks of HDPE/PP composites confirms to those of virgin HDPE and PP ma-trices.
3.3. Thermal Behaviour
DOI: 10.4236/msa.2018.95035 507 Materials Sciences and Applications
Figure 2. Tensile properties of the polymer composites, (a) tensile strength at yield; (b) load against
[image:6.595.59.539.401.530.2]extension; (c) tensile modulus at break.
Figure 3. Flexural properties of the polyblends, (a) flexural strength; (b) load vs extension; (c) flexural modulus.
Figure 4. Impact strengths of the polyblends, (a) energy absorbed; (b) energy absorbed/m of sample thickness; (c) energy
[image:6.595.58.539.561.694.2]H. Sutar
DOI: 10.4236/msa.2018.95035 508 Materials Sciences and Applications
10 15 20 25 30 35 40
In
ten
si
ty (
a.
u)
Diffraction angle, 2θ
50HDPE/50PP
70HDPE/30PP
HDPE 80HDPE/20PP
PP
α form of PP 15-300
[image:7.595.301.445.72.195.2]orthorhombic crystal
Figure 5. X-Ray diffractogram of
poly-mer composite blends.
500 1000 1500 2000 2500 3000 3500 4000
%
T
ran
sm
itt
an
ce (
a.
u)
Wavenumbers, cm-1
HDPE PP HDPE50/PP50
HDPE
PP
HDPE50/PP50
Figure 6. FT-IR spectroscopy of
poly-mer composite blends.
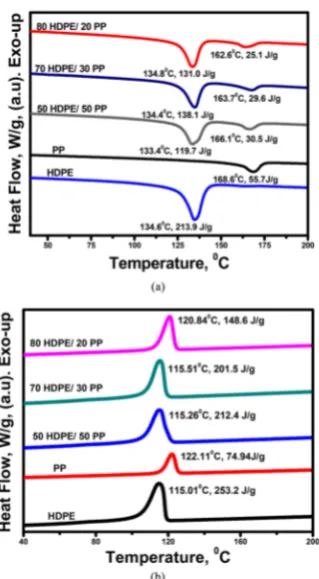
Figure 7. DSC sketches of the obtained
[image:7.595.299.444.236.362.2] [image:7.595.294.454.400.690.2]DOI: 10.4236/msa.2018.95035 509 Materials Sciences and Applications
Table 2. IR spectra analysis reports.
Group Wave number (cm−1) Vibration type Assigned to
-C-H 2985 - 2810 Stretching PP
-CH2 2950 - 2850 Stretching HDPE
-CH2 1475 - 1440 Bending PP
-CH3 1380 - 1370 Bending PP
-CH2 1470 - 1460 Bending HDPE
[image:8.595.211.540.265.390.2]-CH2 730 - 700 Rocking HDPE
Table 3. DSC data of HDPE/PP polyblends.
Polymer Type ∆Hf, J/g Tm, ˚C Tc, ˚C Xc, % ∆Hc, J/g
HDPE 213.9 134.6 115.0 73.0 253.2
PP 55.7 168.6 122.1 26.9 74.94
50HDPE/50PP 119.7a/30.5b 134.4a/166.1b 115.2 81.70a/29.46b 212.4
70HDPE/30PP 138.1a/29.6b 134.4a/163.7b 115.5 67.33a/47.66b 201.5
80HDPE/20PP 131.0a/25.1b 134.8a/162.6b 120.8 55.88a/60.62b 148.6
The superscript abcorresponds to cite HDPE and PP respectively.
composite to be a physical mixture of both the polymers. The existence of PP in HDPE does not alter the melt peak temperature significantly.
Figure 7(b) shows the temperature (Tc) and enthalpy ∆Hc of crystallization for all the polymers resulted from the DSC cooling cycle. The Tc’s for PP and HDPE are 122.11˚C and 115.01˚C respectively. Result shows PP crystallizes fast-er than HDPE. But the ordfast-er of crystallinity of the composite blend is quite sim-ilar to HDPE. Augmentation of PP particles to HDPE retards the nucleation of the heterogeneous polymer blend and so the crystallization peaks of the polyb-lends are undistinguishable.
H. Sutar
DOI: 10.4236/msa.2018.95035 510 Materials Sciences and Applications
3.4. Surface Behavior
[image:9.595.86.536.116.370.2]The surface morphology of polymers before fracture is reported in Figure 9. A
Figure 8. TG/DTG thermograms of (a) virgin HDPE; (b) virgin PP, and HDPE/PP Polyblends which contain; (c) 50 wt%;
(d) 30 wt% and (e) 20 wt% of PP.
Figure 9. Surface morphology of un-fractured Polyblends; (a) virgin HDPE; (b) virgin PP, and HDPE/PP polyblends which
[image:9.595.85.542.413.697.2]DOI: 10.4236/msa.2018.95035 511 Materials Sciences and Applications
Table 4. TG/DTG results of prepared polymers.
Sample TD, ˚C Weight % at TD Residual weight %
Inflection Point
˚C %/˚C
HDPE 368.56 97.45 0.7495 452.5 2.264
PP 356.87 97.86 1.206 438.0 3.008
50HDPE/50PP 392.34 96.20 0.5303 447.68 3.002
70HDPE/30PP 388.54 96.45 0.6602 447.65 2.94
80HDPE/20PP 320.174 96.16 1.972 433.16 1.378
similar morphology of all the polymer blends is observed. Prepared sample’s surfaces are smooth and difficult to differentiate. The continuous and dispersed phases for un-fractured polyblend samples are difficult to identify. To evaluate the changes in the properties; carbon elemental mapping and EDS tests are conducted and disclosed in Figure 10. Surface behaviour of fractured specimens after impact test is shown in Figure 11. Figure 11(b) shows the fractured sur-face for virgin PP is flat owing to brittle fracture. Fractured virgin HDPE speci-men results a wrinkled and aggregative exterior. The ruptured surface of the po-lyblends is also irregular, owing to their toughness. The reinforcement of PP to HDPE smoothens the surface as visible in Figures 2(c)-(e). The impact energy absorbed falls with augmentation of PP particles (see Figure 4), resulting the cracks to prevent bloating due to exerted strain.
Crystal structures of the polyblends during solidification from molten stage are reported in Figure 12. Spherulites are large and spherical for PP conforming to the results reported by jia-Horng Lin etal [14], and so called ring spherulites for HDPE. PP forms an overlapped layer in the polyblend and hence an incom-plete spherulitic growth is resulting for the polymer composites. Spherulites stalk over each and cannot reach to complete form.
4. Conclusion
H. Sutar
[image:11.595.58.538.67.689.2]DOI: 10.4236/msa.2018.95035 512 Materials Sciences and Applications
Figure 10. EDS and carbon element mapping of Polyblends; (a) virgin HDPE; (b) virgin PP, and HDPE/PP Polyblends which
DOI: 10.4236/msa.2018.95035 513 Materials Sciences and Applications
Figure 11. SEM images of the fractured specimens after impact tests; (a) virgin HDPE; (b) virgin PP and polyblends which
contain (c) 50 wt %; (d) 30 wt %; (e) 20 wt % of PP.
Figure 12. Spherulite structures of prepared polymers (a) HDPE at 130˚C; (b) HDPE at 125˚C; (c) PP at 130˚C; (d) PP at
125˚C; (e) 50HDPE/50PP at 130˚C; (f) 50HDPE/50PP at 125˚C; (g) 80HDPE/20PP at 130˚C; (h) 80HDPE/20PP at 125˚C.
conventional methods are adopted for preparing the HDPE/PP blends with low manufacturing cost, the composite blends may find suitable application areas.
References
[image:12.595.82.538.360.606.2]H. Sutar
DOI: 10.4236/msa.2018.95035 514 Materials Sciences and Applications
F.S.F. (2017) Characterization and Lifetime Estimation of High Density Polyethy-lene Containing a Prodegradant Agent. Materials Sciences and Applications, 8, 979-991. https://doi.org/10.4236/msa.2017.813072
[2] Bertin, S. and Robin, J. (2002) Study and Characterization of Virgin and Recycled LDPE/PP Blends. EuropeanPolymerJournal, 38, 2255-2264.
https://doi.org/10.1016/S0014-3057(02)00111-8
[3] Laoutid, F., Estrada, E., Michell, R.M., Bonnaud, L., Müller, A.J. and Dubois, P. (2013) The Influence of Nanosilica on the Nucleation, Crystallization and Tensile Properties of PP-PC and PP-PA Blends. Polymer, 54, 3982-3993.
https://doi.org/10.1016/j.polymer.2013.05.031
[4] Xie, B.H., Huang, X. and Zhang G.J. (2013) High Thermal Conductive Polyvinyl Alcohol Composites with Hexagonal Boron Nitride Microplatelets as Fillers. Com-posites Science and Technology, 85, 98-103.
https://doi.org/10.1016/j.compscitech.2013.06.010
[5] Ma, W., Zhang, J. and Wang, X. (2008) Crystallizaion and Surface Morphology of Poly(vinylidene fluoride)/Poly(methylmethacrylate) Films by Solution Casting on Different Substrates. Applied Surface Science, 254, 2947-2954.
https://doi.org/10.1016/j.apsusc.2007.10.037
[6] Albano, C., González, J., Ichazo, M., Rosales, C., Urbina de Navarro, C. and Parra, C. (2000) Mechanical and Morphological Behavior of Polyolefin Blends in the Presence of CaCO3. Composite Structures, 48, 49-58.
https://doi.org/10.1016/S0263-8223(99)00072-0
[7] Hsieh, C.T., Pan, Y.J. and Lin, J.H. (2017) Polypropylene/High-Density Polyethy-lene/Carbon Fiber Composites: Manufacturing Techniques, Mechanical Properties, and Electromagnetic Interference Shielding Effectiveness. FibersandPolymers, 18, 155-161. https://doi.org/10.1007/s12221-017-6371-0
[8] Wilkinson, A.N., Laugel, L., Clemens, M.L., Harding, V.M. and Marin, M. (1999) Phase Structure in Polypropylene/PA6/SEBS Blends. Polymer, 40, 4971-4975.
https://doi.org/10.1016/S0032-3861(98)00843-X
[9] Tseng, F.P., Lin, J.J. and Tseng, C.R. (2001) Poly (oxypropylene)-Amide Grafted Polypropylene as Novel Compatibilizer for PP and PA6 Blends. Polymer, 42, 713-725. https://doi.org/10.1016/S0032-3861(00)00400-6
[10] Shi, H., Shi, D., Wang, X., Yin, L., Yin, J. and Mai, Y.W. (2010) A Facile Route for Preparing Stable Co-Continuous Morphology of LLDPE/PA6 Blends with Low PA6 Content. Polymer, 51, 4958-4968. https://doi.org/10.1016/j.polymer.2010.08.023
[11] Maciel, A., Salas, V. and Manero, O. (2005) PP/EVA Blends: Mechanical Properties and Morphology. Effect of Compatibilizers on the Impact Behavior. Advances in Polymer Technology, 24, 241-252. https://doi.org/10.1002/adv.20050
[12] Martins, C.G., Larocca, N.M., Paul, D.R. and Pessan, L.A. (2009) Nanocomposites Formed from Polypropylene/EVA Blends. Polymer, 50, 1743-1754.
https://doi.org/10.1016/j.polymer.2009.01.059
[13] Valera-Zaragoza, M., Rivas-Vazquez, L.P., Ramirez-Vargas, E., Sánchez-Valdes, S., Ramos-deValle, L.F. and Medellín-Rodríguez, F.J. (2013) Influence of Morphology on the Dynamic Mechanical Characteristics of PP-EP/EVA/Organoclay Nanocom-posites. Composites Part B: Engineering, 55, 506-512.
https://doi.org/10.1016/j.compositesb.2013.07.009
DOI: 10.4236/msa.2018.95035 515 Materials Sciences and Applications
https://doi.org/10.3390/ma8125496
[15] Souza, A.M.C. and Demarquette, N.R. (2002) Influence of Composition on the Li-near Viscoelastic Behavior and Morphology of PP/HDPE Blends. Polymer, 43, 1313-1321. https://doi.org/10.1016/S0032-3861(01)00718-2
[16] Li, J., Shanks, R.A. and Long, Y. (2000) Mechanical Properties and Morphology of Polyethylene-Polypropylene Blends with Controlled Thermal History. Journal of Applied Polymer Science, 76, 1151-1164.
https://doi.org/10.1002/(SICI)1097-4628(20000516)76:7<1151::AID-APP19>3.0.CO ;2-H
[17] Jose, S., Aprem, A.S., Francis, B., Chandy, M.C., Werner, P., Alstaedt, V. and Tho-mas, S. (2004) Phase Morphology, Crystallisation Behaviour and Mechanical Prop-erties of Isotactic Polypropylene/High Density Polyethylene Blends. European Po-lymer Journal, 40, 2105-2115.https://doi.org/10.1016/j.eurpolymj.2004.02.026
[18] Macosko, C.W., Jeon, H.K. and Hoye, T.R. (2005) Reactions at Polymer-Polymer Interfaces for Blend Compatibilization. Progress in Polymer Science, 30, 939-947.
https://doi.org/10.1016/j.progpolymsci.2005.06.003
[19] Saroop, M. and Mathur, G.N. (1997) Studies on the Dynamically Vulcanized Poly-propylene (PP)/Butadiene Styrene Block Copolymer (SBS) Blends: Mechanical Properties. Journal of Applied Polymer Science, 65, 2691-2701.
https://doi.org/10.1002/(SICI)1097-4628(19970926)65:13<2691::AID-APP10>3.0.C O;2-0
[20] Van Puyvelde, P., Velankar, S. and Moldenaers, P. (2001) Rheology and Morpholo-gy of Compatibilized Polymer Blends. Current Opinion in Colloid and Interface Science, 6, 457-463. https://doi.org/10.1016/S1359-0294(01)00113-3
[21] Camacho, W. and Karlsson, S. (2001) NIR, DSC and FTIR as Quantitative Methods for Compositional Analysis of Blends of Polymers Obtained from Recycled Mixed Plastic Waste. Polymer Engineering and Science, 41, 1626-1635.
https://doi.org/10.1002/pen.10860
[22] Blaine, R.L. Thermal Applications Note, Polymer Heats of Fusion.
[23] Nishino, T., Matsumoto, T. and Nakamae, K. (2000) Surface Structure of Isotactic Polypropylene by X-Ray Diffraction. Polymer Engineering and Science, 40, 336-343.
https://doi.org/10.1002/pen.11167
[24] Inci, B. and Wagener, K.B. (2011) Decreasing the Alkyl Branch Frequency in Preci-sion Polyethylene: Pushing the Limits toward Longer Run Lengths. Journal of the American Chemical Society, 133, 11872-11875. https://doi.org/10.1021/ja2040046