“Tensile and Shear Strength Approximate Prediction of Friction Surfaced
Tool Steel through ANN”
V. Pitchi Raju
Prof. Mechanical Engineering Dept, Indur Institute of Engineering & Technology, Hyderabad
---***---
ABSTRACT - Friction surface treatment is well-established solid technology and is used for deposition, abrasion and corrosion protection coatings on rigid materials. This novel process has wide range of industrial applications, particularly in the field of reclamation and repair of damaged and worn engineering components. In this paper, we present the prediction of tensile and shear strength of friction surface treated tool steel using ANN for simulated results of friction surface treatment. This experiment was carried out to obtain tool steel coatings of low carbon steel parts by changing input process parameters such as friction pressure, rotational speed and welding speed. The simulation is performed by a 33-factor design that takes into
account the maximum and minimum limits of the experimental work performed by the 23-factor design. Neural network
structures, such as the Feed Forward Neural Network (FFNN), were used to predict tensile and shear strength of tool steel sediments caused by friction.
Keywords: Friction surfacing, Artificial Neural Networks (ANN), Process Parameters.
1. INTRODUCTION
Friction surfacing is an advanced technology that can effectively deposit a metal on another metal. In this process, the consumable rod is rotated and forced against the substrate in the axial direction. A large quantity of hotness is produced due to the friction among the consumable rod and the friction contact surface between the substrates, and the contact end of the metal consumption rod is plasticized after a certain period of time. The substrate is then horizontally moved to a vertically consumable rod, so that a layer of mechanical material is deposited on the substrate. Friction surface treatment has been used for a variety of hard surface metal coatings, such as mild steel or stainless steel coating on the tool steel coating. In this process, the strong adhesion between the coating and the substrate can only be achieved by applying a high contact pressure, but this requires expensive machinery [1,2].
Friction surface treatment has significant advantages over conventional fusion welding processes. This novel process correlates many process parameters, which directly affect the quality of the deposit. In this process, the obtained coating is fairly flat and regular, and there is no conventional cross-sectional profile of the invasive meniscus [3]. This process can be considered in another key area that is damaged and damaged by the reclamation and repair of engineering components [4]. A number of industrial applications have been observed in friction surface treatment and are mainly used to deposit hard materials on the cutting edges of various tools required for the food processing, chemical and medical industries. The process can be widely used in tool steel, aluminum, stainless steel and mild steel, copper-nickel alloy and other materials [5-7]. This innovation process can be carried out in open air [8], water [9] and inert gas [10].
surfacetoolsteelM2sediments.
Artificial neural networks (ANNs) can be used in various fields of engineering applications, by using the input data to obtain the required information, to overcome the shortcomings of traditional methods [12]. The prediction of the friction surface response is carried out by the mathematical modeling of ANN, which represents the tensile and shear strength of the input parameters.
[image:2.612.152.464.229.385.2]
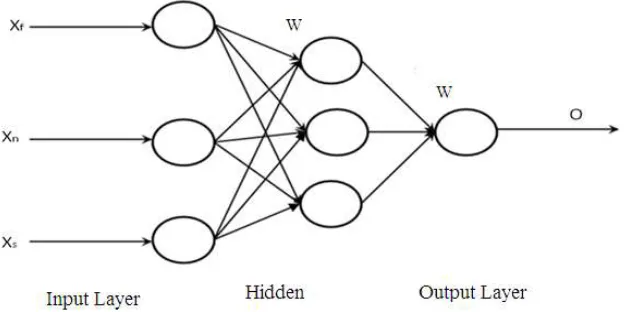
The structure of the feedforward neural network (FFNN) consisting of three layers consists of a concealment and output layer and an arbitrary activation function is a general approximator [12]. The architecture of the FFNN network model is shown in Figure 1.
Fig .1. Architecture of FFNN network model
Figure 1 depicts the network model of input neurons, hiding neurons and output neuronal structures. Input layers include network input process parameters such as friction pressure, velocity, and welding speed. Hidden layers include neurons known to map points in the input area to coordinates in the output area. The output area is called the transfer function of the activation function processing input layer. In this case, the hyperbolic tangent function is selected as the activation function because it tests the minimum mean square error between the other functions, such as Gaussian and logarithmic functions [12].
2. EXPERIMENTAL WORK
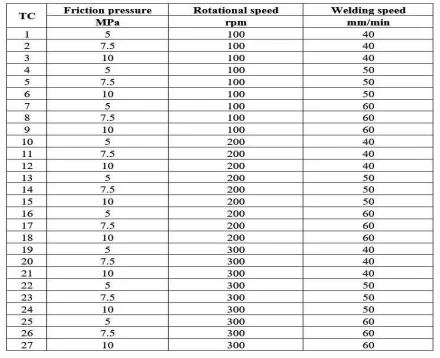
The main process constraints such as friction, rotational speed and welding pressure are selected as the process constraints for the investigational procedure of numerous manageable process parameters which affect the tensile and shear strength of the friction surface tool steel M2.
Table.1.The process parameters used and tool steel deposits over low carbon steel obtained in the experimental work.
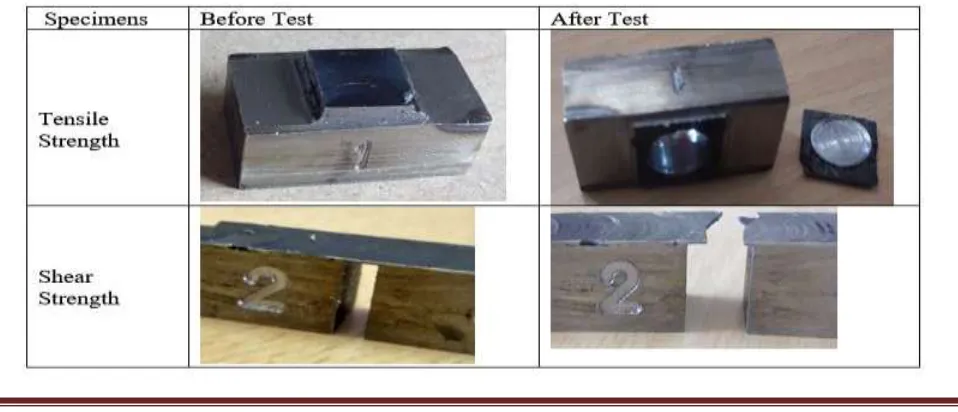
The tensile strength was determined experimentally by applying a tangential force in the contact area by tensile test method and shear strength. The values obtained are listed in Table 1. Tensile strength is of paramount importance for designing various engineering components such as containers, pressure vessels, turbine blades, helicopter blades and pumps. Samples for tensile strength tests have square-sized deposits and have round holes from the other side of the sample. The friction surface of the tool steel deposits is separated from the low carbon steel substrate by the influence of the tension applied by the indenter. The tensile strength of the sample is then calculated by the ratio of the applied tensile load to the bearing area of the sample. The shear strength test is of the utmost importance for the design point of view, which is determined by applying tangential loads to the deposit. The shear strength of the specimen is calculated by dividing the applied load by the shear area. Tensile strength test before and after the test sample in Table 2.
[image:3.612.67.546.527.733.2]3. EFFECT OF PROCESS PARAMETERS ON BOND STRENGTH OF THE DEPOSIT
3.1. Determination of Regression Equations
Construct the variance analysis (ANOVA) table to check the importance of all the process parameters for the tensile strength to determine the regression equation. The regression equation for the response to tensile strength, after eliminating less
important terms, can be rewritten as
y = 103.4 + 15.125X1 + 21.875X2 + 6.875X3-18.87 X1X3 + 21.875X2X3
Similarly, the regression equation for the shear strength after eliminating the least significant term can be rewritten as y = 43.75 + 4.5X1 + 9.75x2 + 4.25X3-9X1X3 + 11.25X 2X3
3.2 Prediction of Tensile and Shear Strength by using Artificial Neural Network (ANN)
[image:4.612.88.528.352.710.2]The MATLAB R2012a version of the neural network toolbox is used to develop artificial neural networks (ANN) models for predicting the tensile and shear strength of frictional surface sediments. The input layer consists of three process parameters, namely, friction pressure, speed and welding speed, the output layer represents the tensile strength and shear strength. Initially enter the input data into the neural network, and then simulate to achieve the output. When creating a neural network, the velocity constants and the maximum number of neurons are changed to achieve different results. This is done by using trial and error methods. The experimental parameters of the artificial neural network (ANN) model are shown in Table 3.1.
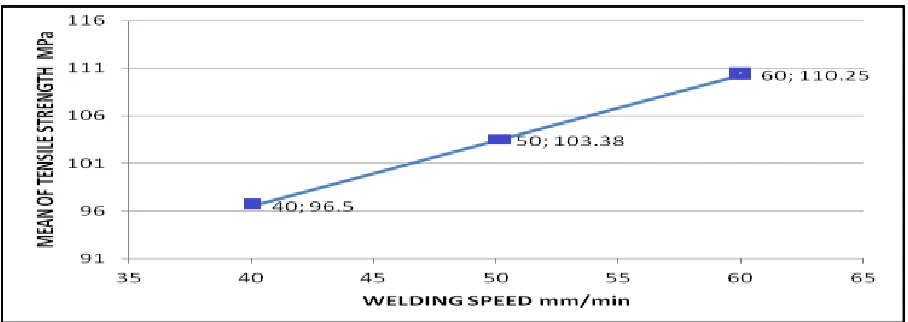
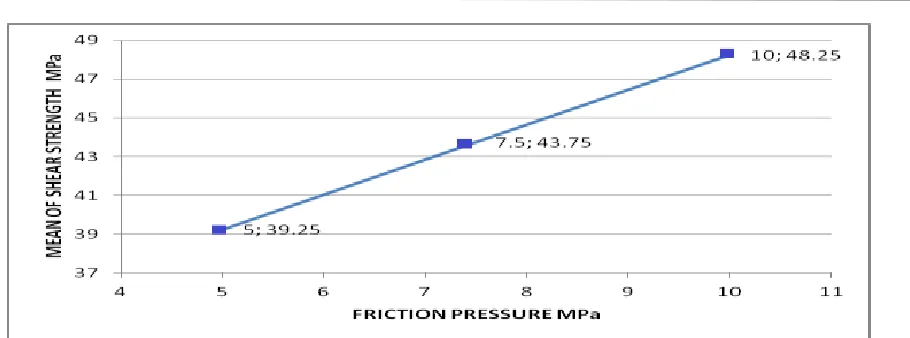
The effect of process parameters such as friction pressure, rotational speed and welding speed on mean of tensile potency and mean of shear potency are indicated in the figures 3.3, 3.4, 3.5, 3.6, 3.7 and 3.8
[image:5.612.76.534.313.454.2]Fig 3.3: Variation of mean of tensile strength at different friction pressures
[image:5.612.79.533.483.644.2]Fig 3.6: Variation of mean of shear strength at different friction pressures
Fig 3.7: Variation of mean of shear strength at different rotational speeds
Fig 3.8: Variation of mean of shear strength with welding speeds
4. RESULTS AND DISCUSSIONS
[image:6.612.86.541.78.247.2]the predicted values of the tensile strength of the sediments using FFNN and the experimental values. Figure 4.2 shows the predicted Vs experimental values for shear strength.
Fig. 4.1. Depicts the variation of predicted and experimental values of tensile strength of the deposit by using FFNN
Fig 4.2: Predicted Vs Experimental Values for Shear Strength
CONCLUSION
[image:7.612.78.535.323.523.2]REFERENCES
[1]. P.Lambrineas and al.1990 Institute of Engineering, Australian Tribology Conference. edited by D.Scott,Institute of Engineering Australian National Conference, 90(14) 23
[2]. B M Jenkins and E D Doyle 1987 Proceedings of the International Tribology Conference Australian National conference, 87(18)
[3]. VSugandhi and V.Ravi Kumar 2012 Optimization of Friction Surfacing Process Paramters for AA1100 Aluminum Alloy Coating with Mild Steel Substrate using Response Surface Methodology (RSM) Technique. Modern Applied Science, published by Canadian Center of Science and Education, 6(2) 69-73
[4]. Yamashita Y and Fujita K 2002 Newly developed repairs on welded area of LWR stainless steel by friction surfacing . Journal of Nuclear Science Technology, 105-12.
[5]. Puli R and Ram GDJ 2012 Microstructures and Properties of Friction Surfaced Coatings in AISI 440C Stainless Steel. Surf Coat Tech,207(310)
[6]. Hanke S and al. 2011 Cavitation Erosion of NiAl – Bronze Layers Generated by Friction surfacing .Wear, 273(32)
[7]. Govardhan D and al. 2012 Characterization of Austenitic Stainless Steel Friction surfaced Deposit Over Low Carbon Stee. 36(206)
[8]. Tokisue H and Katoh K 2005 Structures and mechanical properties of multilayer friction surfaced aluminum alloys. Report of the research Institute of Industrial Technology Nihon University,78
[9]. Li JQ and Shinoda T 2000 Underwater friction surfacing. Surface Engineering, 16(1) 31-35
[10].Chandrasekaran M and Batchelor AW 1997 Study of the interfacial phenomena during friction surfacing of aluminum with steel. Journal of Material Sciences, (32) 6055-6062
[11]. H Okuyucu and al. 2007 Artificial neural network application to the friction-stir welding of aluminum plates .Materials & Design , 28 (1), 78-84