www.wjpr.net Vol 4, Issue 07, 2015.
904
METHOD DEVELOPMENT AND VALIDATION OF MOXIDECTIN IN
SYNTHETIC MIXTURE USING UV-SPECTROPHOTOMETRY
P Sathish Babu, K. Anand Babu*, D Revathi and K Chitra
Department of Pharmaceutical Chemistry, Faculty of Pharmacy, Sri Ramachandra University,
Porur, Chennai-600 116, Tamil Nadu, India.
ABSTRACT
A sensitive, accurate and validated UV Spectrophotometry method has
been developed to determine Moxidectin in bulk drug and synthetic
mixture. The Calibration graph was plotted over the range of 8-22
µg/ml with correlation coefficient value of 0.9994. The Limit of
Detection (LOD) and Limit of Quantification (LOQ) for Moxidectin
were 0.0264 and 0.08 µg/ml. The percentage RSD for precision of the
method was found to be less than 2%. The assay percentage was found
to be 100.8%. The newly developed method was validated according
to the ICH guidelines with respect to linearity, accuracy, precision and
specificity.
KEYWORDS: Moxidectin, Validation, Synthetic mixture, ICH Guidelines.
INTRODUCTION: Moxidectin is a broad-spectrum, potentendectocide which acts against a wide range of insects, nematodes and acari. It is worldwide used as a parasiticide in a variety
of mammalian species. Moxidectin is a semi-synthetic methoxime derivative of LL F-2924α,
commonly referred as F-alpha or nemadectin, a 16-member pentacyclic lactone of the
milbemycin class. F-alpha is a product of fermentation of Streptomyces cyaneogriseus
subspecies. F-alpha possesses strong anthelmintic activity but has limited ectoparasiticide
activity. Moxidectin is the result of chemical optimization of F-alpha. The mode of action of
Moxidectin on parasites has been demonstrated that these compounds act by binding to
ligand-gated chloride channels, more specifically the subtypes that are gamma-aminobutyric
(GABAA) mediated and glutamate-gated.[1] The consequence of ML binding and activation is
Volume 4, Issue 7, 904-912. Research Article ISSN 2277– 7105
*Correspondence for Author
K. Anand Babu Department of
Pharmaceutical Chemistry,
Faculty of Pharmacy, Sri
Ramachandra University,
Porur, Chennai-600
116,Tamil Nadu, India. Article Received on 30 April 2015,
www.wjpr.net Vol 4, Issue 07, 2015.
905
an increased permeability, leading to an influx of chloride ions and flaccid paralysis of the
parasite leading to death.[2]
Moxidectin has been determined by HPLC,[3-9] HPLC-MS/MS,[10,11] RP-HPLC,[12]
UHPLC-MS/MS,[13]LC-MS/MC,[14] ],LC-MS/MS,[15-17] LC-MSD Quad &Ion Trap[18] and HPLC-UV
spectroscopy[19]methods in single and combined dosage form. Literature reveals that few
chromatographic methods in biological fluids and tissues were reported along with other
anthelmintic drugs. Even though various methods has been reported to carry out Moxidectin
in individual / bulk drug or combination with other drugs, no method has been so far evolved
for estimation of Moxidectin as an individual drug in UV spectroscopy. The present study
was aimed to carry out the estimation of Moxidectin in synthetic mixture by UV-
[image:2.595.193.403.327.490.2]Spectrophotometry method.
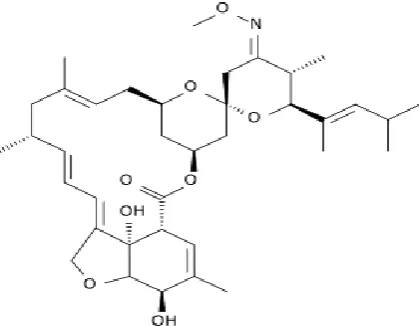
Fig No.1: Structure of Moxidectin
IUPACNAME: Spiro[11,15-methano-2H,13H,17H-furo[4,3,2-pq][2,6]-benzodioxacyclo-octadecin-13,2’-[2H]pyran-17-one]-6’-[1,3-dimethyl-1-butenyl]3’,4’5,6,6’,7,10,11,14,15,17a,
20,20a,20b-dihydro-4’-[methoxyimino]- 5, 6,8,19 -tetra-methyl-[6R [2aE,4E,5’S*,6R*,6’S*
(E),8E,11R*,13R*,15S*,17aR*,20R*,20aR*,20bS*]
MOLECULAR FORMULA: C37H53NO8
MATERIALS AND METHODS Experimental Section
Moxidectin used in the study was procured as a gift sample. Ethanol-99.9% (AR grade) and
all other analytical grade reagents obtained from Fischer and were used. Milli-Q water
www.wjpr.net Vol 4, Issue 07, 2015.
906 Instrumentation
UV Spectrophotometry analysis was carried out using Perkin Elmer UV visible
spectrophotometer (Mode- Lambda 35). For weighing purpose SH Imad 2U Electronic
Analytical Balance was used. Sonication was done using Ultrasonic bath
Sonicator(Make-3.5L (H).
Preparation Of Standard Stock Solution
A quantity of 50mg of Moxidectin was accurately weighed and dissolved in 50 ml of ethanol
to get a concentration of 1000µg / ml. Further dilution was made using water to obtain the
desired concentration of the solution.
Preparation Of Synthetic Mixture
Moxidectin was mixed with Magnesium Carbonate, Starch, Magnesium Stereate and
Carboxy Methyl Cellulose (CMC). Synthetic mixture of about 200mg was prepared and from
which a quantity of the powder equivalent to 50 mg of Moxidectin was accurately weighed
and transferred to 50 ml volumetric flask, mixed with 30 ml of ethanol and sonicated for 20
min with occasional shaking. The required quantity was made up to 50ml with Ethanol. The
solution was filtered using 0.45µm whattmann filter paper. Further dilutions were made using
water to get the desired concentrations.Fig. No.2 represents the chromatogram of Moxidectin.
Fig.no.2: Chromotagram of moxidectin
Methodology
UV spectrophotometry condition was optimized and a working standard solution of
www.wjpr.net Vol 4, Issue 07, 2015.
907
analysed in the wavelength range of 200 to 400nm against Ethanol as standard. The
maximum absorbance was measured at 244.89nm. This wavelength can be employed for the
determination of Moxidectin without any interference from the other components in their
synthetic formulations.
Validation Of The Proposed Method
The proposed method was validated with respect to Linearity, Accuracy, Precision,
Specificity, Limit of detection and limit of quantification according to the guidelines
prescribed by the International Conference on Harmonization (ICH).[20]
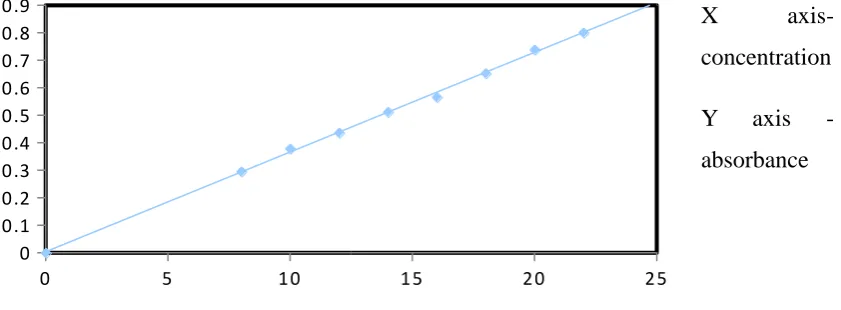
Linearity
In developed UV method, calibration curve was found to be linear in the concentration range
from 8 -22μg/ml. 8 different concentrations were used to determine the calibration curve.
Three sets of standard solution were prepared. Each set was analyzed to plot a calibration
graph. The absorbance of the solution was measured at 244.89nm against Ethanol as blank.
To ascertain linearity, Slope, Intercept and coefficient of determination (R2) of calibration
curves were calculated by constructing the calibration curve, plotting peak area versus
concentrations. (Fig. No.3)
X axis-
concentration
Y axis -
[image:4.595.106.527.454.609.2]absorbance
Fig. No. 3: Linearity of moxidectin
Table No.:1: Linear regression analysis of calibration curve of Moxidectin CONCENTRATION
(μg/ml)
ABSORBANCE (nm)
8 0.2956
10 0.3791
12 0.437
0 5 10 15 20 25
www.wjpr.net Vol 4, Issue 07, 2015.
908
14 0.5125
16 0.5666
18 0.6531
20 0.739
22 0.8009
SLOPE 0.036264
INTERCEPT 0.003562
R2 0.999384
Limit of detection and Limit of Quantification
By calculating the signal-to-noise ratio using the equations designated by the International
Conference on Harmonization (S/N, i.e., 3.3 for LOD and 10 for LOQ), the Limit Of
Detection (LOD) and Limit Of Quantification (LOQ) of the drug was calculated. The LOD
and LOQ values for the concentration range between 8 -22μg/ml of Moxidectin were
evaluated from the calibration graph.
Table No.: 2: Formulas for LOD and LOQ calculation
LOD=3.3 X σ/S LOQ=10 X σ/S
Where, σ = standard deviation of the response and S = slope of the calibration curve.
Accuracy
By calculating recovery of Moxidectin by the standard addition method, the accuracy of the
method was determined. The sample was spiked using synthetic mixture with 80%, 100%
and 120% standard solution. The amount was estimated by applying obtained values to the
respective regression line equations. A triplicate repetition of the experiment was done.
Table No.: 3: Recovery study of synthetic mixture of Moxidectin Amount
Added (%)
Actual Concentration Taken (Ml)
% Recovery (%)
80 0.4 100.25
100 0.6 100.62
120 0.8 100.81
Precision
By carrying out six independent assays of the test sample, precision was calculated by the
proposed method. %RSD (Relative Standard Deviation) of six assays obtained were
calculated from the calibration curves prepared in medium which was run triplicate in the
www.wjpr.net Vol 4, Issue 07, 2015.
[image:6.595.164.424.89.293.2]909 Table No.: 4: % RSD calculation of synthetic mixture of moxidectin
Concentration
(µg/Ml) Precision
Standard Deviation
18 0.7285 0.00004
18 0.7292 0.0001
18 0.7284 0.0006
18 0.7287 0
18 0.729 0.0006
18 0.7289 0.0001
MEAN/
AVERAGE 0.7287 0.00029
Specificity
The method was found to be specific by assessing the values obtained from the sample
solution. There was no interference of the materials used in the synthetic mixture with the
analytes.
Assay
A sample of 16 µg/ml was prepared and the mean absorbance was measured at 244.89nm and
the assay value was calculated.
RESULT AND DISCUSSION
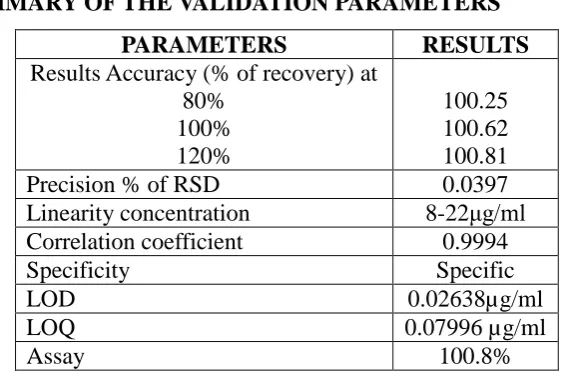
A summary of the validation parameters are tabulated (Table no.5). Linear regression data
over a concentration range of 8 -22μg/ml showed good linear relationship for Moxidectin.
The correlation coefficient value was 0.9994. The Limit of detection (LOD) and limit of
quantification (LOQ) for Moxidectin were 0.0238 and 0.07996µg/ml respectively. Accuracy
was calculated in three different concentrations like 80%, 100% and 120% standard solution.
The average percentage recovery was found to be 100.25%, 100.62% and 100.8 1%
respectively. The method id found to be more sensitive from the values obtained. Precision
(%RSD) was calculated and it was found to be 0.0397%. It indicates that the method is more
précised. Assay was carried out using synthetic mixture and the value was found to be
100.8%. The proposed UV Spectrophotometry method is accurate, precise, specific and rapid
for the estimation of Moxidectin in synthetic mixture.
www.wjpr.net Vol 4, Issue 07, 2015.
[image:7.595.154.435.78.269.2]910 Table No.5 SUMMARY OF THE VALIDATION PARAMETERS
PARAMETERS RESULTS
Results Accuracy (% of recovery) at 80%
100% 120%
100.25 100.62 100.81
Precision % of RSD 0.0397
Linearity concentration 8-22μg/ml
Correlation coefficient 0.9994
Specificity Specific
LOD 0.02638µg/ml
LOQ 0.07996 µg/ml
Assay 100.8%
CONCLUSION
The developed UV Spectrophotometry method used to determine Moxidectin quantitatively
in bulk and synthetic mixture was found to be simple, accurate, precise and economical.The
method showed a percentage recovery of 100% and % RSD of less than 2%. The method
wasvalidated as per ICH guidelines and can be employed for routine analysis in quality
control laboratories.
ACKNOWLEDGEMENT: We would like to sincerely thank Mrs. Uma Maheshwari of Vinayaka Mission College of Pharmacy, Salem for helping us with the drug required for the
work.
REFERENCES
1. Rami Cobb and Albert Boeckh. Moxidectin: A review of chemistry, pharmacokinetics and
use in Horses. Parasites & Vectors 2009, 25 September 2009; 2(5): 1-8.
2. Shoop WL, Mrozik H, Fisher MH.Structure and activity of avermectins and milbemycins
in animal health. Vet Parasitol, 1995; 59: 139-56.
3. K Na-Bangchang, V Banmairuroi and A Choemung.High-performance liquid
chromatographicMethod for the determination of ivermectin inPlasma.Southeast Asian
Trop Med Public Health, September 2006; 37(5): 848-58.
4. FuadAl-Rimawi. A HPLC-UV method For Deteermination Of Three PesticidesIn Water.
International Journal Of Advances In Chemistry (IJAC), May 2014; 2(2): 1-8.
5. Danaher M, O'Keeffe M, Glennon JD.Validation and robustness testing of a HPLC
method for the determination of avermectins and moxidectin in animal liver samples
www.wjpr.net Vol 4, Issue 07, 2015.
911
6. B. Roudaut.Multiresidue method for the determination of avermectinandmoxidectin
residues in the liver using HPLC with fluorescence detection. Analyst, 1998; 123:
2541-44.
7. Dayue Shang, Angelo Di Cicco, Nicole Gibbons, Monica Dyck and Helen
Nicolidakis.Determination of Emamcetin Benzoate and other Avermectin residues in fish
tissues using LC/MS. Health Canada, HPFB, Western Region Laboratory, Burnaby, B.C
V5G4P2.
8. United States Department of Agriculture Food Safety and Inspection Service, Office of
Public Health Science.Determination of Ivermectin, Doramectin, and Moxidectin by
HPLC.03/28/2011; CLG-AVR. 04(04): 1-13.
9. Fort Dodge Animal Health. Validation of HPLC method M-2002.05 for the determination
of moxidectin residues in sheep tissue, 12 Nov 2004; Data No.24339.
10.FláviaLadaDegaut Pontes, Roberto Pontarolo, Francinete Ramos Campos,
JoãoCleversonGasparetto, Marco André Cardoso, MárioSérgioPiantavini And Angela
Cristina Leal BadaróTrindade. Development And Validation Of An HPLC-MS/MS
Method For Simultaneous Determination Of Ivermectin, Febantel, Praziquantel,
PyrantelPamoate And Related Compounds In Fixed Dose Combination For Veterinary
Use. Asian J Pharm Clin Res, 2013; 6(2): 191-200.
11.Secretariat agricultural protection ministry of agriculture, livestock and Food supply.
Food and contaminants residue analysis.Lanagros, Brazil.
12.Elena Gabriela Oltean, A. NicaRomvac Company Sa. Development And Validation Of A
RP- HPLC Method For The Quantitation Studies Of Ivermectin In Solutions Dosage
Forms.MedicamentulVeterinar / Veterinary Drug, December 2011; 5(2): 68-72.
13.LucíaGeis-Asteggiante, Steven J. Lehotay, and Alan R. Lightfield.Multi-class,
multi-residue method (MMM) for more veterinary drug multi-residues in animal tissues United states
department of agriculture. ERRC.
14.MeenakshiDahiya, NidhiDubey, Prabha Singh& GN Singh. Development and validation
of LC-MS/MS method to determine the residue of veterinary drugs ivermectin,
doramectin and moxidectin in milk.Indian journal of chemistry, October 2013; 52B:
1313-17.
15.HerlindeNoppe, KarolienVerheyden, Julie VandenBussche, KlaasWille and Hubert De
Brabander.Detection of macrocyclic lactones in porcine liver, meat and fish tissue using
LC–APCI–MS–MS. Food Additives and Contaminants- Taylor and Francis Group, 2009;
www.wjpr.net Vol 4, Issue 07, 2015.
912
16.Kitzman, D, Wei, S Y, Fleckenstein. L. Liquid chromatographic assay of Ivermectin in
human plasma for application to clinical pharmacokinetic studies. Journal
ofpharmaceutical and biomedical analysis, 2006; 40: 1013-20.
17.Regina Furlani, Fernanda Gomes, Silvia Tfouni, and Monica Camargo. Development of
an AnalyticalMethod for Determination ofAntiparasitics Residues in MilkUsing
QuEChERS and Analysis byLC-MS/MS.Agilent technologies,USA, February 6-2014;
1-4.
18.AnthonyGravell.Validated method for the determination of veterinary medicines in the
environment using the Agilent LC-MSD quad an ion trap.Agilent technologies, USA,
May 31-2005; 1-12.
19.Fuad Al-Rimawi. A HPLC-UV Method ForDeteermination Of Three Pesticides In Water.
International Journal of Advances in Chemistry (IJAC), May 2014; 2(2): 1-8.
20.The International Conference on harmonization Q2 (R1).2005; Validation of Analytical