Optimising the airflow performance of ventilators for
natural ventilation in buildings.
CHILENGWE, Nelson.
Available from Sheffield Hallam University Research Archive (SHURA) at:
http://shura.shu.ac.uk/19458/
This document is the author deposited version. You are advised to consult the
publisher's version if you wish to cite from it.
Published version
CHILENGWE, Nelson. (2005). Optimising the airflow performance of ventilators for
natural ventilation in buildings. Doctoral, Sheffield Hallam University (United
Kingdom)..
Copyright and re-use policy
SHER'-saS
H
M
1M
NIVERSITY
U
LB4;
■■■’
(M£J C@{ fRE
u n c m m ,
tond
sires
;
SH6Fffl5S1 liHffi.
Fines are charged at 50p per hour
l
0res
*.(/{//Ccj
IProQuest Number: 10694339
All rights reserved
INFORMATION TO ALL USERS
The quality of this reproduction is dependent upon the quality of the copy submitted.
In the unlikely event that the author did not send a com plete manuscript and there are missing pages, these will be noted. Also, if material had to be removed,
a note will indicate the deletion.
uest
ProQuest 10694339
Published by ProQuest LLC(2017). Copyright of the Dissertation is held by the Author.
All rights reserved.
This work is protected against unauthorized copying under Title 17, United States C ode Microform Edition © ProQuest LLC.
ProQuest LLC.
789 East Eisenhower Parkway P.O. Box 1346
Optimising the airflow performance of
ventilators for natural ventilation
in buildings
Nelson Chilengwe
A thesis submitted in partial fulfilment of the requirements of
Sheffield Hallam University
for the degree of Doctor of Philosophy
Acknowledgements
The completion of this thesis fulfils a desire and dream which was originally implanted into my mind by my late father (Johnson Laban Chilengwe) and which I have held for many years until finally fulfilling it.
In this undertaking, I owe the greatest debt to Professor Steve Sharpies, my supervisor, for his guidance, flexibility, being accommodating, supportive, his active interest in this work and his interest in my personal development. The work that we accomplished together represents the most delightful and creative experience of my academic life.
Mr Les Goodwin (senior technician at Sheffield Hallam University) has also provided constant inspiration through his special workshop skills and efficiency of getting the practical things sorted just at the right time. Mr Malcolm Jackson's (Sheffield Hallam University, Materials Engineering Laboratory) assistance with mesh-screen and surface roughness measurements is highly appreciated.
Mrs Ann Wilson and Sue Biggins were great in handling and dealing with administrative aspects throughout the period of this research. Their patience and efficiency deserves special mention and is therefore acknowledged.
I would like to acknowledge the financial and institutional support provided by Sheffield Hallam University (initial bursary) and subsequently the Engineering and Physical Sciences Research Council (EPSRC) through Grant number GR/R70637. Many thanks to BPD Ltd for supplying some of the components used in this investigation.
My appreciation is also expressed to my many friends, too numerous to list, who in one way or another have provided invaluable support throughout the period of this research.
ABSTRACT
Ventilation is essential if an adequate environment in buildings is to be provided. Natural ventilation is a sustainable method commonly used to achieve this. Natural ventilation can occur from random flow of air through unintentional (adventitious) openings, commonly referred to as
infiltration, or can be facilitated through purpose-provided openings - commonly called
controlled natural ventilation. Stringent national and international regulations have led to
Contents
List of tables List of Figures Nomenclature
Chapter 1: Introduction
1.1 Background... 1
1.2 Energy and Environmental Impact of Buildings...1
1.3 Indoor Environment: Occupants' Comfort and H ealth...2
1.4 Sustainable Approach to Building Design... 2
1.5 Application Domain...3
1.6 Aims and Objectives...5
1.7 Methodology...6
1.8 Thesis Outline...6
Chapter 2: Natural Ventilation in Buildings
2.1 Background... 82.1.1 Why ventilate buildings?...8
2.1.2 What is ventilation?...9
2.1.3 How are buildings ventilated?... 9
2.1.4 Why natural ventilation?... 13
2.2 Driving Forces in Natural Ventilation of Buildings... 14
2.2.1 Wind induced driving fo rces...15
2.2.2 Thermal buoyancy driving forces (stack effect)... 16
2.2.3 Combined wind and thermal buoyancy... 17
2.2.4 Factors that affect the driving forces...18
2.3 Natural Ventilation Strategies... 18
2.3.1 Single sided ventilation... 19
2.3.2 Cross-flow ventilation...19
2.3.3 Stack ventilation...20
2.3.4 Solar-induced ventilation...21
2.4 Natural Ventilation Openings...22
2.4.1 Adventitious openings... 23
2.4.2 Purpose-provided openings... 23
2.4.3 Controlled air inlets... 24
2.4.4 Influence o f ventilation openings on indoor air movement... 25
2.5 Limitations and Disadvantages of Natural Ventilation...27
2.6 Practical Considerations for Implementing Natural Ventilation... 28
2.7 Some Design Considerations...29
2.7.1 Ventilation rates...30
2.7.2 Infiltration and air-leakage...31
Chapter 3: Basic Principles of Fluid Flow
3.1 Background... 36
3.2 Flow Visualisation...36
3.2.1 Streamlines and flow patterns...37
3.2.2 Uniform and non-uniform flo w...37
3.2.3 Steady and unsteady flo w... 38
3.2.4 Laminar and turbulent flo w...38
3.2.5 Flow separation... 40
3.3 Fluid Forces...41
3.3.1 Alternative definition o f Reynolds number... 41
3.3.2 Momentum o f a fluid particle...42
3.4 Continuity of Flow...43
3.5 Fluid Pressure... 44
3.5.1 Fluids at rest...44
3.5.2 Fluids in motion...46
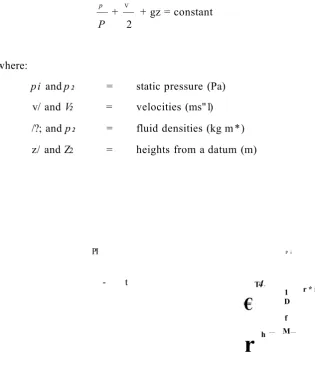
3.6 Bernoulli's Equation...46
3.7 Illustrative Applications... 47
3.7.1 Flow across a sharp-edged orifice... 47
3.7.2 Flow through rectangular slots...50
3.7.3 Flow through mesh screens... 51
3.7.4 Flow between parallel plates... 53
3.7.5 Flow through air permeable materials...55
3.8 Concluding Remarks...55
Chapter 4: Fundamentals of Airflow through Openings
4.1 Scope of Investigation...574.2 Developments in Ventilator Design...58
4.2.1 Design for provision o f airflow...59
4.2.2 Design fo r elimination o f draughts... 60
4.2.3 Design for noise reduction...61
4.2.4 Design for control... 62
4.2.5 Design for aesthetics... 64
4.2.6 Design fo r elimination o f security risk...65
4.2.7 Design for elimination o f weather damage...65
4.2.8 Design for night cooling...66
4.3 Ventilator Airflow Performance Assessment...66
4.4 Regulations and Standards... 67
4.4.1 Airflow provisions...68
4.4.2 Component airflow performance...68
4.5 Theoretical Models... 69
4.6 Experimental Methods...70
4.6.1 Airflow through cracks... 70
4.6.2 Airflow through mesh-screens... 73
4.6.3 Airflow through whole ventilator units... 76
4.6.4 Discharge coefficients... 77
4.7 Analytical Methods... 78
4.7.1 Power law equations...79
4.8 Review of Airflow through Ventilator Openings Research...81
4.8.1 Ventilator component testing in the laboratory...87
4.9 Concluding Remarks...90
Chapter 5: Experimental Investigation
5.1 Introduction...935.2 Experiments...93
5.2.1 Experimental test rig and instruments...93
5.2.2 Experimental method...96
5.2.3 Validation o f experimental procedure... 98
5.2.4 Data reduction...98
5.2.5 Data correction to standard air conditions... 99
5.2.6 Range o f investigation parameters... 99
5.3 Components Investigated... 100
5.3.1 Ordinary slots... 100
5.3.2 Wooden louvers...101
5.3.3 Commercial louvers...102
5.3.4 Square round-wire meshes...102
5.3.5 Polygon-type meshes... 103
5.4 Experimental Results and Discussion...104
5.4.1 Measured airflow characteristics o f ventilators...104
5.4.2 Derived airflow characteristics o f ventilators... 104
5.4.3 Air-leakage characteristics o f the test rigs...105
5.4.4 Airflow performance o f ordinary slots... 106
5.4.5 Airflow performance o f louvers...110
5.4.6 Airflow performance o f meshes... 113
5.4.7 Airflow performance oflouver-mesh combinations...114
5.4.8 Effect o f separation between louver and mesh... 121
5.4.9 Directional airflow performance o f ventilators...124
5.4.10 Low and high pressure ventilator characteristics...127
5.4.11 Effect o f rotating non-square meshes... 133
5.4.12 Establishment o f boundary conditions fo r use in CFD investigations 134 5.5 Concluding Remarks...136
Chapter 6: Computational Fluid Dynamics
6.1 Introduction... 1376.2 Fundamentals of Computational Fluid D ynamics... 137
6.2.1 Definition o f C FD...138
6.2.2 Governing equations...138
6.2.3 Turbulence models...139
6.2.4 Discretization... 140
6.2.5 Numerical methods...141
6.3 The CFD Procedure... 142
6.3.1 Geometry definition...142
6.3.2 Grid generation and problem specification...143
6.3.3 Flow solution and solution control methods...146
6.4 Application of CFD to airflow in/around buildings...149
6.4.1 Assessment o f CFD use as tool in airflow investigations...150
6.4.2 Natural ventilation airflow studies employing CFD... 150
6.4.3 Problems associated with the use o f CFD... 151
6.5 Review of Application of CFD to Airflow through Openings Research... 152
6.6 Description of the Simulation Model...153
6.6.1 FLOVENT modelling and its role in this research... 154
6.6.2 Simulation model domain and adopted grid... 155
6.6.3 Boundary conditions... 156
6.6.4 Turbulence model selectedfor application in this research... 157
6.6.5 Validation o f simulation method...157
6.7 Steady-State Simulations of Airflow through Slots...162
6.7.1 Case study I: Ordinary slots o f varying depths...162
6.7.2 Case Study II: Ordinary slots o f varying heights...177
6.8 Steady-State Simulations of Airflow through Commercial Louvers...190
6.8.1 Simulated cases...191
6.8.2 Simulation domain...191
6.8.3 Ventilator models...192
6.8.4 G rid... 193
6.8.5 Range o f investigations (airflow rates and pressure differentials)... 194
6.8.6 Boundary conditions... 194
6.8.7 Simulation results...196
6.9 Problems Encountered and Limitations... 199
6.10 Concluding Remarks... 200
Chapter 7: Ventilator Airflow Performance Optimisation
7.1 Introduction...2027.2 Experimental and Computational Comparisons... 202
7.2.1 Slots o f varying depth...205
7.2.2 Slots o f varying height...209
7.2.3 Commercial louvers... 216
7.2.4 General discussion o f CFD/experimental results... 218
7.3 Overview of Comparison with other Research Results... 219
7.4 Ventilator Airflow Performance Optimisation... 227
7.4.1 Optimisation approach...227
7.4.2 Parameters for optimisation... 229
7.4.3 Optimisation criteria... 232
7.5 Optimisation Case Studies and Results... 233
7.5.1 Louvers at different blade inclinations...234
7.5.2 Mesh-screens... 238
7.5.2 Horizontal louvers with mesh-screens...241
7.5.3 Inclined louvers with mesh-screens... 247
7.5.4 Horizontal louvers with gap between blades and mesh-screen...250
7.5.5 Inclined louvers with gap between blades and mesh-screen...256
7.6 Evaluation of Proposed Equations...265
7.8 Limitations of Proposed Equations...269
Chapter 8: Final Remarks
8.1 Introduction...272
8.2 Review of Aims and Objectives of the Research...272
8.3 Overview of Main Findings... 273
8.4 Design Methodology of Ventilators for Natural Ventilation... 276
8.5 Recommendations for Future Work... 278
8.6 Concluding Remarks... 280
Bibliography...
2
si
Appendices
Appendix A: Experimentally Measured, CFD Predicted and Derived Parameters... 292List of Tables
Chapter 2
Table 2.1: Impact o f air speed on occupants 26
Table 2.2: Summary o f airflow patterns resulting from driving forces o f different magnitudes 27
Chapter 4
Table 4.1: Mesh screen specification and best fit equation for second order polynomial 75
Table 4.2: Effect o f small air grating on ventilation o f unheated rooms 82
Chapter 5
Table 5.1: Details o f round wire meshes used in investigation 103
Table 5.2: Air leakage characteristics o f test rigs 105
Table 5.3: Variation o f relative airflow (Q/Q12) with pressure differential for slot type B 109 Table 5.4: Experimental and derived data for aluminium louvers (depressurisation) 111 Table 5.5: Experimental and derived data for wooden louver 1 with various mesh
sizes at 0 0 and 60 0 blade inclinations 112
Table 5.6: Derived parameters for various mesh screens 113
Table 5.7: Comparison o f individual and combinedflows Q (m3/s) for horizontal blades
(depressurisation) 117
Table 5.8: Comparison o f individual and combined flows Q (m3/s) for 60 0
inclined blades (depressurisation) 117
Table 5.9: Comparison o f individual and combined pressure losses for
horizontal blades (depressurisation) 118
Table 5.10: Comparison o f individual and combined pressure losses for 60 0
inclined blades (depressurisation) 118
Table 5.11: Contribution o f mesh to overall resistance o f combined unit for horizontal blades 119 Table 5.12: Contribution o f mesh to overall resistance o f combined unit for 60 0 inclined blades 119
Table 5.13: 60° Louver blade and 35% FA mesh 122
Table 5.14: Summary o f effect ofseparation for Louver 1 with a 35% free area mesh 123 Table 5.15: Measured airflow rates for inlet and outlet configurations at various pressure drops 126 Table 5.16: Power law regressions for meshed louvers at various blade angles 129 Table 5.17: Comparison o f air flow rates Q (m3/s) from low and high AP (Pa) equations
for louver with 60 0 blades 130
Table 5.18: Variations in derived airflow rates for louver with 35% FA mesh 130 Table 5.19: Comparison o f airflow rates Q (m3/s) resulting from mesh rotation on various
Chapter 6
Table 6.1: X-velocity comparison for simple flow between parallel plates 162
Table 6.2: Simulated cases for slots o f varying depth 163
Table 6.3: Power law and quadratic formulation coefficients and indices
derivedfrom CFD predicted data for slots o f varying depths 169
Table 6.4: Variation o f AP/AP12 with slot depth to height ratio 175
Table 6.5: Simulated cases for slots o f varying height 178
Table 6.6: Power law and quadratic formulation coefficients and indices
derived from CFD predicted data for slots o f varying heights 181
Table 6.7: Variation o f AP/AP]2with slot depth to height ratio (Slots with mesh-screen) 189
Table 6.8: CFD calculated pressure differentials for inlet configurations 196
Chapter 7
Table 7.1: Experimental results and CFD calculated pressure differentials for inlet configurations 216
Table 7.2: Theoretical, experimental and CFD predicted values o f the coefficients in the quadratic equation 221
Table 7.3: Details o f round wire meshes used in investigation 232
Table 7.4: Statistical parameters for Equation 7.5 234
Table 7.5: Statistical parameters for Equation 7.8 239
Table 7.6: Statistical parameters for Equation 7.11 241
Table 7.7: Comparison o f typical predicted and expected airflow rates at selected
APs for horizontal louvers used with various mesh-screens 243
Table 7.8: Variation o f Q/Qioo with fa for horizontal louvers 244
Table 7.9: Statistical parameters for Equation 7.14 247
Table 7.10: Statistical parameters for Equation 7.17 251
Table7.11: Predicted and experimental variation o f airflow rate ratio with AP fo r L = 3mm 252
Table7.12: Experimental and predicted airflow rate ratios at various gap sizes 256
Table 7.13: Statistical parameters for Equation 7.20 257
Table 7.14: Variation o f airflow rate ratio for inclined louver blades 261
Table 7.15: Summary o f proposed equations 266
Appendix A
Table A3: Measured and derived parameters for Slots A4 to A6 295
Table A4: Measured and derived parameters for Slots B l to B3 296
Table A5: Measured and derived parameters for Slots B4 to B6 291
Table A6: Derived data for Louver 1 with 35% free-area mesh-screen (pressurisation) 298
Table A7: Derived data for Louver 1 with 35% free-area mesh-screen (depressurisation) 299
Table A8: Derived data for Louver 1 with 50% & 70% fa mesh-screens (pressurisation) 300
Table A9: CFD predicted and derived parameters for Slots A 1 to A3 301
Table A10: CFD predicted and derived parameters for Slots A4 to A6 302
Table A ll: CFD predicted and derived parameters for Slots B l to B3 303
Table A12: CFD predicted and derived parameters for Slots B4 to B6 304
List o f Figures
Chapter 2
Figure 2.1: Three basic types o f mechanical ventilation systems 10
Figure 2.2: Ventilation due to wind and thermal buoyancy 11
Figure 2.3: Mechanical and natural ventilation aspects combined in hybrid systems 12
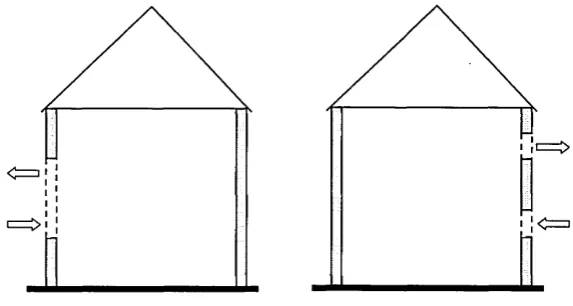
Figure 2.4: Typical pressure distribution due to wind on building envelope 15
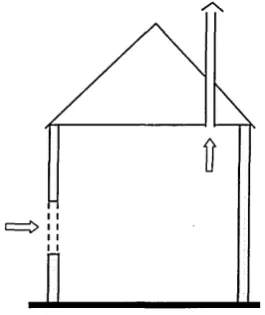
Figure 2.5: Typical pressure distribution due to stack effect 16
Figure 2.6: Superimposing wind and stack pressures 17
Figure 2.7: Illustration o f Single-sided Ventilation 19
Figure 2.8: Illustration o f Cross-flow Ventilation 20
Figure 2.9: Illustration o f Stack Ventilation 20
Figure 2.10: Illustration o f Solar-induced Ventilation 21
Figure 2.11: Possible airflow patterns in room 2 7
Figure 2.12: Internal and external view o f blower door 32
Figure 2.13: Sheffield (UK) HRS Services Ltd "Megafan " 33
Chapter 3
Figure 3.1: Flow from a slot 37
Figure 3.2: Streamlines in flow between parallel plates 38
Figure 3.3: Generation o f turbulence by a grid 39
Figure 3.4: Schematic representation o f velocity profiles 40
Figure 3.6: Definition sketch for pressure-velocity relationship for a mesh screen 47
Figure 3.7: Illustration o f flow through an orifice 48
Figure 3.8: Illustration o f vena-contracta in louvers 49
Figure 3.9: Illustration offlow through a sharp-edged orifice in a perforated plate 49
Figure 3.10: Large rectangular strip orifice 51
Figure 3.11: Diagrammatic representation o f a typical round wire mesh screen 52
Figure 3.12: illustration o f flow between parallel plates 53
Chapter 4
Figure 4.1: Example o f air grating 59
Figure 4.2: Section through louver also showing perimeter heating 60
Figure 4.3: Components o f ventilator showing upward sloping interior vanes 60
Figure 4.4: Schematic o f acoustic vent 61
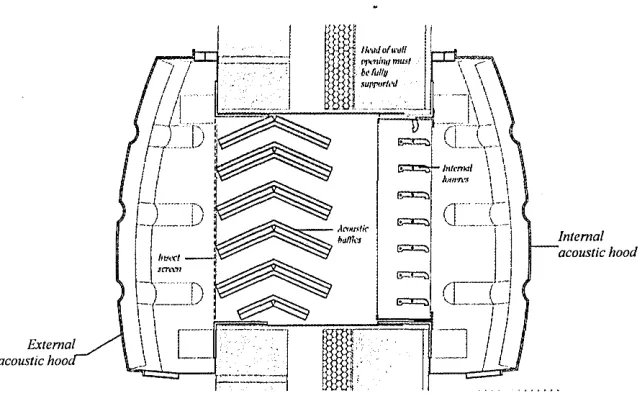
Figure 4.5: Acoustic ventilator with external and internal hoods 62
Figure 4.6: Compri pressure controlled ventilator 63
Figure 4.7: Fixed opening are pressure controlled ventilator 64
Figure 4.8: Section through prototype ventilator developed and tested at the BRE (1997) 65
Figure 4.9: Loss coefficient for round wire mesh screens 74
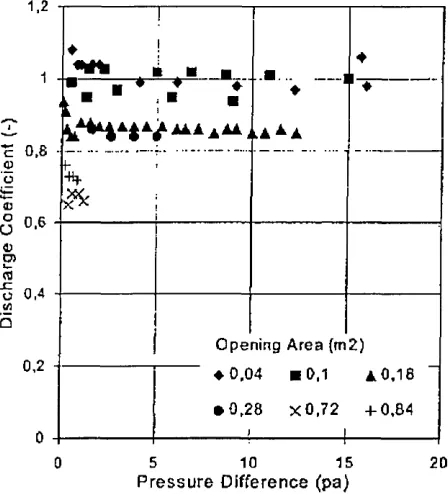
Figure 4.10: Cd variation with AP for windows 77
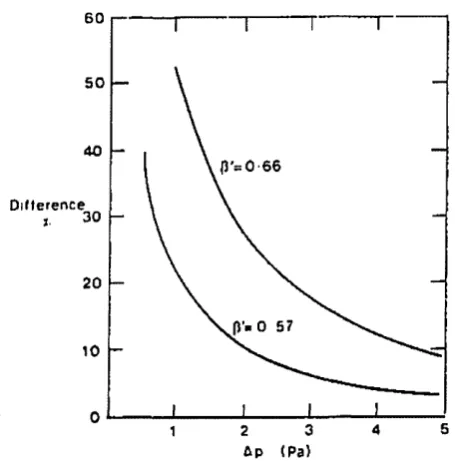
Figure 4.11: Percentage differences between power law and quadratic equations at low pressures 81
Figure 4.12: Airflow pattern resulting from vertical vane window 83
Figure 4.13: Airflow pattern resulting from horizontal vane window 84
Figure 4.14: Increased outlet size in relation to the inlet size, results in increased air speeds 84 Figure 4.15: Comparison o f airflow resistance for the open window and the louvered window 86 Figure 4.16: Comparison o f airflow resistance fo r the open window and the louvered with a
mosquito screen 86
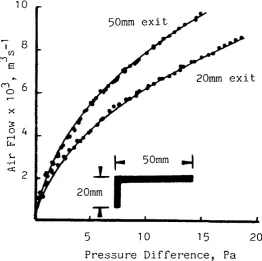
Figure 4.17: Airflow chamber test rig typically usedfor testing ventilator components 87 Figure 4.1: Flow-pressure difference curves for 6mm thickness L-shaped crack, showing effect
o f flow reversal 89
Chapter 5
Figure 5.1; Schematic representation o f experimental set-up 93
Figure 5.2: Ventilator end o f 2.4m x 2.4m x 1.2m plenum chamber 94
Figure 5.5: Experimental test rig air handling unit 95 Figure 5.6: Relationship between pressure differential and airflow rate fo r laminar flow meter 96
Figure 5.7: General experimental procedure flow chart 97
Figure 5.8: Comparison o f typical measured data between Maghrabi [2000] and
Chilengwe & Sharpies [2001[ 98
Figure 5.9: Fixed height-varying depth ordinary slots 100
Figure 5.10: Fixed depth-varying height ordinary slots 100
Figure 5.11: Pinewood louver bank 101
Figure 5.12: Illustration o f commercial louver bank 102
Figure 5.13: Square grid round-wire meshes 102
Figure 5.14: Insect screen mesh 103
Figure 5.15: Bird guard mesh 103
Figure 5.16: Q/Qn as a function o f AP for slot type A without mesh 107
Figure 5.17: Q/Qi2 as a function o f AP for slot type A with fine mesh 107
Figure 5.18: Q/Qn as a function o f AP for slot type B without mesh 107
Figure 5.19: Q/Qn as a function o f AP for slot type B with fine mesh 107
Figure 5.20: Q/Q12as a function o f H/D for slot type A without mesh 108
Figure 5.21: Q /Q n as a function ofH/D for slot type A with fine mesh 108
Figure 5.22: Q/Qn as a function o f D/Hfor slot type B without mesh 108
Figure 5.23: Q/Q12 as a function o f D/Hfor slot type B with fine mesh 108
Figure 5.24: Non-dimensional relationship between relative heights (H/H6) and
relative flows (Q/Qc) 114
Figure 5.25: Airflow characteristics o f unmeshed louvers - horizontal louver (QOL)
and 60 0 louver (Q60L) 115
Figure 5.26: Airflow characteristics o f meshed louvers - horizontal louver with mesh
(QOL+M); 60 0louver with mesh (Q60L+M) and mesh only (QM) 115
Figure 5.2 7: Spacer between louver and mesh 121
Figure 5.28: Relative overall improvement as a function o f AP 123
Figure 5.29: Illustration o f directional airflow 124
Figure 5.30: Qo/Qi as a function o f AP for louver X 126
Figure 5.31: Qo/Qi as a function o f AP for louver Y 126
Figure 5.32: Qo/Qi as a function o f AP for louver Z 126
Figure 5.33: Low pressure airflow characteristic 128
Figure 5.34: High pressure airflow characteristic 128
Figure 5.35: Overall pressure range airflow characteristic 128
Figure 5.37: Ratio o f QL and Qh with respect to Q0 for 50% FA mesh 129
Figure 5.38: Ratio o f QL and QH with respect to Qo for 70% FA mesh 129
Figure 5.39: Ratio o f QL and QH with respect to Qo for 100% FA mesh 129
Figure 5.40: Ratio o f QL and QHwith respect to Q0 for AP = 0.05Pa 130
Figure 5.41: Ratio o f QL and Qh with respect to Qo for AP = 1.5Pa 130
Figure 5.42: Ratio o f QL and Qh with respect to Qo for AP = lOPa 130
Figure 5.43: Bird guard mesh arrangement 133
Figure 5.44: Bird guard mesh rotated 90° 133
Figure 5.45: Typical results from aluminium louver surface roughness measurement 135
Chapter 6
Figure 6.1: CFD procedure flow chart 142
Figure 6.2: Examples o f grids used in CFD calculations 144
Figure 6.3: Mesh enrichment 145
Figure 6.4: Mesh adaptation 145
Figure 6.5: Example velocity vectors from CFD simulation 148
Figure 6.6: Example velocity contour from CFD simulation 148
Figure 6.7: Specification o f flow between parallel plates 158
Figure 6.8: Part FLOVENT results showing fully-developed parabolic velocity profile 161
Figure 6.9: Computational domain for variable depth slots 164
Figure 6.10: Computational (X-Z plane) fine gridfor slots o f varying depth 165
Figure 6.11: Typical fully converged solution history for slots of varying depth 166
Figure 6.12: Typical oscillating solution convergence history for slots of varying depth 167
Figure 6.13: Effect of grid density on predicted AP at low, medium and high flow rates 168 Figure 6.14: X-Velocity contours for slot Bl at 1.5 m/s 169 Figure 6.15: Velocity vectors for slot Bl at 1.5m/s 170
Figure 6.16: X-Velocity contours for slot Bl at 3m/s 170
Figure 6.17: Velocity vectors for slot Bl at 3m/s 170
Figure 6.18: X-Velocity contours for slot B2 at 1.5m/s 171
Figure 6.19: Velocity vectors for slot B2 at 1.5m/s 171
Figure 6.20: X-Velocity contours for B2 at 3m/s 171
Figure 6.21: Velocity vectors for slot B2 at 3m/s 172
Figure 6.22: X- Velocity contours for B4 at 1.5m/s 172
Figure 6.23: Velocity vectors for slot B4 at 1.5m/s 172
Figure 6.24: X- Velocity contours for slot B4 at 3 m/s 173
Figure 6.29: Typical fully converged solution residual history for slots of varying heights 181
Figure 6.30: Speed contour for Slot A1 with mesh-screen at AP = 5Pa 182
Figure 6.31: Speed contour for SlotAl without mesh-screen at AP = 5Pa 182
Figure 6.32: Velocity vectors for SlotAl with mesh-screen at AP = 5Pa 182
Figure 6.33: Velocity vectors for SlotAl without mesh-screen at AP = 5Pa 182
Figure 6.34: X-Velocity contour for SlotAl with mesh-screen at AP = 5Pa 182
Figure 6.35: X-Velocity contour for SlotAl without mesh-screen at AP = 5Pa 182
Figure 6.36: Speed contour forSlotA2 with mesh-screen at AP = 5Pa 183
Figure 6.37: Speed contour forSlotA2 without mesh-screen at AP = 5Pa 183
Figure 6.38: Velocity vectors forSlotA2 with mesh-screen at AP = 5Pa 183
Figure 6.39: Velocity vectors forSlotA2 without mesh-screen at AP = 5Pa 183
Figure 6.40: X-Velocity contourforSlotA2 with mesh-screen at AP = 5Pa 183
Figure 6.41: X-Velocity contourforSlotA2 without mesh-screen at AP = 5Pa 183
Figure 6.42: Speed contour forSlotA6 with mesh-screen at AP = 5Pa 184
Figure 6.43: Speed contourforSlotA6 without mesh-screen at AP = 5Pa 184
Figure 6.44: Velocity vectors forSlotA6 with mesh-screen at AP = 5Pa 184
Figure 6.45: Velocity vectors forSlotA6 without mesh-screen at AP = 5Pa 184
Figure 6.46: X-Velocity contourforSlotA6 with mesh-screen at AP = 5Pa 184
Figure 6.47: X-Velocity contourforSlotA6 without mesh-screen at AP = 5Pa 184
Figure 6.48: Speed contour forSlotA6 with mesh-screen at AP = IP a 185
Figure 6.49: Speed contour forSlotA6 without mesh-screen at AP = IP a 185
Figure 6.50: Velocity vectors forSlotA6 with mesh-screen at AP = IPa 185
Figure 6.51: Velocity vectors forSlotA6 without mesh-screen at AP = IPa 185
Figure 6.52: X-Velocity contourforSlotA6 with mesh-screen at AP = IPa 186
Figure 6.53: X-Velocity contourforSlotA6 without mesh-screen at AP = IPa 186
Figure 6.54: Speed contour forSlotA6 with mesh-screen at AP = lOPa 186
Figure 6.55: Speed contour forSlotA6 without mesh-screen at AP = lOPa 186
Figure 6.56: Velocity vectors for SlotA6 with mesh-screen at AP = lOPa 186
Figure 6.58: X-Velocity contour for SlotA6 with mesh-screen at AP = lOPa
Figure 6.59: X-Velocity contourforSlotA6 without mesh-screen at AP = lOPa
Figure 6.60: Variation o f relative AP/AP12 with slot height-to-depth (H/D) ratio
187
187
188
Figure 6.61: Variation o f relative AP/AP12m with slot height-to-depth (H/D)
ratio fo r slots used in combination with a mesh-screen 189
Figure 6.62: Computational domain and base grid system for commercial louvers 191
Figure 6.63: Typical CAD model o f commercial ventilator 192
Figure 6.64: FLO/MCAD - louvre imported into FLOVENT 193
Figure 6.65: Predicted APs at 0.05m/s louver face velocity 197
Figure 6.66: Predicted APs at 0.25m/s louver face velocity 197
Figure 6.67: Predicted APs at 0.5m/s louver face velocity 198
Chapter 7
Figure 7.1: Comparison o f CFD predicted and experimentally measured airflow rates
for slot B4 without a mesh-screen (power law) 206
Figure 7.2: Comparison o f CFD predicted and experimentally measured APs for slot B4
without a mesh-screen (quadratic) 206
Figure 7.3: Comparison o f CFD predicted and experimentally measured airflow rates
for slot B6 without a mesh-screen (power law) 206
Figure 7.4: Comparison o f CFD predicted and experimentally measured APs for slot B4
without a mesh-screen (quadratic) 206
Figure 7.5: Power Law variation o f relative error for Slots B l to B6 without mesh-screen 206 Figure 7.6: Quadratic variation o f relative error for Slots B l to B6 without mesh-screen 206 Figure 7.7: Linear regression fit between CFD predicted and experimentally measured
airflow rates for Type B slots 208
Figure 7.8: Linear regression fit between CFD predicted and experimentally measured
APs for Type B slots 209
Figure 7.9: Comparison o f CFD predicted and experimentally measured airflow rates fo r
slot A 1 without a mesh-screen (power law) 210
Figure 7.10: Comparison o f CFD predicted and experimentally measured APs for slot A 1
with a mesh-screen (quadratic) 210
Figure 7.11: Comparison o f CFD predicted and experimentally measured airflow rates
Figure 7.13: Comparison o f CFD predicted and experimentally measured AP fo r slot A4
without a m esh-screen (quadratic) 211
Figure 7.14 Comparison o f CFD predicted and experimentally measured airflow rates for
slot A5 without a mesh-screen (quadratic) 211
Figure 7.15: Comparison o f CFD predicted and experimentally measured airflow rates for
slo tA l with a mesh-screen (power law) 211
Figure 7.16: Comparison o f CFD predicted and experimentally measured airflow rates fo r
slot A2 with a mesh-screen (power law) 211
Figure 7.17: Comparison o f CFD predicted and experimentally measured APs for slot A2
with a mesh-screen (quadratic) 211
Figure 7.18: Comparison o f CFD predicted and experimentally measured APs for slot B6
without a mesh-screen (quadratic) 211
Figure 7.19: Power Law - Comparison between CFD predicted and measured APs for
slots o f varying height without a mesh-screen 212
Figure 7.20: Power Law - Comparison between CFD predicted and measured APs for
slots o f varying height with a mesh-screen 212
Figure 7.21: Quadratic - Comparison between CFD predicted and measured airflow
rates for slots o f varying height without a mesh-screen 212
Figure 7.22: Quadratic Comparison between CFD predicted and measured airflow rates
for slots o f varying height with a mesh-screen 212
Figure 7.23: Linear regression fit between CFD predicted and experimentally measured
airflow rates for Slots type A 213
Figure 7.24: Linear regression fit between CFD predicted and experimentally measured
airflow rates for Slots type A with mesh-screen 214
Figure 7.25: Linear regression fit between CFD predicted and experimentally measured
APs for Slots type A 215
Figure 7.26: Linear regression fit between CFD predicted and experimentally measured
APs for Slots type A with mesh-screen 216
Figure 7.27: Ratio o f measured to calculated pressure differentials as a function o f louvre
face velocity 217
Figure 7.28: Theoretical, experimental and CFD predicted airflow characteristics for slo tA l 222 Figure 7.29: Theoretical, experimental and CFD predicted airflow characteristics for slot A3 222 Figure 7.30: Theoretical, experimental and CFD predicted airflow characteristics for slot A6 223 Figure 7.31: Theoretical, experimental and CFD predicted airflow characteristics for slot B l 224 Figure 7.32: Theoretical, experimental and CFD predicted airflow characteristics for slot B3 224 Figure 7.33: Theoretical, experimental and CFD predicted airflow characteristics for slot B6 225
Figure 7.34: Pinewood louver bank 231
Figure 7.35: Square gridround-wire meshes 231
Figure 7.36: Spacer between louver and mesh 232
Figure 7.37: Variation o f airflow rates predictedfrom Equation 7.6 with expected airflow rates 235 Figure 7.38: Variation o f airflow rate as a ratio o f the airflow rate through the ventilator
Figure 7.39: Variation o f airflow rate ratio with pressure differential based on Equation 7.6 238 Figure 7.40: Variation o f airflow rates predictedfrom Equation 7.9 with expected airflow
rates for mesh-screens 239
Figure 7.41: Variation o f airflow rates predictedfrom Equation 7.12 with expected
airflow rates for mesh-screens 242
Figure 7.42: Variation o f airflow rate ratio with mesh-screen free-area for horizontal
louver blades 245
Figure 7.43: Variation o f experimental airflow rate ratio with AP for different
mesh free-areas for horizontal louver blades 246
Figure 7.44: Variation ofpredicted airflow rate ratio with AP for different mesh
free-areas for horizontal louver blades 246
Figure 7.45: Variation o f airflow rates predictedfrom Equation 7.15 with expected
airflow rates for mesh-screens 248
Figure 7.46: Variation o f airflow rate ratio (Q6(/Qo) with AP for inclined louver
blades with various mesh-screens 249
Figure 7.47: Variation o f airflow rate ratio (Q/Qo) with AP for 35% free-area
mesh-screen for various louver blade angles 250
Figure 7.48: Variation o f airflow rates predictedfrom Equation 7.18 with expected
airflow rates 251
Figure 7.49: Variation o f airflow ratio (Q/Qioo) with AP for horizontal louver blades
with various mesh-screens for L = 3 mm 252
Figure 7.50: Variation o f airflow rate ratio (Q/Ql=o) with AP for L = 3 mm 254 Figure 7.51: Variation o f airflow rate ratio (Q/Ql=o) with AP for L = 6 mm 254
Figure 7.52: Variation o f airflow rate ratio (Q/Ql=o) with AP for L = 9 mm 254
Figure 7.53: Variation o f airflow rate ratio (Q/Ql=o) with AP fo r L = 12 mm 254
Figure 7.54: Variation o f airflow rate ratio (Q/Ql=o) with gap size between louver blades
and mesh-screen for various APs 255
Figure 7.55: Variation o f airflow rate ratio predictedfrom Equation 7.21 with expected
airflow rate ratio 257
Figure 7.56: Variation o f airflow rate ratio (Q/Ql=o) with AP for ventilator with 0.35
free-area mesh-screen and horizontal louver blades 259
Figure 7.57: Variation o f airflow rate ratio (Q/Ql=o) with AP for ventilator with 0.35
free-area mesh-screen and louver blades inclined at 60° 259
Figure 7.58: Variation o f airflow rate ratio (Q/Ql=o) with louver blade angle for AP = 1 Pa 260 Figure 7.59: Variation o f airflow rate ratio (Q/Qi=o) with louver blade angle fo r AP = 5 Pa 260 Figure 7.60: Variation o f airflow rate ratio (Q/Qi=o) with louver blade angle for AP = 10 Pa 261 Figure 7.61: Variation o f airflow rate ratio (Q/Qo=o) with AP for 0 - 3 0 ° and 60°, f , = 0.35
and L = 3 mm 262
Figure 7.62: Variation of airflow rate ratio (Q/Qo=o) with AP for 6 = 30° and 60°, f a = 0.35
and L = 9 mm 263
Figure 7.65: Variation o f airflow rate ratio (Q/Qfa = i) with AP for f a = 0.35 and L = 9 mm Figure 7.66: Variation o f airflow rate ratio (Q/Qfa = i) with AP for f a = 0.35 and L = 15 mm Figure 7.67: Variation o f airflow rate ratio (Q/Qfa = i) with AP for f a = 0.70 and L = 3 mm Figure 7.68: Variation o f airflow rate ratio (Q/Qfa = i) with AP for f a = 0.70 and L = 9 mm
Figure 7.69: Variation o f airflow rate ratio (Q/Qp, = j) with AP for f a = 0.70 and L = 15 mm Figure 7.70: Quadratic formulation comparison between data from Maghrabi [2000]
and that predicted from Equation 7.6 for a louver system with horizontal Figure 7.71: Quadratic formulation comparison between data from Maghrabi [2000] and
that predicted from Equation 7.6 for a louver system with 30° inclined louver blades
Nomenclature
Symbol Description
A constant
Ae effective area of an opening
a l effective leakage area
Am geometrically measured area
As surface area
B constant
Bo permeability coefficient
b width of rectangular strip orifice
C constant
Cp pressure coefficient
c gas concentration at any instant inside room
Co gas concentration at time t = 0
Cpair specific heat capacity of air
Q maximum allowable indoor concentration of contaminant
Co concentration of contaminant in outdoor air
Cd discharge coefficient
cv coefficient of velocity
Cz discharge coefficient
d gap thickness
dh hydraulic diameter
F normal force
Fi inertia force
Fs shear force
G generation rate of contaminant in occupied zone
g gravitational constant (= 9.81)
h height of observation point
Fn p l height of neutral pressure level
I infiltration rate
K flow coefficient dependent on geometry of opening
k pressure loss coefficient
L length in direction of flow
i characteristic length
M momentum of fluid particle
m mass of particle
mr mass flow rate
N air change rate
n index
P unkown static pressure at reference height
Pa ambient pressure
Po static pressure at reference plane
Ps static pressure
Pt total pressure
Pv velocity pressure
Pw wind pressure
Q volume flow rate
Qact actual airflow rate
Qcomp airflow rate through component Qheat heat flow
Ql volume flow rate from low pressure characteristic
Qleak air leakage
Qh volume flow rate from high pressure characteristic
Qmeas measured volume flow rate
Qstp volume flow rate corrected to standard temperature and pressure
Qt total volume flow rate
qv volume flow rate across area A
R regression correlation coefficient
Rconst universal gas constant (=287)
Re Reynolds number
S surface area of walls and roof
T temperature at height h
Ta ambient temperature
T i indoor temperature
To outdoor temperature
T ref temperature at reference height
t time in seconds
U0 wind velocity in unrestricted airflow
V ventilation rate
V cont control volume
V r predicted volume flow rate
V50 leakage airflow rate at 50 Pa
vol volume of occupied zone
V velocity at a given point in the flow field
v' average velocity
w width of opening
X horizontal distance along flow path
y distance normal to the flow
z distance through crack
a power law coefficient
P power law index
£ rate of dissipation
A change in given quantity
A P pressure difference between two observation points
A P0 unknown pressure difference at reference height
A p i pressure difference due to stack effect A P r reference pressure difference
APt total pressure difference across an opening
P fluid density
P air air density
fl dynamic viscosity
0 angle of inclination
cp predicted quantity
V kinematic viscosity
T shear stress
Subscripts
0 reference point
i observation point 1
2 observation point 2
i internal
e external
L louver
M mesh
V ventilator
Abbreviations
AIVC Air Infiltration and Ventilation Centre
AHU Air Handling Unit
AM Applications Manual
ASHRAE American Society of Heating Ventilation and Air Conditioning Engineers
ASTM American Society for Testing and Materials
BMS Building Management System
BRE Building Research Establishment
BS British Standard
CEN Central European Nations
CFD Computational Fluid Dynamics
CIBSE Chartered Institution of Building Services Engineers
C02 Carbon Dioxide
FA Free Area
HVAC Heating Ventilation and Air Conditioning
MDF Medium Density Fibreboard
NPL Neutral Pressure Level
ROI Relative Overall Improvement
Real ventilation is so uncommon that ....the
layman usually thinks the object has been
attained if some of the windows can be
opened.
Chapter 1
INTRODUCTION
T
his chapter introduces the background to the investigation reported and highlightsthe motivation behind this work, including the definition of the application domain through to aims, objectives and outline of the research methodology employed. Some key aspects of the indoor environment and its implications are also briefly explained. The chapter closes with an outline of the chapters forming the rest of this thesis.
1.1 Background
Over the last twenty to thirty years there has been a shift in emphasis in relation to priorities concerning energy and indoor climate in buildings. For instance, in the 1970s the energy crisis led to energy conservation for heating being the key issue of concern in most climates whilst in the 1990s much attention was paid to global energy use, air leakage through building envelopes, comfort and indoor air quality within buildings. Although heat depletion through the building envelope has been greatly reduced, the loss of background ventilation due to infiltration, along with bad HVAC system maintenance and increased pollution, has led to poor indoor air quality and subsequently to building related illnesses.
1.2 Energy and Environmental Impact of Buildings
In developed countries, such as the U.K., buildings consume approximately 50% of all
primary energy production [Parrot, 1998, DEFRA, 2003] whilst in the U.S. buildings
account for more than 36% of primary energy usage - representing about 62% of total
U.S. electricity consumption [Rosenberg, 2002, WBDG, 2004]. This energy is used
for the heating, cooling, lighting, ventilating and other essential activities of building occupants. Since virtually all of this energy is produced from the burning of fossil fuels then buildings also contribute around 50% and 36%, for U.K. and U.S. respectively, of
the total carbon dioxide (CO2) emissions into the atmosphere. In addition, the use of
-conditioning not only increases building operation costs, but leads to the discharge of refrigerants into the atmosphere. The effluent from fossil fuels and air-conditioning processes may be detrimental on the environment through the effects of global warming and ozone depletion. Therefore, an important strategy in reducing these effects must be to make buildings more energy efficient.
1.3 Indoor Environment: Occupants’ Comfort and Health
Given that on average people spend about 90% of their time indoors [Liddament, 1996]
healthy and comfortable indoor environments are essential in sustaining the quality of life. Indoor environmental quality depends on many interrelating factors, not least the
physical parameters that define thermal comfort (temperature, relative humidity, air
movement), indoor air quality ("freshness” as defined by carbon dioxide level and
"cleanliness" as defined by absence o f harmful substances i.e. air pollution), lighting
quality (mainly day-lighting provisions), and acoustics (noise and vibration aspects).
The impact of poor air quality on comfort, health and occupant attitudes often results in occupant dissatisfaction and loss of productivity and revenue. To avoid this negative impact it is essential that buildings be designed and operated to meet basic human requirements for a healthy and comfortable indoor environment while at the same time ensuring low energy consumption. Essentially, ventilation is required to provide a
thermally comfortable environment and to dilute pollutants (allergens, carbon
monoxide, carbon dioxide, tobacco smoke, moisture, volatile organic compounds,
odours etc) to levels unlikely to pose a health risk [Ata, 1997], and to combat
condensation. As such, it is vitally important to have an effective ventilation system to help meet occupants' increasing expectations for satisfactory air quality in the indoor environment.
1.4 Sustainable Approach to Building Design
One approach to making buildings more energy efficient is to smartly design and operate them in a way that reduces total energy usage, such as the consumption associated with mechanical ventilation and air-conditioning. This involves either supplementing or replacing these energy-intensive services with more sustainable and
Although the concept of natural ventilation is a familiar one, the successful design of a modem naturally ventilated large building or its incorporation into existing buildings is
a complex and comparatively untried process. This process often requires a
combination of high tech and low tech solutions and has been found to be most effective if addressed in initial design phases. Any concerns about the external environment must be balanced against the need for an indoor environment that is sustainable.
Several major building projects have been completed in the last ten to fifteen years that would have, traditionally, been designed to be mechanically serviced. Instead, the supply of fresh air was designed to be provided predominantly by natural ventilation systems. Examples of such projects include the Wessex Water Headquarters
[Alexander, 2000] and the Contact Theatre in Manchester [Palmer, 1999]. Also, studies
suggest that naturally ventilated buildings have health benefits for building occupants [Vincent et al. 1997].
1.5 Application Domain
At the heart of natural ventilation systems are the facade openings that allow fresh air to flow in and stale air to flow out of a building. These openings can take the form of simple holes or slots, openable windows, trickle ventilators and through-wall ventilators. The design and performance of these openings are critical factors in determining the success of a natural ventilation system because the natural forces that drive fresh air into buildings (the wind and/or thermal buoyancy) are very weak. The pressure difference across an opening will typically be less than 10 Pascal for a naturally ventilated building whereas for a mechanically ventilated building the pressure difference will usually exceed 100 Pascal.
In urban areas natural ventilation openings in buildings (open windows, trickle
ventilators and through-the-wall ventilators) can lead to several environmental
problems, such as noise and poor indoor air quality for building occupants. Such problems can create major obstacles to the widespread implementation of natural ventilation in new and refurbished urban buildings. For example, the design requirements for the airflow performance and acoustic performance of a ventilator are not complimentary. For airflow the requirement is for a large open area with smooth
-uninterrupted flow path. For acoustics the requirement is for a small open area with an attenuating multi-bend flow path. There obviously has to be a design compromise if a ventilator is to have both good airflow and good acoustic properties. From an aerodynamic perspective a ventilator can be a combination of relatively large openings (such as louvers) with flow properties independent of the flow rate (Reynolds number independent), and very small openings (such as insect screens) that may have some
Reynolds number dependence as indicated in Baker et al. (1986).
A literature review of ventilator research, including a search of the AIVC database, indicated that previous work in this area tended to investigate either overall ventilator
performance, for example Gonzalez, 1984, Yakubu and Sharpies, 1991, Ayad 1999,
Heiselberg et al. 2001, Karava et al. 2003, or individual elements such as louvres,
screens and meshes in isolation, for example White et al. 1998, Maghrabi and Sharpies,
1999, Miguel et al 2001. These observations are also true for the recently completed
EU-funded natural ventilation research project NatVent® [NatVent, 1999]. Such studies
have often assessed geometrical dimensions, fluid properties and pressure coefficients in order to determine their impact on the airflow characteristics of the ventilator components in relation to gaining fundamental understanding of the airflow characteristics.
A recent study by the UK's Building Research Establishment (BRE) [White et a l 1999]
of twenty-one commercial trickle and wall ventilators revealed that the airflow performance of these devices could be more complex than might be envisaged from their relatively simple constructions. Some ventilators performed better than would be
predicted from their free area, and others performed worse (free area is the physical size
of the smallest aperture in the ventilator). The BRE study concluded that these discrepancies might arise from a poor understanding of the interactions between, among other things, internal flow paths, insect screens, filter materials, baffles and louvre blade shape/geometry. However, the BRE study was not required to investigate in a parametric manner the nature of these interactions.
to gain better understanding of the interactions between the components constituting a ventilator system. The other part resulted from the fact that recent years have seen increasing application of Computational Fluid Dynamics (CFD) as a tool for understanding and predicting the performance of thermal-fluids systems thus offering a competitive and more flexible alternative to full-scale physical modelling. However, at present there is a lack of validated CFD data relating to airflow performance of ventilators for natural ventilation of buildings. On this basis this study set out to test if CFD could be used as a reliable design, analysis and optimisation tool for ventilators.
1.6 Aims and Objectives
The need to understand the interactions between the components in a ventilator and the subsequent impact on airflow performance cannot be over-emphasised. This understanding would enable manufacturers to design ventilators that have as high an airflow performance as possible. For example, a manufacturer of a particular ventilator might be interested to know the relative contributions to flow resistance of louvre blade shape, size and spacing compared to, say, different insect screen mesh sizes or acoustic linings. The parametric experimental studies carried out in this study allowed some of these questions to be answered and design guidance given for individual components.
Discussions with several ventilators manufacturers revealed that optimising the design of a particular ventilator tended to proceed via a series of 'trial and error' experiments with physical prototypes. It is useful for manufacturers to have computer-based tools that enabled them to analyse how changes in the design of individual components affected the overall airflow properties of a ventilator. The suitability of CFD as a potential design tool for this purpose was investigated in the study. Although it was recognised that there are other important ventilator performance issues, such as weather tightness, day-lighting admittance and noise ingress, this investigation concentrated solely on airflow.
The specific objectives were as follows:
• To investigate experimentally how individual components in ventilators affect airflow performance
• To develop flow equations to describe the airflow through ventilators
• To compare experimental data with CFD predicted values and develop CFD as a potential design/analysis tool for ventilators
• To develop a methodology to design ventilators with the aim of optimising the overall airflow performance
1.7 Methodology
Investigations on aerodynamic characteristics of a building component essentially involve the task of determining a relationship between the pressure differential and the
airflow through the component. Traditionally, experimental methods are utilized to
collect fundamental data which are then subjected to analytical methods in order to derive mathematical models that describe the airflow characteristics. Recent years have
seen the rapid development of concepts of tailoring numerical methods such as
Computational Fluid Dynamics (CFD) to provide fast and accurate predictions of complex airflow problems for ventilation designers and researchers. At present there is a lack of information about possible techniques that could be used in an attempt to
optimise the airflow performance of ventilators in relation to a set of identified
parameters (such as the louvre blade angle or spacing between the louvre and mesh- screen). These methods are applied, developed where necessary, and discussed in detail elsewhere in this thesis.
1.8 Thesis Outline
The intention of this chapter was to set the scene by highlighting the motivation for the investigation, laying down some pointers to the present state of knowledge and outlining the general scope of subject under investigation.
theory relating to natural ventilation in buildings and strategies used to implement
natural ventilation (Chapter 2). Chapter 3 focuses on the basic principles of fluid flow
in general. Following on from Chapter 3, the fundamentals of airflow through
ventilation openings are outlined in Chapter 4, which includes a literature review relating to ventilator openings in general and airflow performance in particular. This chapter also provides an initial look at ventilator airflow performance optimisation.
Details of the test facility, main equipment and set-up used to carry out numerous
parametric experiments are given in Chapter 5 together with an account of the
components investigated. The bulk of topics considered in this chapter have also been presented at international conferences and published in a number of prestigious refereed journals either individually or in combination with other material included in this thesis. Computational Fluid Dynamics modelling and simulations including a theoretical
background to its application to airflow in buildings are detailed in Chapter 6.
Chapter 7 analyses and discusses the experimental results and incorporates detailed
comparisons with predictions from CFD and results from other researchers. The strategy employed in attempting to optimise the airflow performance of ventilators for natural ventilation in buildings is presented in detail. Results from this optimisation exercise are included in this chapter together with problems encountered and limitations of the optimisation method used.
The thesis closes (Chapter 8) with an overview of the main findings of the investigation
Chapter 2
NATURAL VENTILATION IN BUILDINGS
I
n this chapter various key concepts relating to the design and application of naturalventilation in buildings are introduced. Advantages of natural ventilation over other methods of ventilating buildings are highlighted together with the various strategies utilised in employing natural ventilation. A general overview of natural ventilation openings is also introduced here.
2.1 Background
2.1.1 Why ventilate buildings?
The need for ventilation today is still the same as it has been over many centuries, namely to ensure acceptable indoor air quality (and thermal conditions) within a room or building and to provide a supply of combustion air for fuel-fired heating appliances. Adequate ventilation is essential to replenish oxygen used by occupants, to remove pollutants generated by breathing, for combustion and other household activities, to maintain low odour levels, to discharge heat, to control condensation and to remove emissions from building materials.
2.1.2 What is ventilation?
Nowadays, ventilation is considered as the process of providing fresh air or removing stale air at acceptable rates to/from the occupants of a building, rather than the buildings themselves, in order to sustain a good standard of air quality and thermal comfort with
minimum capital cost and environmental impact [Awbi, 1998].
Ventilation may involve one or both of two
processes:-• Where a source of contamination can be readily isolated, air can be exhausted from its immediate vicinity in such a way that contaminants are captured and directed into the exhaust system before they can diffuse into the occupied space. This approach is widely used in industrial applications.
• Where an entire room is a source of contamination, an exhaust system may be used to isolate it from the rest of the building. In removing contaminants in this way, provision must be made for an adequate supply of replacement air.
In most situations the sources of contaminants, usually the occupants themselves and their activities are not readily isolated. The ventilation process then employed is that of dilution. Outdoor air is thoroughly mixed with the air in the occupied space and displaces an equal volume of room air.
2.1.3 How are buildings ventilated?
MECHANICAL VENTILATION
Mechanical ventilation involves the supply of outdoor air to, or removal of room air from, a building using electrically powered fans. There are three basic types of
mechanical ventilation systems (Figure 2.1). A supply-only system relies on a supply fan
to bring outdoor air into a building, raising the air pressure inside the building thus causing an outward flow of air through cracks and openings in the building envelope.
An extract-only or exhaust-only system works in the opposite way. It employs an extract
fan to discharge indoor air to outdoors, thereby lowering the air pressure inside the building so that outdoor air is drawn in through cracks and openings in the building
envelope. A balanced system simultaneously supplies outdoor air to a building and
extracts an approximately equal amount of indoor air.
BBRM
Supply-only system Exaust-only system Balanced system
Figure 2.1: Three basic types o f mechanical ventilation systems [Source: Reardon et al. 1990]
Mechanical ventilation systems usually have provision to treat (heat, cool, filter, humidify or dehumidify) the air supplied to the building. Ventilation systems incorporating facilities for air treatment is what is referred to as air-conditioning. One of the advantages of mechanical ventilation and air conditioning systems is that they are capable of providing controlled air flow rates and thermal conditions to a space. In addition they normally have provisions for energy recovery from the exhaust air stream. However, they are generally viewed as energy-intensive systems which have a direct burden on the environment since the use of non-renewable energy is often associated with production of environmentally harmful substances.
NATURAL VENTILATION
combination of both) is used to drive the air through the ventilated space (Figure 2.2)
[SPG Media, 2004].
h o t a m n c v i IKIWUOM uouve*»
CROSS VENTILATION
CROSS VENTILATION
Figure 2.2: Ventilation due to wind and thermal buoyancy
Wind-induced pressures are dependent on the geometry of the building, orientation of the building with respect to the prevailing wind direction, wind speed and the nature of terrain surrounding the building. The pressures due to thermal forces arise from the differences in air density between indoor and outdoor - commonly referred to as the stack effect. When the inside air temperature is greater than the outside air temperature, warm indoor air rises and escapes from the building through high level openings and cooler air is sucked into the building through low level openings by the change in local pressures.
When ventilating a building using natural ventilation, two distinct strategies must be considered - one for the winter and one for the summer. During winter only small air flows are needed (usually 5 - 8 1/s per person) but there is the risk of cold air draughts. During the summer, the main challenge is providing enough air flow to give effective cooling.
HYBRID VENTILATION
Hybrid ventilation systems are two-mode systems that combine the best aspects of natural and mechanical ventilation (Figure 2.3) at different times of the day or season of the year to provide a comfortable indoor environment and good air quality. In hybrid ventilation mechanical and natural forces are combined in such a way that the active
AUHMJOKT
rH
-mode reflects the external environment and takes maximum advantage of ambient conditions at any point in time. Hybrid ventilation systems have intelligent control systems that can switch automatically between natural and mechanical modes in order to minimise energy consumption. Advanced hybrid ventilation technology fulfils the high requirements on indoor environmental performance and the increasing need for energy savings and sustainable development by optimising the balance between indoor air quality, thermal comfort, energy use and environmenta
![Figure 7.71: Quadratic formulation comparison between data from Maghrabi [2000] and](https://thumb-us.123doks.com/thumbv2/123dok_us/768558.582764/22.614.100.422.232.740/figure-quadratic-formulation-comparison-data-maghrabi.webp)