VALIDATION OF A STABILITY-INDICATING REVERSE PHASE
HPLC METHOD FOR DETERMINATION OF CANAGLIFLOZIN API
V. Rahul Krishna, S. Amuthalakshmi* and C. N. Nalini
Department of Pharmaceutical Analysis, C. L. Baid Metha College of Pharmacy,
Thorapakkam, Chennai-600091.
ABSTRACT
A new simple, rapid and sensitive RP-HPLC method has been
developed for the determination of Canagliflozin Active
Pharmaceutical Ingridient (API). The method employs X-bridze C18
column (150mm×4.6 mm, 5mm particle size) column for the
chromatographic separation and orthophosphoric acid (0.1% w/v) :
acetonitrile (60:40, v/v) was used as a mobile phase. Separation was
completed within 10 min with a flow rate of 1 ml/min and detection
was at 230 nm. The retention time of canagliflozin was found to be
8.70 min. The proposed method was found to have the linearity in the
concentration range of range of 25-75 µg/ml. Linear regression
coefficient was not less than 0.999. The values of % RSD are less than
2% indicating accuracy and precision of the method. The percentage recovery varies from
98-102% of Canagliflozin. LOD and LOQ were found to be within limit. The results obtained on
the validation parameters met ICH Guidelines and USP requirements. The method was found
to have suitable application in routine laboratory analysis with high degree of accuracy and
precision.
KEYWORDS: Canagliflozin, RP-HPLC Estimation, Analytical Method Validation, API.
INTRODUCTION
Canagliflozin is an anti diabetic drug used to improve glycemic control in patients with type
II diabetes.[1-5] Chemically it is
(2S,3R,4R,5S,6R)-2-(3-{[5-(4-fluorophenyl)thiophyl]methyl}-4-methylphenyl-6-(hydroxymethyl)oxane-3,4,5-triol (fig. 1).
This drug showed a promising effect in stabilizing the glycemic fluctuations in patients with
type 2 diabetes[6,7] throughout the day and suppresses the diabetic complications. It inhibits
Volume 7, Issue 3, 459-468. Research Article ISSN 2277– 7105
Article Received on 15 Dec. 2017,
Revised on 06 Jan. 2018, Accepted on 27 Jan. 2018
DOI: 10.20959/wjpr20183-9171
*Corresponding Author
Prof. S. Amuthalakshmi
Department of
Pharmaceutical Analysis, C.
L. Baid Metha College of
Pharmacy, Thorapakkam,
SGLT2, reduces reabsorption of filtered glucose and lowers the renal threshold for glucose
[image:2.595.182.409.130.236.2](RTG), and thereby increases urinary glucose excretion.[8-11]
Fig. 1: Structure of Canagliflozin.
In clinical trials, Canagliflozin produced a dose-dependent reduction in HBA1C of 0.6 to 0.9
greater than that obtained with placebo when administered as mono therapy, in combination
with metformin, or in combination with metformin and sulfonylurea.[12]
Various analytical methods including UV Spectroscopy[13] HPLC– MS/MS methods[14], RP-
RP-HPLC,[15-20] are available for the estimation of canagliflozin in pharmaceutical dosage
forms. We tried to develop a simple method for the estimation of canagliflozin API by
RP-HPLC method. The proposed method was optimized and validated as per the International
Conference of Harmonization (ICH) guidelines.[21]
MATERIAL AND METHODS
Analytically pure sample of Canagliflozin API was obtained from Aktteva Biopharma Ltd.,
Ahmedabad, Gujarat. India. Methanol, Acetonitrile (HPLC Grade) was obtained from
MERCK Germany. Analytical reagent grade orthophosphoric acid was purchased from
Rankem, Mumbai,India.
a)Chromatographic conditions
Canagliflozin was analysed in X-bridze C18 column (150mm×4.6 mm, 5mm particle size)
column for the chromatographic separation. The mobile phase was composed of 0.1% w/v
orthophosphoric acid and Acetonitrile (60:40, v/v). Filtered through 0.22 mm membrane filter
under vacuum filtration and degassed. The mobile phase is pumped at ambient temperature,
at a flow rate of 1 ml/min with UV detection wavelength at 230 nm. Injection volume was
a) Preparation of stock solution
Accurately weighed quantity of Canagliflozin (50 mg) was transferred to a 100 ml volumetric
flask, dissolved and diluted up to the mark with diluent and was ultra-sonicated for 5 min (5 0
μg/ml).
b) Preparation of standard working solution
Standard working solution was prepared by taking 5 ml of stock solution into 50 ml
volumetric flask and the final volume was made up with diluent (50 μg/ml). The solution was
filtered and then diluted immediately before use to appropriate concentration levels by using
mobile phase.
RESULTS AND DISCUSSION
i. Method development and optimization of chromatographic conditions
To achieve good peak different buffer pH-conditions and different proportions of solvents
like methanol, acetonitrile and water were tested with binary and tertiary eluents. However,
0.1% OPA in Water: ACN mixed in the ratio of 60:40 % v/v mobile phase at a flow rate of 1
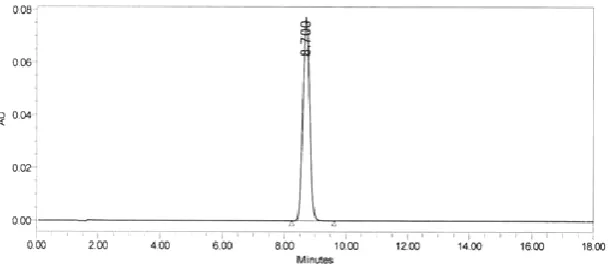
ml/min and detection at 230 nm achieved good satisfactory results. The chromatogram of
optimized standard mixture is shown in fig. 2. The system suitability parametres such as
[image:3.595.146.451.487.619.2]retention time, resolution and theoretical plates for optimized standard mixture are given in
table 1.
Fig. 2: Chromatogram of canagliflozin.
ii. Method validation
The method was validated for system suitability, accuracy, precision, linearity, detection
a) System Suitability
System Performance parameters of developed HPLC method was determined by injecting
standard solutions. Parameters such as number of theoretical plates (N), tailing factor,
resolution(R), retention time (RT) and %RSD for replicate injections were determined (Table
[image:4.595.169.431.211.315.2]1). The results were found to be within the limits.
Table. 1: System Suitability Results.
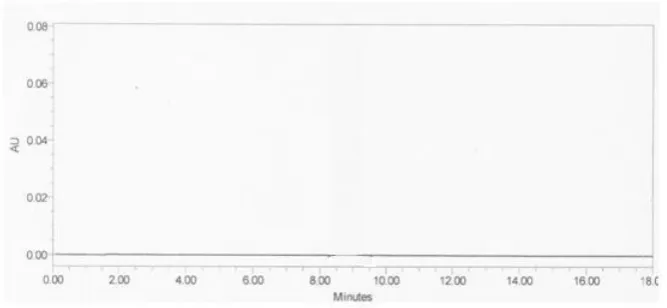
b)Specificity: Specificity is the ability of a method to discriminate between the analyte(s) of
interest and other components that are present in the sample. Studies are designed to evaluate
the degree of interference, if any, which can be attributed to other analyte, impurities,
degradation products, reagent "blanks" and excipients. Blank chromatogram does not show
any disturbance peak at the retention time of canagliflozin (Fig.3) and hence the method is
specific.
Fig. 3: Blank chromatogram.
c) Accuracy: To determine the Accuracy of the proposed method, recovery studies were
conducted; known amount of pure drug concentrations was spiked in placebo at three
different levels, ie, 50%, 100% and 150% and was calculated. Accuracy was calculated as the
Parameter Canagliflozin
Retention Time (min) 8.7
Theoretical plates 7476.23
Tailing Factor 1.06
Resolution 0.15
RSD of peak area 0.12
[image:4.595.131.465.472.626.2]Table. 2: Accuracy data.
Parameter Amount
taken
Amount
recovered % Recovery
Mean
Recovery %RSD
canagliflozin
50% 25 24.90 99.60
99.72 0.92
100% 50 49.88 99.76
150% 75 74.85 99.80
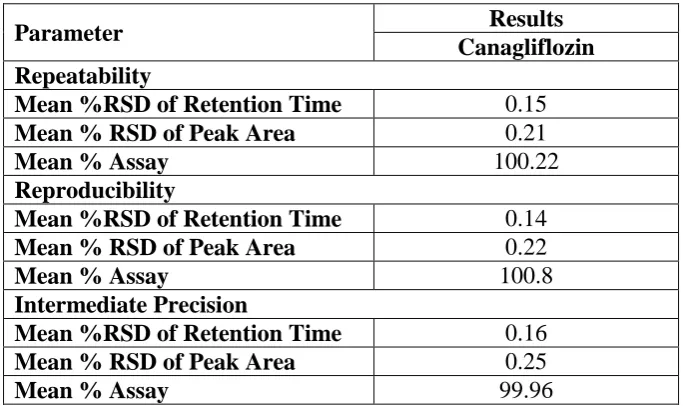
d) Precision: Precision was evaluated at three levels: repeatability, intermediate precision
and reproducibility. Each level of precision was investigated by six replicate injections of
concentrations of 50 µg/ml of canagliflozin. The result of precision was expressed as % RSD,
given in Table 3.
Table. 3: Method precision Results.
Parameter Results
Canagliflozin Repeatability
Mean %RSD of Retention Time 0.15
Mean % RSD of Peak Area 0.21
Mean % Assay 100.22
Reproducibility
Mean %RSD of Retention Time 0.14
Mean % RSD of Peak Area 0.22
Mean % Assay 100.8
Intermediate Precision
Mean %RSD of Retention Time 0.16
Mean % RSD of Peak Area 0.25
Mean % Assay 99.96
e) Linearity
The linearity was evaluated by measuring different concentrations (80% to 130%) of the
standard solutions. The solutions were examined by the assay procedure. The calibration
curve was plotted using response factor (peak area ratio of the standard peak area and internal
standard peak area) Vs concentration of the standard solution. From the calibration curve, the
[image:5.595.127.469.308.511.2]Fig. 4: Linearity curve of Canagliflozin.
Table. 4: Linearity parameters.
Parameter Canagliflozin
Linearity Range(µg/ml) 25 -75
Correltion coeffecient 0.999
Slope 22576
Y-intercept 51194
f) Detection limit (DL) and quantitation limit (QL)
Estimation of DL and QL considered the acceptable signal-to-noise ratios 3:1 and 10:1
respectively. The limit of detection and quantitation determined was 3.58 and 10.85 µg/ml for
canagliflozin.
g) Robustness and Ruggedness
The robustness of an analytical method was unaffected by deliberate change in the Flow rate,
pH, mobile phase composition and column temperature were performed at 100%
concentration.
The ruggedness of the proposed analytical method was performed in different condition like
different columns, analyst, instrument, laboratories analysis of the same sample. The results
are within acceptance criteria.
Analysis of marketed sample
The proposed method was applied for the analysis of canagliflozin API, the results were
[image:6.595.164.431.298.373.2]Table. 5: Assay results.
iii. Forced degradation studies
To evaluate the stability indicating property of the developed HPLC method stress studies
were carried out as per the ICH guidelines. Forced degradation of canagliflozin was carried
out by exposing the bulk sample to acidic, alkaline, oxidative, photolytic, dry heat and neutral
conditions.
a) Stock solution
Accurately weighed and transferred 50 mg of canagliflozin samples into a 100ml clean and
dried volumetric flask added about 70ml of diluent and sonicate to dissolve it completely and
make volume up to the mark with the same solvent. (Stock solution).Further pipette out 5 ml
of above stock sample solution into a 50ml volumetric flask and diluted up to the mark with
diluent. Results of Forced degradation are shown in Table 6.
b) Acidic degradation
To 10 ml of stock solution, 10ml of 1N HCl was added and kept at 80ºC for about 12 hours in
water bath, cooled and the volume was made up to 100ml with mobile phase. The solution
was filtered through 0.22 micron membrane filter.
c) Alkali degradation
To 10 ml of stock solution, 10ml of 0.5N NaOH was added and kept at 80ºC for about 12
hours in water bath, cooled and the volume was made up to 100ml with mobile phase. The
solution was filtered through 0.22 micron membrane filter.
d)Oxidative degradation
To 10 ml of stock solution, 5ml of 3% H2O2 was added and kept at 80ºC for about 12 hours in
water bath, cooled and the volume was made up to 100ml with mobile phase. The solution
was filtered through 0.22 micron membrane filter.
e) Thermal degradation
The 10 ml of stock solution was kept at 70ºC for about 10 days, cooled and the volume was
made up to 100ml with mobile phase. The solution was filtered through 0.22 micron
membrane filter.
Drug Labelled amount Amount found % assay
Table. 6: Degradation studies of canagliflozin.
Condition canagliflozin %Rec
acid 1502998 95.08
base 1396675 89.63
peroxide 1566183 98.65
heat 1534041 95.83
UV 1494948 95.91
CONCLUSION
Based on the results of the above studies, it is concluded that the method for determination of
assay of canagliflozin API is precise, linear over the concentration range, stability indicating,
and rugged. The method is robust with respect to variation in flow rate, column temperature
and buffer composition. The method is specific for the quantization of assay of canagliflozin
API. So the developed method can be easily applied for routine analysis of canagliflozin API.
The method was found to be simple accurate economical and rapid and it can be applied for
routine analysis in laboratories and suitable for the quality control of bulk and pharmaceutical
formulations.
ACKNOWLEDGEMENT
The authors are thankful to Department of pharmaceutical Analysis, C.L.Baid Metha College
of Pharmacy, Thorapakkam, Chennai, and Aktteva Biopharma Ltd., Ahmedabad, Gujarat,
India for providing standards, lab facilities and for the encouragement.
REFERENCES
1. Shelley E. Lesley J. Scott., Canagliflozin: First Global Approval, Drugs, 2013; 73:
979-988.
2. Bode B. Stenlof K. Sullivan D. Fung A. Usiskin K. Efficacy and safety of canagliflozin
treatment in older subjects with type 2 diabetes mellitus: a randomized trial, Hosp. Pract
(1995), 2013; 41(2): 72-84.
3. Edward C. Chao. Canagliflozin, Drugs of the Future, 2011; 36(5): 351–357.
4. Davies M. Achievement of glycemic goals without hypoglycemia with canagliflozin
versus glimepiride in patients with type 2 diabetes mellitus, AACE 2016; Abstract 302.
5. American Diabetes Association, Diabetes Care, Jan 1, 2007; 30(Suppl 1): S4-41.
with metformin (CANTATA-SU): 52 week results from a randomised, double-blind,
phase 3 non-inferiority trial, 2013; 382(9896): 941–950.
7. Nisly S.A,. Kolanczyk D.M., Walton A.M. Canagliflozin, a new sodium-glucose
cotransporter 2 inhibitor in the treatment of diabetes, Am. J .Health Syst. Pharm., 2013;
70(4): 311-319.
8. Bailey C.J. Renal glucose reabsorption inhibitors to treat diabetes, Trends Pharmacol Sci.,
2011; 32(2): 63-71.
9. Harsharan PS, Ishpreet K. Gunjan S. Sodium Glucose Co-Transporters-2 (SGLT2)
Inhibitors as a New Class of Anti-diabetic Drugs: Pharmacokinectics, Efficacy and
Clinical Significance, Int. J. Pharm. Sci. Rev. Res., 2015; 33(1): 40-47.
10. Neumiller JJ, White JR, Campbell RK. Sodium-glucose co-transport inhibitors: progress
and therapeutic potential in type 2 diabetes mellitus, Drugs, 2010; 70(4): 377-385.
11. Muzaffar I. Nasr YK, Amer MA, Khalid A. A simple and sensitive high performance
liquid chromatography assay with a fluorescence detector for determination of
canagliflozin in human plasma, Anal. Methods, 2015; 7(7): 3028-3035.
12. Casagrande SS, Fradkin JE, Saydah SH, Rust KF, Cowie CC, The prevalence of meeting
A1C blood pressure and LDL goals among people with diabetes: 1988–2010, Diabetes
Care, 2013 Feb 15.
13. Ishpreet K. Sharad W. Harsharan PS. Development and Validation of UV Spectroscopic
Method for Determination of Canagliflozin in Bulk and Pharmaceutical Dosage Form,
Pharm Methods, 2015; 6(2): 1-1.
14. Muzaffar I. Essam E. Khalid A Al-R. Yousif AA, Naser LR. Rapid determination of
canagliflozin in rat plasma by HPLC–MS/MS using negative ionization mode to avoid
adduct-ions formation, Talanta, 2015; 132(1): 29-36.
15. Maddu Suma K. Manasa CH, Rajakumari B. Lakshmaiah, RP-HPLC Method
Development and Validation for the Estimation of Canagliflozin in Tablet Dosage Form,
Int. J. Pharm., 2014; 5(4): 1288-1292.
16. Ishpreet Kaur, Sharad Wakode and Harsharan Pal Singh, Development and Validation of
UV Spectroscopic Method for Determination of Canagliflozin in Bulk and
Pharmaceutical Dosage Form, Pharm. Methods, 2015; 6(2): 82-86.
17. Suneetha A. Sharmila D. A Validated Stability Indicating RP-HPLC Method for
Estimation of Canagliflozin in Dosage Form, Research Journal of Pharmaceutical
18. Uttam Prasad Panigrahy, Sunil Kumar Reddy A. A Novel Validated RP-HPLC-DAD
Method for the Simultaneous Estimation of Metformin Hydrochloride and Canagliflozin
in Bulk and Pharmaceutical Tablet Dosage form with Forced Degradation Studies, Orient.
J. Chem, 2015; 31(3): 1489-1507.
19. Skoog DA, Holler FJ, Nieman TA. Principles of Instrumental Analysis. 6th ed. Thomson
Brooks Cole, 2007; 827.
20. Srinivasu K. Rao JV, Raju N. A validated RP-HPLC method for the determination of
atazanavir in pharmaceutical dosage form. E. J. Chem, 2011; 8(1): 453-456.
21. International Conference on Harmonization (ICH), Validation of Analytical Procedures: