DEVELOPMENT AND VALIDATION OF A STABILITY-INDICATING
RP-HPLC METHOD FOR THE DETERMINATION OF
BENDAMUSTINE IN RAW MATERIAL AND FINISHED PRODUCT
Dhananjaya G.*1, M. Naveen2, P. Janaki Pathi3,J. Raghuram4 and
N. Appala Raju4
1,2
Department of Chemistry, Rayalaseema University, Karunool-515003. 3
Analytical Department, Vishnu Chemicals Limited, Jeedimetla, Hyderabad.
4
Department of Pharmaceutical Chemistry, Sultan-Ul-Uloom College of Pharmacy, Mount
Pleasant, Banjara Hills, Hyderabad-500 034.
ABSTRACT
Bendamustine Hydrochloride Injection is indicated for the treatment of
patients with chronic lymphocytic leukemia. Efficacy relative to first
line therapies other than chlorambucil has not been established.
Bendamustine Hydrochloride Injection is indicated for the treatment of
patients with indolent B-cell non-Hodgkin lymphoma that has
progressed during or within six months of treatment with rituximab or
a rituximab-containing regimen. A reversed-phase HPLC method was
developed and validated for the determination of Bendamustine in raw
material and to determine impurities and degradants that may
developed in the tested samples. The separation was achieved on
Thermo Hypersil C18 column (4.6 x 250 mm, 5µm) using mobile
phase consisting of 70% Potassium Phosphate Dibasic Buffer (pH 7) and 30% acetonitrile
(100% ACN). The flow rate was 1.0 mL/min, injection volume 10µL, and detection was
accomplished at 232 nm. The retention time for Bendamustine was 7 minutes. The developed
method was validated and met all the acceptance criteria for validation parameters - system
suitability, specificity, solution stability, robustness, linearity, accuracy, precision, limit of
detection (LOD), and limit of quantitation (LOQ). The LOD was determined to be 0.1 ppm
and LOQ was found to be 0.5 ppm.
KEYWORDS: Bendamustine, Degradation, RP-HPLC, Validation and Finished product.
Volume 7, Issue 18, 1172-1187. Research Article ISSN 2277– 7105
Article Received on 09 September 2018,
Revised on 30 Sept. 2018, Accepted on 21 Oct. 2018,
DOI: 10.20959/wjpr201818-13613
*Corresponding Author
Dhananjaya G.
Depar tmen t of
Ch emistr y,
Ra yalaseema
Un iver sit y, Kar un ool
INTRODUCTION
Bendamustine is an alkylating compound, containing a nitrogen mustard moiety, a
benzimidazole ring and an alkane carboxylic corrosive side chain. While it was at that point
blended in 1963 by Ozegowski also, Krebs,[1-3] and being used for quite a long time in Germany against various malignancies, it was just in 2008 that bendamustine was affirmed
by the United States Food and Drug Administration (US FDA) for the treatment of endless
lymphocytic leukemia (CLL) also, later for slothful B-cell non-Hodgkin's lymphoma (NHL)
that has advanced amid or following treatment with rituximab or a rituximab-containing
regimen. To date, no less than 80 clinical preliminaries with bendamustine are dynamic and
enrolling patients,[4,5] demonstrating that there is a considerable measure of new enthusiasm for this somewhat old medication. To help clinical preliminaries, we created and approved an
LC– MS/MS strategy for the evaluation of bendamustine in plasma and pee.[6-8] As far as anyone is concerned, this article is the first depicting the approval of an examine for this
compound. Aside from unaltered bendamustine, the measure moreover permits measurement
of - hydroxy-bendamustine (M3) and N-desmethylbendamustine (M4), the two known stage I
metabolites of bendamustine, which have cytotoxic action roughly proportionate to and five
to ten times not as much as their parent, individually.[9] Moreover, a different examine is depicted to evaluate the item of two-overlap hydrolysis of bendamustine,
dihydroxy-bendamustine (HP2), in similar examples. Bendamustine may differ from other alkylators in
that it may be more potent in activating p53-dependent stress pathways and inducing
apoptosis; it may induce mitotic catastrophe; and it may activate a base excision DNA repair
pathway rather than an alkyltransferase DNA repair mechanism. Accordingly, this agent may
be more efficacious and less susceptible to drug resistance than other alkylators.
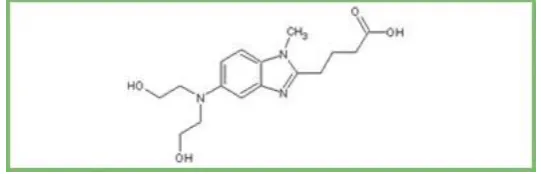
Bendamustine IUPAC name is
[image:2.595.162.433.625.712.2]4-[5-[bis(2-chloroethyl)amino]-1-methylbenzimidazol-2-yl]butanoic acid. Its molecular formula is C16H21Cl2N3O2 and its molecular weight is 358.262.
The primary purpose of this research project was to develop and to validate a simple HPLC
method for determination of Bendamustine in the raw material and finished product. This is
beneficial in any clinical environment where the concentration of Bendamustine is needed to
understand any patient issues along with the Pharmaceutical industry to prepare the multiple
steps that may be needed to prepare the raw material for production. There are very few
analytical methods that have been reported for the determination of Bendamustine in Bulk
and Formulations. Studying the stability of a drug and being able to monitor degradation
products aids in the clinical treatments/early product development and shelf life for the drug.
The present study was aimed at developing simple, specific, accurate and precise HPLC
method for the determination of Bendamustine in commercially available pharmaceutical
formulations, based on direct UV-detection.
Experimental: Chemicals and reagents: Standard drug Bendamustine was obtained as
working standard from Mylan laboratories Hyderabad. HPLC grade acetonitrile, and
hydrochloric acid were procured from Merck Ltd., India. Analytical grade sodium hydroxide,
hydrogen peroxide and other chemicals used in the study were procured from CDH chemicals
Ltd, Mumbai, India.
Instrumentation: Quantitative HPLC was performed on the Waters Alliance 2695
Separations Module is a high performance liquid chromatographic system with a quaternary,
low-pressure mixing pump and inline vacuum degassing. Flow rates from50 uL/min to 5
mL/min can be generated for use with 2.1 mm ID columns and larger. The auto-sampler has a
maximum capacity of 120 vials (12x32, 2-mL) with programmable temperature control from
4 to 40°C. A heated column compartment provides temperatures from 5 degrees above
ambient to 65°C. The detector is a photodiode array (model 2996) with a wavelength range of
190-800 nm and sensitivity settings from 0.0001-2.0000 absorbance units. X-Terra RP-C18
Column (250x4.6 mm i.d; particle size 5 μm) was used. The HPLC system was equipped
with Empower-software solution software.
Preparation of standard solutions: Bendamustine standard solution (4000ppm): Weight
accurately 400 mg of Bendamustine and transfer in to 40 mL volumetric flask. Add solvent
(75% ACN) and shake gently; sonicate the solution till completely dissolved. Make up the
Selection of stationary phase: According to ICH, for a particular compound column must
provide the tailing between 0.9-2.0 and theoretical plates must be above 2000. For the
Bendamustine research workfour different columns were used.
1. Column 1: ThermoHypersil C18 (4.6 x 250 mm, 5μm) Part # 30105254630, Serial #
01535710.
2. Column 2: Supelco Discovery C18 (4.6 x 250 mm, 5μm)Part # 39777702 Serial #
1022040N.
3. Column 3: Thermo Electron C18 (4.6 x 250, 5μm) Lot # 6854, Part # 30105-254630,
Serial # 0541587.
4. Column 4: Supelco C18 (4.6 x 250 mm, 5μm) Col: 28105-254630, CN # 6279.
Samples of 1000ppm bendamustine were injected under mobile phase conditions of 30%
ACN were injected into the HPLC system. Considering ICH criteria of the column, above 4
columns were tested. Out of four columns used for the method, Column 1 has selected for
further studies as the peak symmetry and number of theoretical plates were in accordance
with guidelines. Column 2 gave lower Retention time, and as compared to column 1, it’s
tailing factor also greater. In the case of column 3 peaks appeared broken and other peaks
were present so it was rejected. Similarly, for column 4 lot of impurity peaks appeared and
were deemed unsuitable for use in analysis. So that Column 1 was selected for the method
development and validation of Bendamustine.
Selection of mobile phase: Because the analyte of interest is predominantly polar and of low
molecular weight; several binary mixtures containing potassium phosphate dibasic and
acetonitrile (20-55% v/v) were evaluated with a Hypersil C-18 (250x4.6mm) column with 5
µm particle size. The retention time of bendamustine was decreased with a high
concentration of acetonitrile. Also, the precipitation of potassium phosphate dibasic buffer
was observed at the high concentration of organic solvent in the mobile phase in a
composition which, was indicated by pressure fluctuations resulting in a rough, noisy base
line. Hence acetonitrile strength in mobile phase composition was limited to less than 40%
(v/v) which also resulted in a very low ‘k’value of bendamustine. Further use of buffer,
acetonitrile 70: 30 (v/v) resulted in quality separation of bendamustine in terms of peak
symmetry, adequate resolution, acceptable run time and retention time with agreeable ‘k’
values. Increasing the mobile phase flow rate from 0.8 ml/ min to 1.0 ml/minute decreased
conditions were used: 2.90, 5.0 & 7.0. At pH 5.0 elution was at 2.629 which interferes with
void peaks so, it was not selected for analysis. In case of pH 2.90 Retention time at 1.683 was
very early elution, this condition was not selected. But in case of pH 7.0, an excellent peak at
7.609 with tailing factor 1.166 and theoretical plate count 4400 was obtained. So, pH 7.0 was
selected for further analysis.
Selection of Detection wavelength: The choice of specific wavelength for the analyte of
interest, i.e., Bendamustine was based on the necessity of good sensitivity and a high degree
of selectivity. The aliquot portion of the standard stock solution of bendamustine was diluted
with 50% ACN was examined in the range of 200-400 nm. The representative UV-Spectrum
of bendamustine was shown in Figure-1. The UV-spectrum depicts the maximum absorption
at 232 nm for bendamustine, was selected due to less noise followed by no solvent
interference was observed at maximum absorption peak. It was also observed that there was
no mobile phase interference or baseline disturbances due to buffer or diluting liquids.
Preparation of Linearity dilutions: To select a nominal concentration, serial dilution of
analyte that were prepared from the stock solution was diluted with mobile phase to get a
series of concentration ranging from 250, 500, 750, 1000, 1250 and 1500ppm. The prepared
solutions were filtered through filter paper. From these solutions, 10μl injections of each
concentration were injected into the HPLC system and chromatographed under the optimized
conditions. A calibration curve was constructed by plotting the mean peak area (Y-axis)
against the concentration (X-axis) (Table 1).
Acid stress study: Take a measured quantity of 2.5mL of HCl and mix with 2.5mL of 4000
ppm drug in a dry test tube. After this heat this mixture in 75 0 C for 24 hrs. Then cool down to room temperature. Once the mixture comes down to room temperature, neutralize the
solution by adding 2.5mL of an equivalent concentration of NaOH. Transfer this to a dry
10mL volumetricflask and make up to the mark with 50% ACN as a diluent solvent, further
to dilute this solution to 1000 ppm concentration with diluent. Sonicate the solution followed
by filtration before injecting into HPLC system. To optimize the degradation conditions two
different concentrations of HCl and different times has been followed.
Base Stress studies: Take a measured quantity of 2.5 ml of NaOH and mix with 2.5mL of
solution by adding 2.5mL of corresponding HCl. Transfer this to a dry 10mL volumetric flask
and make up to the mark with 50% ACN as a diluent solvent. further to dilute this solution to
1000 ppm concentration with diluent. Sonicate the solution followed by filtration before
injecting into HPLC system. To optimize the degradation conditions two different
concentrations of NaOH and different times has been followed. The chromatograms and
results are as follows. From the degradation results it is clearly indicated that the drug is not
stable under basic conditions. There are two potential degradant products intensely observed
in almost in all concentrations of NaOH. Different degree of degradation was observed by
different acid concentrations and for different exposure time.
Oxidation Stress studies: Take ameasured quantity of 2.5 ml of corresponding hydrogen
peroxide and mix with 2.5 ml of 4000 ppm drug in a dry test tube. Heat this mixture in 75 0 C for 24 hrs, then cool down to room temperature. Transfer this to a dry 10mL volumetric flask
and make up to the mark with 50% ACN as a diluent solvent. further to dilute this solution to
1000 ppm concentration with diluent. Sonicate the solution followed by filtration before
injecting into HPLC system. To optimize the degradation conditions, two different
concentrations of hydrogen peroxide & different times has been followed.
Heat Stress studies: The stability of bendamustine was studied under thermal stress
conditions. The primary stock solution of bendamustine at 4000 ppm was used for the
thermal degradations study. 2.5mL of Bendamustine was taken in a test tube and subjected to
extreme heat conditions at 75oC for different time intervals. The resulting solution was further diluted with diluents solvent up to the mark in 10 mL volumetric flask and mixed
thoroughly, further to dilute this solution to 1000 ppm concentration with diluent. The
resulting stress sample of bendamustine were injected into HPLC instrument and analyzed
under optimized chromatographic conditions for the stability behavior of bendmustine.
UV sensitivity Study: Stability behavior of bendamustine under light irradiation was studied
by using UV light. The bendamustine raw material was transferred into a petri dish and kept
under UV-irradiation for 24hrs and 72 hrs. 10 mg of irradiated bendamustine raw material
was dissolved in 10mL of 50% ACN in a 10mL volumetric flask, which gives a concentration
of 1000 ppm of bendamustine. The solution was mix well and filter before injecting into
RESULTS AND DISCUSSION
Optimized Chromatographic Conditions: A reversed phase isocratic HPLC
stability-indicating method was developed for the determination of Bendamustine and a reversed
phase gradient elution technique is developed for the separation of degradants using
reversed-phase liquid chromatography.
(a) The optimum conditions used for the developed method for the determination of
Bendamustine are as follows:
Elution Technique: Isocratic (reversed-phase separation)
HPLC: 1100 Series HPLC System with MWD (UV/VIS
Detector), Agilent Technologies.
Column: Hypersil- C 18 5μ 4.6mm x 250mm column
Mobile Phase: Mobile Phase A.25mM Potassium Dibasic Phosphate Buffer
pH 7; B.100% ACN.
Solvent Strength: 70% Buffer (phosphate pH 7) and 30% ACN. Absorbance: 330 nm
Flow rate: 1.0 mL/min. Injection Volume: 10 µL Run time: 15 minutes.
(b) The optimum conditions used for the developed method for the separation of
Bendamustine degradants are as follows:
Elution Technique: Isocratic (reversed-phase separation)
HPLC: 1100 Series HPLC System with MWD (UV/VIS
Detector), Agilent Technologies.
Column: Hypersil C18, (250x 4.6 mm 5µm particle size)
Mobile Phase: 30:70 Acetonitrile /potassium dibasic phosphate buffer pH 7.0.
Flow Rate: 1 mL/min
Wavelength: 330 nm
Temperature: Ambient
Injection Volume: 10 µL
Validation Parameters: System suitability: The prepared standard solutions of 1000 µg/ml
Bendamustine were injected into the HPLC system under the established optimum separation
conditions. Standard solution 1 was injected six times, and standard solution 2 was injected
twice. The % RSD values for retention times and peak areas of six replicate injections for
Bendamustine standard and two replicate injections for Bendamustine standard 2 were
0.222% and 0.037% respectively. The % Drift, which was calculated using the following
equation, is less than 2%. AS is average peak area of six replicate standard injection and AC is the peak area of check standard. The tailing factor for Bendamustine peak is less than 2.0 and
more than 0.9 and the number of theoretical plates are more than 2000. These results fulfilled
the required system suitability acceptance criteria. Table 1 shows the results.
Table 1: System suitability parameters for Bendamustine.
Solution Stability of Bendamustine: Bendamustine solution was injected immediately and
then after 24, 48 and 72 hours of sample preparation, simultaneously peak areas were
recorded for all the samples injected. All the 3 peak areas were compared with the
immediately injected sample peak area and percentage change was calculated. The
acceptance criteria for percentage change should be less than 2%. Table 2 shows the results
for the solution stability.
Table 2: Solution stability of Bendamustine over a period of 72 hours.
Time Peak Area % Change 0 11007.52 N/A
24 10697.32 2.81 Bendamusitne Hydrochloride Standard 1 Retention Time Retention Time % RSD Tailing Factor Theoretical Plates Peak Area Peak Area %RSD Peak Area % Drift Injection 1 7.410
0.11%
1.335 4326 9028.57
0.11% 0.12%
Injection 2 7.396 1.312 4201 9020.64
Injection 3 7.395 1.305 4218 9015.28
Injection 4 7.385 1.334 4252 9004.87
Injection 5 7.391 1.308 4224 9003.25
Injection 6 7.394 1.318 4235 9010.29
Standard 2 Retention Time Retention Time % RSD Tailing Factor Theoretical Plates Peak Area Peak Area %RSD Injection 1 7.396
0.06% 1.331 4291 9003.67 0.01%
48 10309.07 6.34 72 9692.23 11.94
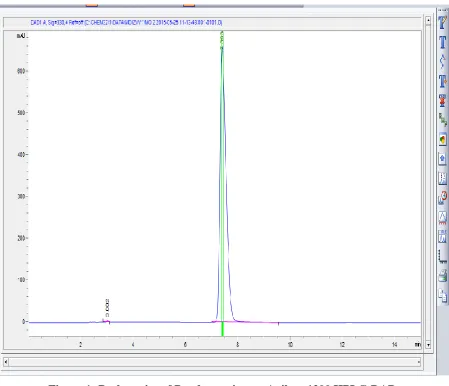
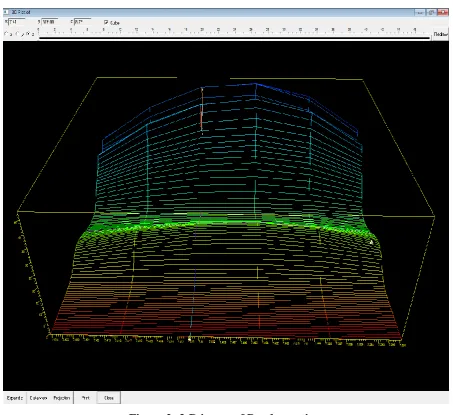
Specificity: Determination of Bendamustine Peak Purity
Once confirmed that the potential degradants are completely resolved from the Bendamustine
peak, the next attempt was to ensure that the Bendamustine chromatographic peak in the
force degraded sample is pure. For that, the degradation samples are mixed and used to test
specificity to show that Bendamustine is pure and separated from their degradants. This
sample was injected in an HPLC instrument equipped with a Diode Array Detector (DAD).
Peak purity tests were performed on Agilent 1200 HPLC system equipped with Diode Array
Detector (DAD). Under the optimum separation conditions, the resulted purity factor is
within the threshold limits. Validity of these results was further supported by the
[image:9.595.73.523.331.717.2]three-dimension plot of Bendamustine chromatographic peak (Figures 1 and 2).
Figure 2: 3-D image of Bendamustine.
Robustness Studies on Bendamustine Raw Material: The impact of deliberately the
optimized chromatographic conditions on the retention and resolution of Bendamustine peak
was investigated. For this research, the following parameters were studied: solvent strength,
pH of buffer, Flow rate and wavelength. The optimized chromatographic conditions were
studied by changing the (a) 0.1% pH (b) 2 nm Wavelength (c) 1% B Composition
(solvent strength) and (d) 0.1% Flow rate. The results of robustness studies are summarized
in Table –3.
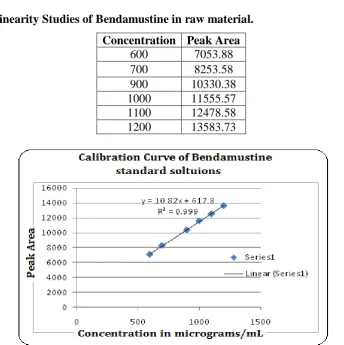
Linearity: The linearity range tested for Bendamustine raw material was between 600 ppm
and 1200 ppm. Solutions with different concentrations of Bendamustine were prepared as
shown in Table 4 and injected into the HPLC system. The obtained peak areas for the
Table 3: Robustness results of bendamustine.
Experimental Parameters Various Conditions Retention Time Tailing Factor
Wavelength
328 7.422 1.552
330(optimum) 7.362 1.549
332 7.428 1.559
Flow rate
0.9 7.440 1.508
1.0 (optimum) 7.362 1.549
1.1 6.793 1.536
pH of buffer
6.9 7.438 1.521
7.0(optimum) 7.362 1.549
7.1 7.440 1.566
% B Composition 29 6.543 1.639
30(optimum) 7.362 1.549
31 8.544 1.639
Table 4: Linearity Studies of Bendamustine in raw material.
[image:11.595.126.471.281.627.2]Concentration Peak Area 600 7053.88 700 8253.58 900 10330.38 1000 11555.57 1100 12478.58 1200 13583.73
Figure 3: Calibration Curve of Bendamustine standard solutions in linearity study.
Accuracy: The accuracy of the developed method was tested to determine closeness of the
measured value to the true value. Accuracy of the developed method was studied by
evaluating the recovery of Bendamustine from spike solutions. The different concentrations
solution was used as standard and serial dilutions of 700ppm, 1000ppm and 1200ppm were
[image:12.595.91.503.643.745.2]prepared. Each sample was prepared in triplicate and injected, giving a total of 9 injections.
Table 5: Summary of Accuracy studies results (Raw Material)
Concentration (ppm) Peak Area Average Peak Area Recovery
700
7841.42
7828.68 99.51% 7826.30
7818.32
1000
11023.04
11021.31 100.8% 11016.36
11024.53
1200
12933.48
12929.64 99.57% 12924.76
12930.70
Precision: The ICH guidelines recommend that repeatability should be assessed using a
minimum nine determinations covering the specified range for the procedure (i.e., 3
concentrations and 3 replicates of each concentration (or) using minimum of six
determinations at 100% of test concentration.
Instrument Precision (Injection Repeatability): Repeatability of injection of Bendamustine
was determined by preparing one solution at 1000ppm of nominal concentration and carrying
out six repeated injections. The precision of peak areas of six injections was calculated as
relative standard deviation (%RSD). This analysis precision met the defined acceptance
criteria of maximum allowable %RSD of NMT 1 %. Then calculate precision and %RSD.
The results can be seen in the Table-6. Method precision was demonstrated by calculating %
RSD of six independent preparations of 100% target concentration of 1000ppm of
Bendamustine. It was also calculated for the impurities of six independent preparations of
1000 ppm and all these were injected into hplc under developed method conditions. The
results can be seen in the Table-7.
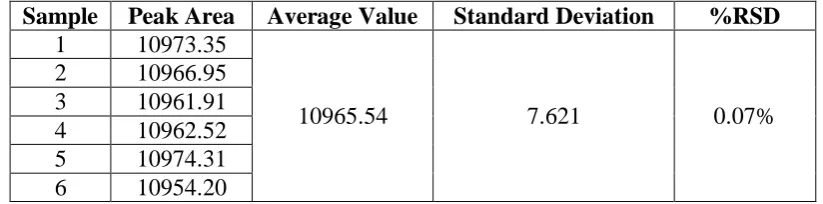
Table 6: Peak area results of six injections of Bendamustine for injection precision.
Sample Peak Area Average Value Standard Deviation %RSD
1 10973.35
10965.54 7.621 0.07%
Table 7: Summary of Method Precision (Raw Material).
Sample Peak Area Average Values Standard Deviation %RSD
1 10772.86
10758.875 7.65% 0.07%
2 10758.56 3 10760.20 4 10755.19 5 10756.23 6 10750.21
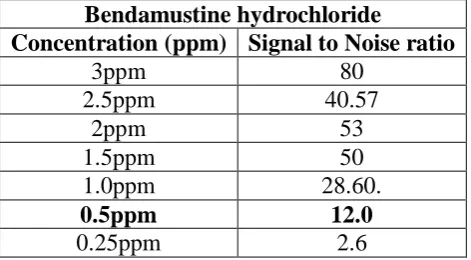
Limit of detection (LOD): The LOD is generally expressed as the concentration of the
analyte sample (i.e., in ppm or in percentage). The detection limit of the developed method is
the lowest analyte concentration that can produce a response detectable above the noise level
of a system, typically, three times the noise level (3:1).
The Limit of Detection (LOD) was evaluated over the course of 10 independent preparations
of low concentrations of Bendamustine Reference Standard. All these 10 solutions are
prepared from the stock solution of 100 ppm, Table 30shows the preparations volume of
stock solution. The cut off criteria was when signal to noise ratio exhibits a 3:1 ratio, which
was found at 0.25ppm. Table 8 displays the summarized results.
Table 8: Signal-to-Noise ratios of various concentrations of Bendamustine for LOD and
LOQ.
Bendamustine hydrochloride
Concentration (ppm) Signal to Noise ratio
3ppm 80
2.5ppm 40.57
2ppm 53
1.5ppm 50
1.0ppm 28.60.
0.5ppm 12.0
0.25ppm 2.6
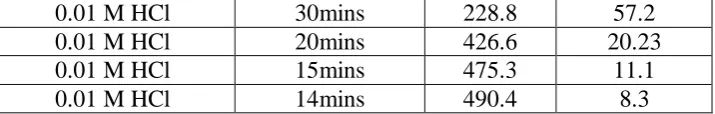
Acid stress study: The following table 9 shows the different concentrations of HCl and their
degradation time and peak areas.
Table 9: Acid degradation study of different concentrations of Bendamustine under
optimized chromatographic conditions.
Concentration of HCl Exposed time Peak Area Degradation
Standard 0 534.8 0
0.01 M HCl 2hour 86.8 83.7
0.01 M HCl 30mins 228.8 57.2
0.01 M HCl 20mins 426.6 20.23
0.01 M HCl 15mins 475.3 11.1
0.01 M HCl 14mins 490.4 8.3
Base stress study: The following table 10 shows the different concentrations of NaoH and
their degradation time and peak areas.
Table 10: Base degradation study of different concentrations of Bendamustine under
optimized chromatographic conditions.
Concentration of NaOH Exposed time Peak Degradation
Standard 534.8
0.01MNaOH 1hour 116.9 78.1%
0.01MNaOH 10 mins 264.1 50.6%
0.01MNaOH 1hour at room Temperature 442.7 17.2% 0.01MNaOH 40mins at room Temperature 489.9 8.3% 0.01MNaOH 30 mins at room Temperature 514.0 3.8%
Oxidative stress study: The resulted chromatograms are evaluated and the degradation
results are given in Table 11.
Table 11: Oxidation study of different concentrations of Bendamustine under optimized
chromatographic conditions.
Parameter Exposed time Peak Area Degradation
Standard 534.8
3% H2O2 1 hour 224.6 58% 3% H2O2 30 mins 360.1 32% 3% H2O2 20 mins 322.9 39% 3% H2O2 15 mins 469.6 12.1% 3% H2O2 13 mins 499.2 6.6% 3% H2O2 10 mins 521.8 2.4% 2% H2O2 1 hour 311.9 41.6% 2% H2O2 30 mins 252.9 52.7 2% H2O2 20 mins 523.1 2.1 2% H2O2 10 mins 515.3 3.6 1% H2O2 1 hour 263.5 50.7 1% H2O2 13 mins 500.1 6.4%
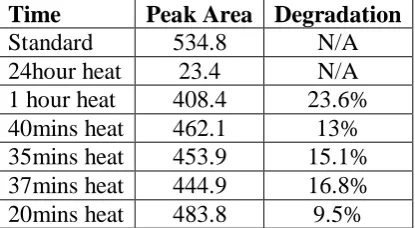
Thermal degradation study: The resulted chromatograms are evalulated, and the
[image:14.595.122.480.73.130.2]Table 12: Heat stress results of Bendamustine under optimized chromatographic
conditions.
Time Peak Area Degradation
Standard 534.8 N/A 24hour heat 23.4 N/A 1 hour heat 408.4 23.6% 40mins heat 462.1 13% 35mins heat 453.9 15.1% 37mins heat 444.9 16.8% 20mins heat 483.8 9.5%
UV-Senstivity study: Bendamustine raw drug is stable against UV light. The resulted
chromatograms were shown in the Figure 15.
Table 13: UV results of Bendamustine under optimized chromatographic conditions.
Time Peak Area Degradation
Standard 534.8 N/A
UV 30 mins 593.4 N/A
UV 1hour 581.4 N/A
UV 24 hours 651.7 N/A
UV 48 hours 578.2 N/A
UV 72 hours 632.8 N/A
CONCLUSION
The developed method was sensitive, accurate and precise Reverse Phase HPLC (isocratic)
for the estimation of Bendamustine HCL in bulk drug and in pharmaceutical formulations. In
the present developed HPLC method, the standard and sample preparation required less time
and no tedious extraction were involved. Thus, the developed method can be easily used for
the routine quality control of bulk and parenteral dosage form (sterile powder for injection) of
Bendamustine HCL within a short analysis time. The currently developed method was also
studied for forced degradation and data was depicted in respective tables. The Bendamustine
was stable and can estimate in various stress conditions. The developed method was accurate
reverse phase HPLC for the estimation of Bendamustine Hydrochloride in a bulk drug and
pharmaceutical formulation. The method was validated for System Suitability, Specificity,
Solution's stability, Robustness, Precision, Accuracy, Linearity and LOD and LOQ.
REFERENCES
[image:15.595.195.403.114.228.2]2. United States National Institutes of Health, http://clinicaltrials.gov/ ct2/results? Term =
bendamustine & no unk = Y (accessed 1.11.11), 2011.
3. J. Teichert, F. Baumann, Q. Chao, C. Franklin, B. Bailey, L. Hennig, K. Caca, K.
Schoppmeyer, U. Patzak, R. Preiss, Cancer Chemother. Pharmacol, 2007; 59: 759.
4. A.G. Bosanquet, Cancer Chemother. Pharmacol, 1985; 14: 83.
5. H. Rosing, W.Y. Man, E. Doyle, A. Bult, J.H. Beijnen, J. Liq. Chromatogr. Relat.
Technol, 2000; 23: 329.
6. US FDA, 2001, w.fda.gov/downloads/Drugs/Guidance Compliance Regulatory
Information/Guidances/ucm070107.
7. C.G. Adair, J.M. Bridges, Z.R. Desai, Cancer Chemother. Pharmacol, 1986; 17: 185.
8. A. Mirkou, B. Vignal, S. Cohen, M. Guillaumont, O. Glehen, J. Guitton, J. Chromatogr.
B: Analyt. Technol. Biomed. Life Sci., 2009; 877: 3089.