Munich Personal RePEc Archive
Payment Scheme Changes and Effort
Provision: The Effect of Digit Ratio
Neyse, Levent and Friedl, Andreas and Schmidt, Ulrich
Kiel Institute for the World Economy
28 October 2014
Online at
https://mpra.ub.uni-muenchen.de/59549/
1
Payment Scheme Changes and Effort Provision:
The Effect of Digit Ratio
Andreas Friedl1, Levent Neyse1 & Ulrich Schmidt1
1
Kiel Institute for the World Economy
ABSTRACT
Economic experiments report that individuals perform better under a piece rate payment scheme in comparison to a fixed payment scheme. The reason is straightforward: incentives motivate people, and without incentives they decrease their effort. Yet women are prone to choose a fixed payment over a piece rate payment scheme. We aim to find out if this gender effect is related to prenatal exposure to testosterone, which by nature is sexually dimorphic and has permanent effects on human brain development with an impact on cognitive and physical skills, as well as behavior. We investigate the effect of prenatal testosterone exposure on performance adjustment in a real effort task. Each subject is salaried under either a fixed rate or piece rate payment scheme for five periods and subsequently encounters the alternative payment method for another five periods. To observe the prenatal testosterone levels that the participants were exposed to during pregnancy, we use the so-called digit ratio as an indirect measurement method. It uses the length-ratio between the participants’ index and ring fingers to infer about their in utero testosterone exposure. Our results confirm the previous findings indicating that individuals perform better when incentivized by a piece rate payment scheme. Subjects who are paid piece rate in the first half of the experiment immediately decrease their performance at the beginning of the second half when paid under a fixed payment scheme. In contrast, subjects increase their effort if the payment method is switched from fixed rate to piece rate in the second half of the experiment. Subjects who were exposed to higher levels of prenatal testosterone provide significantly lower effort when the payment scheme is switched from piece rate to fixed rate.
JEL Codes: C91, D87, J33
Keywords: Digit Ratio, 2D:4D, Real Effort Task, Payment Schemes, Incentives
2
Introduction
Companies adopt various wage strategies to maximize the productivity of their employees. One of those wage strategies that increase efficiency is using piece rate payment schemes (PS hereafter) instead of paying fixed salaries if the job type is suitable. In his celebrated study, Lazear (1986) concludes that piece rate PS yields higher productivity than fixed rate PS. Furthermore, companies may change their wage strategies in some instances. Previous studies have shown that when fixed salaried workers encounter a piece rate PS their performances increase dramatically (Lazear 1996). In case of a PS transition of this sort, a within-subject analysis is sounder than making between-subject comparisons. What is more, a within-subject analysis may enable us to examine the effects of individual differences on the performance adjustment.
What causes the workers to adjust their effort in ways that differ from one individual to another? We fit this question into the research area of digit ratio (hereafter DR) studies and investigate the effects of prenatal testosterone exposure on performance adjustment in a laboratory experiment.1
Compared to earning a fixed amount of money for performing a certain task, employees provide higher effort when they are paid according to their performance. A body of literature compares the outcomes of fixed wage PSs and piece rate PSs and concludes that the latter is more efficient than the former (Lazear 1986, Paarsch & Shearer 2000, Shearer 2004, Dohmen & Falk 2011). In other words, individuals react to incentives. The effectiveness of financial incentives is studied in the meta-analysis of Jenkins et al. (1998), and Laffont & Martimont (2009) formalize the concept of incentives in an economic framework. Also the decades-old evidence in the psychology literature emphasizes the significance of incentives for task performance (See Locke 1968 for a detailed review). Meanwhile, a major argument against financial incentives is that they do not create a lasting increase in commitment or change attitudes, but rather merely motivate people to complete a certain task in the short run (Kohn 1993).2
The evidence on incentives and gender shows that females are more reluctant to compete than males; and males perform better in competitive environments compared to females. Dohmen & Falk (2011) show that females prefer fixed PSs compared to variable PSs. Gneezy et al. (2003) study gender effects in an experiment that contains a real effort task. The subjects are first paid under a piece rate PS, then switched to a tournament based PS. Men’s performance increased after the switch, but women’s performance remained the same. Using a similar design, Niederle & Vesterlund (2007) did not find any significant performance differences between the sexes. Nonetheless, the majority of the women preferred not to be in a tournament while only one quarter of the male participants shunned competition. One common explanation for the competition-averse preferences of women is that they are less
1
Charness & Kuhn (2011) survey the experimental studies in labor economics and discuss the methodology in detail. See also Falk & Fehr (2003) for a discussion of experiments in Labor Market Economics.
2
3 overconfident than men (Lundeberg et al. 1994, Barber & Odean 2001).3 Apart from environmental factors, this gender difference may be caused by some dissimilar physiological traits of the sexes. In particular, prenatal exposure to testosterone might be partly responsible for this gender effect.
Male fetuses are exposed to more testosterone than female fetuses. This exposure has direct effects on the brain development and also on the sensitivity to circulating androgens (Goy & McEwen 1980, Manning et al. 1998). Several cognitive and physical diversities among humans may thus be associated with prenatal testosterone (PT henceforth) (Manning et al. 2003). One of these physical diversities proven to correlate with PT levels is the ratio between the lengths of the index and ring fingers (2d:4d). The so-called DR is a putative indirect marker of PT exposure during pregnancy, for which a low DR indicates a high level of PT exposure (Manning et al. 1998). One apparent conclusion is that females usually have higher DRs than males (See the meta-analysis of Hönekopp 2010). Nevertheless, there can be considerable within-subject variability of the DR levels in male and female samples.
This variation within and between sexes has been used to identify links between a number of somatic traits and DR. For example, superior athletic abilities (Manning & Taylor 2001, Paul et al. 2006, Benett et al. 2010) and a high sperm count (Manning et al. 1998) are negatively correlated with DR.
Since Zuckerman (1994) it is presumed that males are sensation seekers. Studies like Austin et al. (2002), Fink et al. (2006) and Hampson et al. (2008) have confirmed a negative relationship between DR and sensation seeking. However, the results are not fully consistent.4 Additionally, some studies suggest that PT has a negative impact on competitive behavior. Hönekopp et al. (2006) show this effect in athletic activities, but cannot disentangle the correlative relationship between attainment and competitiveness. Pearson & Schipper (2012) and Apicella et al. (2011) cannot demonstrate any significant connection between DR and competitiveness. Meanwhile, Millet & Dewitte (2008) and Millet (2009) explain that individuals with low DR may have a higher need for achievement.
According to evidence, numerous cognitive skills are also positively affected by higher exposure to PT. For example, Slumming & Manning (2000) found such a relation to musical skills. In addition, spatial abilities are negatively correlated with DR (See Puts et al. 2008 for a meta-study). Numerical intelligence (Luxen & Buunk 2005), cognitive reflection test scores (Bosch et al. 2013) and exam marks among male dentistry students (Hopp et al. 2012) are also negatively correlated with DR.5 Since low DR is correlated with higher numerical abilities it may generate profit maximizing decisions as found in economics experiments (Buser 2012).
3
For further evidence regarding gender differences in risk attitudes, social preferences and emotions, see Croson & Gneezy 2009.
4
See the meta-analysis by Voracek (2010) for the relationship between DR and sensation seeking.
5
4 Such a connection would also be in line with the findings of Coates et al (2009) indicating that low DR is associated with higher success in financial markets.6
In the current experiment, subjects engage in a real effort task for 10 periods. Half of the subjects are paid under a fixed rate PS (Treatment 1) and the other half using a piece rate PS (Treatment 2) for the first 5 periods of the task (Phase 1). Next, the PSs are switched for the remaining 5 rounds (Phase 2) of the experiment in both treatments: subjects who are paid a fixed rate in Phase 1 of the task are paid according to their performance in Phase 2, and vice versa for the subjects initially paid a piece rate. This design allows us to focus on the effort provision changes as a reaction to PS modifications. Subjects are not informed about the switch to a different PS until Phase 2. Their performance in Phase 1 can therefore be considered to be independent from the other PS in Phase 2, and it is possible to compare the two PSs with each other. If the previous evidence on the negative effect of DR on the higher
need for achievement (Millet 2009) is valid, we expect different reactions to the switch from
fixed to piece rate PS for low and high DR subjects. Namely, low DR individuals should increase their effort more than high DR individuals. In the reversed case of a switch from a piece rate to a fixed rate PS, we expect individuals with a low DR to decrease their effort significantly more than high DR subjects. A finding of this kind would be an indicator of a relationship between the PT and the behavior as indicated by the game theoretical prediction of the fixed rate PS, which is to not to work at all.
We will demonstrate that there are no significant differences between the two treatments in Phase 1 of the experiment. In addition, DR does not initially play an important role in affecting the performance of the subjects. However, subjects who face the piece rate PS in Phase 2 increase their effort strongly. The effect of DR is highly significant among the subjects who face the fixed rate PS in Phase 2. Those with a lower DR decrease their performance dramatically compared to those who have higher DR. In the next section, we will explain the experimental procedure in detail. Further, we will present the results and conclude.
Experimental Design
The experimental sessions were conducted in 2012 and 2014 at the University of Kiel with a maximum of 20 subjects per session and a total number of 114 student participants. We only use the data from 112 subjects, as two subjects were excluded from the study: one non-Caucasian participant and one participant with a hand injury. Previous studies report that DR is ethnicity-related (Manning et al. 2004), thus running DR studies with subjects with a common ethnic background is a common procedure. After entering the room, the participants were randomly assigned to separate cabins with a computer. Instructions were given on their computer screen and read out loud by the experimenter.
6
5 Our research questions inquire into how people adopt their effort under changing incentive schemes and whether DR plays any role in the behavioral differences in adaptation. To implement the disutility of work, we chose a slider task (Gill and Prowse 2011) as our real effort task, which was computerized and implemented using the Z-tree software (Fischbacher 1999). We chose the slider task as it is easy to understand, the cognitive requirements are low and it has small increments of effort provision. Moreover, it gives sufficient disutility of effort provision, which is an especially necessary characteristic. The experiment would be compromised if the task provided some form of enjoyment. Post-experiment debriefing showed that the task was sufficiently unpleasant not to be considered an enjoyable task in itself. Furthermore, Gill and Prowse (2011) do not find ability differences between men and women in the slider task. In addition, the task does not allow confidence to play a role in the performance, thus it is not a masculine task.7
In the real effort task, participants find 48 sliders on their screen (See Figure A2 in the Appendix). Each slider can be adjusted to values between 0 and 100, and the task is to set these sliders exactly to 50. Each round takes 2 minutes, with all sliders reset at the end of the period and the total amount of set sliders visualized to the subjects.8 The average duration of the whole task is thus around 22 minutes, including the information screen before the PS switch. The entire protocol lasts 50 minutes. On average, the participants earned €14.
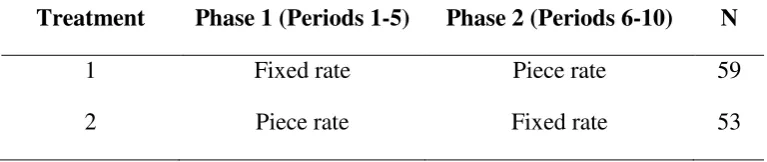
We chose a within-subject design with all subjects facing both PSs. In Treatment 1 (T1), subjects play the task for 5 periods (Phase 1) under a fixed rate PS. Then they continue the task for another 5 rounds (Phase 2) paid under a piece rate PS. In the mirror Treatment 2 (T2), the subjects are initially paid piece rate, then the PS is switched to fixed rate in Phase 2 (See Table 1). As it is seen, the dominant strategies of all participants are to set as many sliders as they can when they are paid a piece rate and not to work at all when the fixed rate PS is current.
Before each treatment, subjects are informed about their PS for the following task on a separate screen. Under fixed rate PS, participants earned a fixed wage of 125 tokens 6regardless of the number of correctly set sliders. Under piece rate PS, subjects earned one token for each slider. At the end of the experiment, each token earned was worth € .03. The fixed wage of 125 tokens is more than most subjects9 achieved during the piece rate PS. This was designed to avoid causing a subject that switches from a piece rate to a fixed rate PS to regard this switch as a wage decrease. By setting this fixed wage, we make effort reduction less likely.
7
Several studies argue that the difficulty of a task and gender differences are related due to the differences in confidence between the players’ types. See Moore & Small (2004), Lundeberg et al. (1994) and Niederle & Vesterlund (2007).
8
No subject was able to set more than 48 sliders in two minutes. This means that there was no upper limit for effort provision in this task.
9
6
Table 1: Treatments
Treatment Phase 1 (Periods 1-5) Phase 2 (Periods 6-10) N
1 Fixed rate Piece rate 59
2 Piece rate Fixed rate 53
Additionally, we included a brief post-experiment questionnaire asking about demographic and socioeconomic factors. To gather the DR data, we scanned the right hands of the participants using a high-resolution scanner (Epson Perfection 1660). The DR scanning and measuring protocol was identical to Neyse & Brañas-Garza (2014). Two different researchers measured DR using ©Adobe Photoshop. The correlation between the two measurements was highly significant at a .95 level.
Experimental Results
The average DR is .965 (±.005) for the male participants and .976 (±.005) for the female participants (See Figure A1 in the Appendix). A two-sample mean comparison test shows that
t=-1.5586 with 110 degrees of freedom (p=.1220). Even though the literature finds stronger
differences in gender, the effect size of gender (cohen’s d ≈ .29) lies well within the suggested confidence interval (≈ .35) of Hönekopp, (2010).
The average effort level is 17.03 (SD 6.18) over the 10 periods. The mean score under fixed rate PS is 16.13 (SD 5.53), and 17.99 (SD 5.14) under the piece rate PS. A two sample mean comparison test rejects the null hypothesis that the mean scores for the two PSs are equal (t= -2.6644, p=.0083). This result confirms that the effort levels are higher under the piece rate PS.
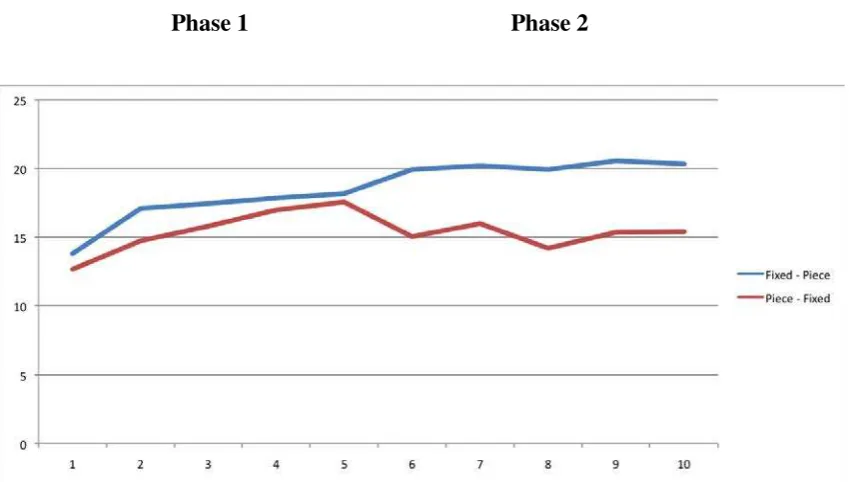
Figure 1 illustrates the average scores in each period of the experiment. The blue trend line represents T1 where subjects start the task under a fixed rate PS, whereas the red trend line shows the average scores for T2 where subjects are paid under a piece rate PS in the first 5 periods. The graph shows that the performance of the subjects follows a similar pattern until the 5th period. The average scores for the two treatments in Phase 1 (the first 5 periods) are not significantly different (coeff=1.330, p=.130).10 If we focus on each of the 5 periods of Phase 1 separately, the only significant difference in effort provision occurs in period 2
(coeff= 2.384,p=.046), but this difference does not persist over the phase. The reason behind
this indifference is that the subjects are not informed about the existence of another PS, so they lack a reference point to compare their PS to.11 Effort levels increase over the first 5
10
Panel data GLS regression result, controlled for period effects.
11
7 periods, which is a common trend in real effort tasks. This effect is significant for both treatments (p=.000) in the panel data analysis.
[image:8.595.72.497.283.524.2]In Phase 2, however, this effort pattern changes as expected. The switch from a fixed rate PS to a piece rate PS increases the average scores from Phase 1 to Phase 2, whereas the switch from a piece rate to fixed rate PS does not (p=.000 and p=.424, correspondingly).12 If we focus solely on the 5th and 6th period, the average score increases by 9.80% for T1; meanwhile, for T2, the decrease is 14.28%. This switch effect is significant for both treatments at p=.0253 and p=.0592, respectively (t=-2.2657 for T1; t=-1.9075 for T2).
Figure 1: Average Scores per Treatment over the 10 Periods
Phase 1 Phase 2
Panel data analysis shows that the effort levels for T1 are significantly higher than for T2 over rounds 6 to 10 (p=.000). The average score in Phase 2 of the experiment is 15.2 (SD 7.13) for the fixed rate PS and 20.18 (SD 3.38) for the piece rate PS.
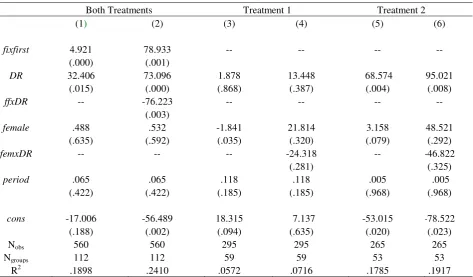
Table 2 presents the panel regression analysis of the effort levels for both phases of the experiment. The first two models of each phase include the subjects in both treatments together, which are followed by the models of the two treatments separately. Models (2), (4) and (6) additionally include interaction variables, whereas (1), (3) and (5) do not. The dependent variable is effort for all regressions, which represents the number of sliders the subjects correctly set in each period. fixfirst is a dummy variable that is equal to 1 if the subjects faced the fixed rate PS first and the piece rate PS second (T1). DR represents the digit ratio, which lays between .88 and 1.07 and ffxDR the interaction between DR and fixfirst. We
12
8 use this binary variable to disentangle the effects of DR and the treatments. female is the dummy variable for gender; it is equal to 1 for women and 0 for men. We control for the interaction between female and DR using the femxDR variable. Finally, period is the time variable, which is 1 to 5 for Phase 1 and 6 to 10 for Phase 2.
There is no effect of DR or the treatment on effort provision in the first phase of the experiment. The period variable gives the only significant result, which points to an increase in effort during Phase 1. This increase could be due to learning effects as subjects get accustomed to the task during the first periods. The lack of significance of fixfirst in Phase 1 is not surprising because the subjects do not have any reference points in terms of incentives in Phase 1 of the experiment. However, when subjects are able to compare fixed payment and piece rate PSs, they adjust their effort in Phase 2 of the experiment.
The second part of the table (Phase 2) shows that the subjects indeed adjust their performance according to the PS switch. The first column shows a strong positive effect of fixfirst and DR. However, the interaction term ffxDR in the second model reveals that the effect of DR is due to the subjects in T2. Models (3) and (4) show that, the effect of DR is not due to subject behavior during T1. The last two models, (5) and (6), confirm that the effect of DR on effort
originates from the subjects in T2. When the PS is switched from piece rate to fixed rate, high DR subjects work harder than the subjects who have low DR (p<.01 in both models). There is no such impact of DR in T1.
Gender does not play an important role other than in T1 in Phase 1. Column (3) show that the effort levels of females are slightly lower than the males, yet the significant level is only .057.
In Phase 2 females of the first treatment pay significantly less effort (p=.035) than males. This result is in line with the previous evidence in the literature saying that women performs worse under variable PS (Dohmen & Falk (2011), Gneezy et al (2003)). The gender effect disappears when we include the interaction variable femxDR, in the model in the columns (4) in both phases, which points out a joint effect of gender and DR. In T2, no gender effect is found in the first phase, even without the interaction term. Small significance of female
variable in column (5) at 7% significance level disappears when we introduce the interaction variable. However the significance of DR remains. This result shows that positive effect of is not due to gender effect. The period variable does not affect effort in Phase 2, which points to no repetition effects.
Since we are not focusing on the effort levels but the effort adjustment behavior of the subjects, we now take a closer look at the results in Phase 2. The interesting result here is the prominent effect of DR in the T2, but not in T1. On-going discussion concerning the effect of
9
Table 2: Regressions by Phases
PHASE 1
Both Treatments Treatment 1 Treatment 2
(1) (2) (3) (4) (5) (6)
fixfirst 1.277 18.399 -- -- -- --
(.148) (.411)
DR 5.585 14.998 -1.325 -.637 13.815 7.555 (.630) (.375) (.908) (.968) (.513) (.815)
ffxDR -- -17.633 -- -- -- --
(.443)
female -1.071 -1.061 -1.682 -.275 -.374 -11.112
(.229) (.234) (.057) (.990) (.816) (.790)
femxDR -- -- -- -1.446 -- 11.082
(.950) (.797)
period 1.066 1.067 .944 .944 1.203 1.203
(.000) (.000) (.000) (.000) (.000) (.000)
cons 7.496 -1.637 16.162 15.497 -1.263 4.773
(.503) (.920) (.144) (.314) (.951) (.879)
Nobs 560 560 295 295 265 265
Ngroups 112 112 59 59 53 53
R2overall .0903 .0937 .1194 .1195 .0687 .0697
PHASE 2
Both Treatments Treatment 1 Treatment 2
(1) (2) (3) (4) (5) (6)
fixfirst 4.921 78.933 -- -- -- --
(.000) (.001)
DR 32.406 73.096 1.878 13.448 68.574 95.021 (.015) (.000) (.868) (.387) (.004) (.008)
ffxDR -- -76.223 -- -- -- --
(.003)
female .488 .532 -1.841 21.814 3.158 48.521
(.635) (.592) (.035) (.320) (.079) (.292)
femxDR -- -- -- -24.318 -- -46.822
(.281) (.325)
period .065 .065 .118 .118 .005 .005
(.422) (.422) (.185) (.185) (.968) (.968)
cons -17.006 -56.489 18.315 7.137 -53.015 -78.522
(.188) (.002) (.094) (.635) (.020) (.023)
Nobs 560 560 295 295 265 265
Ngroups 112 112 59 59 53 53
R2 .1898 .2410 .0572 .0716 .1785 .1917 Notes: Panel Data, GLS regressions; p-values are given in the parentheses. Dependent variable is effort, where
period is the time variable that is [1,5] for Phase 1 and [6,10] for Phase 2. Models (1) and (2) include both
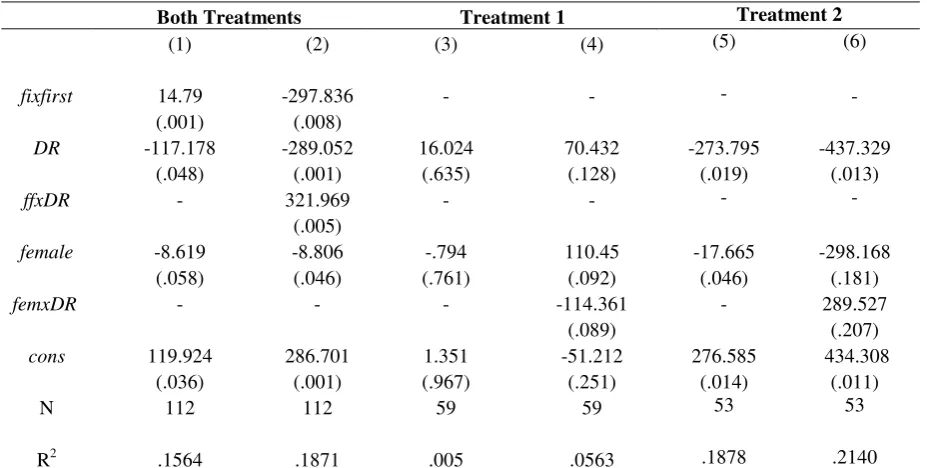
10 In addition to panel data analysis, which focuses on the absolute levels of effort, we run another set of OLS regressions to study the change in effort levels after the PS switch at the end of 5th period (See Table 3). The new variable diff stands for the difference between the total effort level under piece rate PS and fixed rate PS (∑piece - ∑fix). In all of the six models,
diff is the dependent variable and all independent variables correspond to the ones in Table 2.
[image:11.595.67.531.243.477.2]The first section of the table includes both treatments jointly; the second and third parts are devoted to the two treatments separately.
Table 3: Regressions of Effort Adjustment Behavior
Both Treatments Treatment 1 Treatment 2
(1) (2) (3) (4) (5) (6)
fixfirst 14.79 -297.836 - - - -
(.001) (.008)
DR -117.178 -289.052 16.024 70.432 -273.795 -437.329 (.048) (.001) (.635) (.128) (.019) (.013)
ffxDR - 321.969 - - - -
(.005)
female -8.619 -8.806 -.794 110.45 -17.665 -298.168
(.058) (.046) (.761) (.092) (.046) (.181)
femxDR - - - -114.361 - 289.527
(.089) (.207)
cons 119.924 286.701 1.351 -51.212 276.585 434.308
(.036) (.001) (.967) (.251) (.014) (.011)
N 112 112 59 59 53 53
R2 .1564 .1871 .005 .0563 .1878 .2140 Note: p-values are given in the parentheses. OLS regressions. Dependent variable is diff. The first two models include all the subjects, whereas columns (3) an (4) are devoted to T1 and the latter two models include the subjects of T2. dr is the digit ratio variable, fix first is a dummy for treatment effects and is 1 for T1, 0 for the second. ffxDR is the interaction term between variables dr and fix first. female is the gender variable and femxDR
is the interaction variable for dr and female.
When both treatments are studied jointly, the negative sign of DR in columns (1) and (2) supports the idea that a low DR is associated with higher effort under a piece rate PS in comparison to a fixed rate PS (p=.048 and p=.001, respectively). The significant positive effect of fixfirst in the first two models is in line with the previous results; when the PS is switched from fixed rate to piece rate, the effort level rises as well. Interaction variable ffXDR
shows that the effect of DR on diff is mainly due to T2.
Models (3) and (4) focusing on T1 do not provide any significant results neither for DR nor
female. That is, we do not observe any effect of testosterone or gender.
11 significant (p=.013). This results show that the subjects with low DR react to PS changes faster in T2 and this effect of DR is not due to the gender.
Conclusion
The evidence on incentives and gender showed that females prefer fixed rate PS over variable PS. We examine the effects of gender and exposure to testosterone on the effort provision under different PS’s to find out if this gender effect may be related to PT.
The results of our study suggest that PT might have a partial impact on effort provision decisions of the participants in a real effort task. We observe different patterns of performance adjustment behavior among individuals when they are subject to PS changes, and we find evidence for a relationship between the DR and the adjustment behavior. When fixed salaried subjects switch to a piece rate PS they increase their effort provision significantly. This is clearly due to the effectiveness of incentives: people increase their effort when they are paid according to their performance. Providing the highest effort possible is the dominant strategy under the piece rate PS.
And yet, we do not find any impact of DR in this group of subjects. Various studies have investigated the possible associations between PT and status seeking, but have not yet reached a solid consensus. Our first hypothesis on higher need for achievement does not find any support in the results of the current study. If such a relationship existed we would have found that individuals with low DR increase their effort provision more than subjects with higher DR. Since this is not the case, the uncertainty of the connection between PT and higher need
for achievement remains.
The findings confirm our second hypothesis on the behavior of the individuals for whom the PS switches from piece rate to fixed rate. Not working at all is the dominant strategy under the fixed rate PS. As predicted, when piece rate salaried individuals change to a fixed rate PS in Phase 2 of the experiment, they decrease their effort levels. In this scenario, we observe a solid difference between the behaviors of high and low DR individuals. Subjects with low DR decrease their effort significantly more than subjects with high DR. Buser (2012) shows that low DR individuals give less in Dictator, Trust and Public Good Games. If the motive behind transferring low amounts in those experiments is self-centered preferences of low DR subjects, our results may support this argument. When players are not given any incentives and if there is no risk of being dismissed from employment, not working at all is the dominant strategy. Therefore, providing no effort under the fixed rate PS cannot be interpreted as a norm-violating decision in our design.
12 Another crucial point is the fact that our results do not point out conclusive evidence regarding the impact of biological differences. These are sample-dependent, indicatory results that cannot be taken as straightforward indicators of skills and personality traits. In particular, it is not feasible or recommended to make professional decisions such as investment or employment based on biological properties of individuals. Still, investigating the biological underpinnings of individual differences is substantial for the purpose of exploring the physical and behavioral diversity of human beings.
References
Apicella, C. L., Dreber, A., Gray, P. B., Hoffman, M., Little, A. C., & Campbell, B. C. (2011). Androgens and competitiveness in men. Journal of Neuroscience, Psychology, and Economics, 4(1), 54.
Austin, E. J., Manning, J. T., McInroy, K., & Mathews, E. (2002). A preliminary investigation of the associations between personality, cognitive ability and digit ratio. Personality and individual differences, 33(7), 1115-1124.
Barber, B. M., & Odean, T. (2001). Boys will be boys: Gender, overconfidence, and common stock investment. The Quarterly Journal of Economics, 116(1), 261-292.
Bennett, M., Manning, J. T., Cook, C. J., & Kilduff, L. P. (2010). Digit ratio (2D: 4D) and performance in elite rugby players. Journal of sports sciences, 28(13), 1415-1421.
Bosch Domènech, A., Brañas P., & Espín A. M. (2013). Fetal Testosterone (2D: 4D) as
Predictor of Cognitive Reflection (No. 698).
Brañas-Garza, P., & Rustichini, A. (2011). Organizing effects of testosterone and economic behavior: Not just risk taking. PloS one, 6(12), e29842.
Brañas-Garza, P., Kovářík, J., & Neyse, L. (2013). Second-to-fourth digit ratio has a non-monotonic impact on altruism. PloS one, 8(4), e60419.
Buser, T. (2012). Digit ratios, the menstrual cycle and social preferences. Games and
Economic Behavior, 76(2), 457-470.
Charness, G., & Kuhn, P. (2011). Lab labor: What can labor economists learn from the lab?. Handbook of labor economics, 4, 229-330.
Coates, J. M., Gurnell, M., & Rustichini, A. (2009). Second-to-fourth digit ratio predicts success among high-frequency financial traders. Proceedings of the National Academy of Sciences, 106(2), 623-628.
13 Dohmen, T., & Falk, A. (2011). Performance pay and multidimensional sorting: Productivity, preferences, and gender. The American Economic Review, 101(2), 556-590.
Falk, A., & Fehr, E. (2003). Why labour market experiments?. Labour Economics, 10(4), 399-406.
Fink, B., Neave, N., Laughton, K., & Manning, J. T. (2006). Second to fourth digit ratio and sensation seeking. Personality and Individual Differences, 41(7), 1253-1262.
Eisenberger, R., & Cameron, J. (1996). Detrimental effects of reward: Reality or myth?.
American psychologist, 51(11), 1153.
Fischbacher, U. (2007). z-Tree: Zurich toolbox for ready-made economic experiments.
Experimental economics, 10(2), 171-178.
Garbarino, E., Slonim, R., & Sydnor, J. (2011). Digit ratios (2D: 4D) as predictors of risky decision making for both sexes. Journal of Risk and Uncertainty, 42(1), 1-26.
Gill, D., & Prowse, V. L. (2011). A novel computerized real effort task based on sliders (No. 5801). Discussion paper series//Forschungsinstitut zur Zukunft der Arbeit.
Gneezy, U., Niederle, M., & Rustichini, A. (2003). Performance in competitive environments: Gender differences. The Quarterly Journal of Economics, 118(3), 1049-1074.
Goy R, McEwen B (1980) Sexual Differentiation of the Brain. Cambridge, MIT Press.
Hampson, E., Ellis, C. L., & Tenk, C. M. (2008). On the relation between 2D: 4D and sex-dimorphic personality traits. Archives of sexual behavior, 37(1), 133-144.
Hopp, R. N., de Moraes, J. P., & Jorge, J. (2012). Digit ratio and academic performance in dentistry students. Personality and Individual Differences, 52(5), 643-646.
Hönekopp, J., & Watson, S. (2010). Meta‐analysis of digit ratio 2D: 4D shows greater sex difference in the right hand. American Journal of Human Biology,22(5), 619-630.
Hönekopp, J., T Manning, J., & Müller, C. (2006). Digit ratio (2D: 4D) and physical fitness in males and females: Evidence for effects of prenatal androgens on sexually selected traits.
Hormones and Behavior, 49(4), 545-549
Jenkins Jr, G. D., Mitra, A., Gupta, N., & Shaw, J. D. (1998). Are financial incentives related to performance? A meta-analytic review of empirical research. Journal of Applied Psychology, 83(5), 777.
Kohn, A. (1993). Why incentive plans cannot work?. Harvard Business Review, 54.
Laffont, J. J., & Martimort, D. (2009). The theory of incentives: the principal-agent model. Princeton University Press.
14 Lazear, E. P. (1996). Performance pay and productivity (No. w5672). National bureau of economic research.
Locke, E. A. (1968). Toward a theory of task motivation and incentives. Organizational
behavior and human performance, 3(2), 157-189.
Lucas, M., & Koff, E. (2010). Delay discounting is associated with the 2D: 4D ratio in women but not men. Personality and Individual Differences, 48(2), 182-186.
Lundeberg, M. A., Fox, P. W., & Punćcohaŕ, J. (1994). Highly confident but wrong: Gender differences and similarities in confidence judgments. Journal of educational psychology,
86(1), 114.
Luxen, M. F., & Buunk, B. P. (2005). Second-to-fourth digit ratio related to verbal and numerical intelligence and the Big Five. Personality and Individual Differences, 39(5), 959-966.
Manning, J. T., Scutt, D., Wilson, J., & Lewis-Jones, D. I. (1998). The ratio of 2nd to 4th digit length: a predictor of sperm numbers and concentrations of testosterone, luteinizing hormone and oestrogen. Human reproduction, 13(11), 3000-3004.
Manning, J. T., & Taylor, R. P. (2001). Second to fourth digit ratio and male ability in sport: implications for sexual selection in humans. Evolution and Human Behavior, 22(1), 61-69.
Manning, J. T., Bundred, P. E., Newton, D. J., & Flanagan, B. F. (2003). The second to fourth digit ratio and variation in the androgen receptor gene.Evolution and Human Behavior, 24(6), 399-405.
Manning, J. T., Stewart, A., Bundred, P. E., & Trivers, R. L. (2004). Sex and ethnic differences in 2nd to 4th digit ratio of children. Early Human Development, 80(2), 161-168.
Millet K, Dewitte S (2008)A subordinate status position increases the present value of financial resources for low 2D:4D men. Am J Hum Biol 20:110–115.
Millet, K. (2009). Low second-to-fourth-digit ratio might predict success among high-frequency financial traders because of a higher need for achievement. Proceedings of the
National Academy of Sciences of the United States of America, 106(11), E30.
Moore, D. A., & Small, D. A. (2007). Error and bias in comparative judgment: on being both better and worse than we think we are. Journal of personality and social psychology, 92(6), 972.
Neyse, L., & Brañas-Garza, P. (2014). Digit ratio measurement guide (No. 1914). Kiel Working Paper.
15 Nye, J. V., Androuschak, G., Desierto, D., Jones, G., & Yudkevich, M. (2012). 2D: 4D asymmetry and gender differences in academic performance. PloS one, 7(10), e46319.
Paarsch, H. J., & Shearer, B. (2000). Piece rates, fixed wages, and incentive effects: Statistical evidence from payroll records. International Economic Review, 41(1), 59-92.
Paul, S. N., Kato, B. S., Hunkin, J. L., Vivekanandan, S., & Spector, T. D. (2006). The big finger: the second to fourth digit ratio is a predictor of sporting ability in women. British journal of sports medicine, 40(12), 981-983.
Pearson, M., & Schipper, B. C. (2012). The Visible Hand: Finger ratio (2D: 4D) and competitive bidding. Experimental Economics, 15(3), 510-529.
Puts, D. A., McDaniel, M. A., Jordan, C. L., & Breedlove, S. M. (2008). Spatial ability and prenatal androgens: Meta-analyses of congenital adrenal hyperplasia and digit ratio (2D: 4D) studies. Archives of sexual behavior, 37(1), 100-111.
Romano, M., Leoni, B., & Saino, N. (2006). Examination marks of male university students positively correlate with finger length ratios (2D: 4D). Biological Psychology, 71(2), 175-182.
Sanchez-Pages, S., & Turiegano, E. (2010). Testosterone, facial symmetry and cooperation in the prisoners' dilemma. Physiology & behavior, 99(3), 355-361.
Schipper, B. (2012). Sex hormones and choice under risk (No. 12, 7). Working Papers, University of California, Department of Economics.
Shearer, B. (2004). Piece rates, fixed wages and incentives: Evidence from a field experiment. The Review of Economic Studies, 71(2), 513-534.
Slumming VA, Manning JT (2000) Second to fourth digit ratio in elite musicians: evidence for musical ability as an honest signal of male fitness. Evolution and Human behavior 21: 1– 9.
Stenstrom, E., Saad, G., Nepomuceno, M. V., & Mendenhall, Z. (2011). Testosterone and domain-specific risk: Digit ratios (2D: 4D and< i> rel</i> 2) as predictors of recreational, financial, and social risk-taking behaviors. Personality and Individual Differences, 51(4), 412-416.
Voracek, M., Tran, U. S., & Dressler, S. G. (2010). Digit ratio (2D: 4D) and sensation seeking: New data and meta-analysis. Personality and Individual Differences, 48(1), 72-77.
16
[image:17.595.116.480.121.385.2]Appendix
Figure A1: Digit Ratios by Gender
[image:17.595.73.528.459.672.2]